3318
Effects of fibre dispersion and myelin content on R2*: simulations and post-mortem experiments1Institut für Systemische Neurowissenschaften, Universitätklinikum Hamburg-Eppendorf, Hamburg, Germany, 2Berlin Ultrahigh Field Facility (B.U.F.F.), Max-Delbrueck-Center for Molecular Medicine in the Helmholtz Association, Berlin, Germany, 3Paul Flechsig Institute of Brain Research, University of Leipzig, Leipzig, Germany, 4Department of Neurophysics, Max Planck Institute for Human Cognitive and Brain Sciences, Leipzig, Germany, 5Center for Cognitive Neuroscience Berlin, Free University Berlin, Berlin, Germany, 65Felix Bloch Institute for Solid State Physics, Faculty of Physics and Earth Sciences, Leipzig University, Leipzig, Germany
Synopsis
We studied the impact of fibre dispersion and myelin on the angle-dependent gradient-recalled echo signal decay in simulation and experimental data from post-mortem tissue. We compared the classical log-mono-exponential and quadratic time-dependent signal model (M2) derived from Wharton and Bowtell’s forward-model with and without myelin-water contribution. We found that R2*-angular dependency was modulated by fibre dispersion and the R2*-angular dependency is removed using M2. We also observed that the higher-order parameter estimated from experimental data at small angles and dispersion was only reflected in simulations when accounting for myelin-water contributions, indicating that this pool needs to be added into M2.
Introduction
The apparent transverse relaxation rate R2* (1/T2*) derived from multi-echo gradient-recalled echo (GRE) MR images is sensitive to brain tissue microstructure including fibre’s myelination1, dispersion2, and their mean angular orientation (θμ) relative to the main magnetic field, B03. We recently showed4 that the R2* θμ-dependency can be removed based on a single-orientation multi-echo GRE measurement using an approximation of the hollow-cylinder fibre model (HCFM)5, where this θμ-dependence contribution only scales with the square of the echo time (TE). However, our model only accounted for intra- and extra-axonal water, neglecting the myelin-water pool and the possible fibre dispersion within the MRI voxel. In this study, we aim at answering two follow-up questions: how does the myelin-water pool (1) and dispersion (2) affect the model parameters4? To this end, we extended our recently introduced simulation approach of the HCFM with dispersion2 to generate the orientation-dependent GRE-signal decay without and with the myelin-water pool. We then compared the resulting model parameters from our simulations with the fitted model parameters from ex vivo data of an human optic chiasm (OC) sample using multi-echo GRE MRI acquired at 7T for different tissue orientation to B0. We included the information of fibre dispersion extracted from a diffusion-weighted MRI (dMRI) from the same specimen acquired at 9.4T.Methods
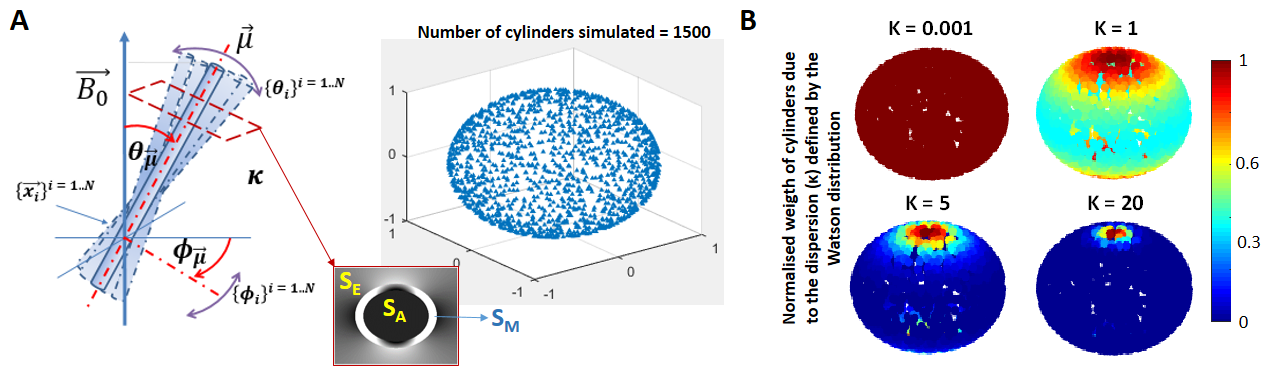
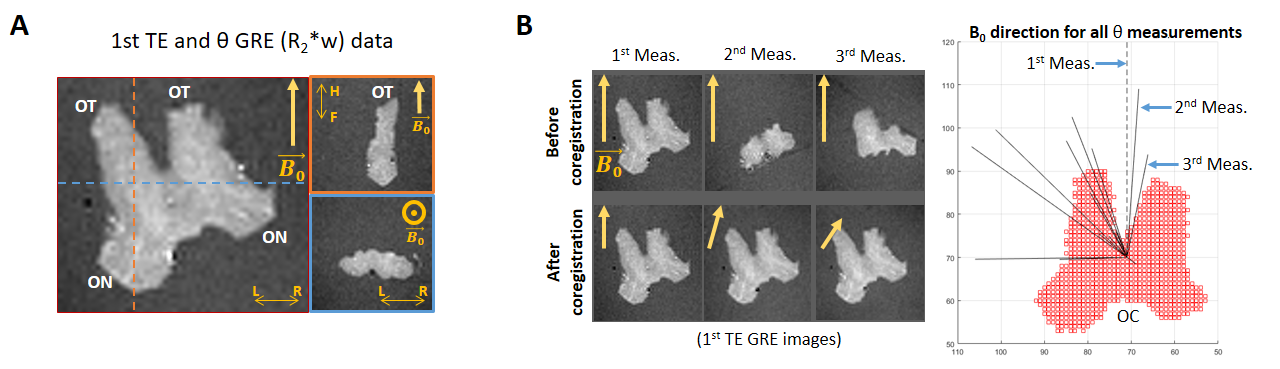
Simulated dataset: Two ensemble-averaged signals (EAS) with 1500 evenly distributed cylinders (Figure 1A) around a mean direction $$$\vec{\mu}$$$ (with an angle θμ to B0) were simulated. Each cylinder’s signal was based on the HCFM with their model-parameter values5 by containing the extra- and intra-axonal compartments signal without (for the 1st EAS) or with (for the 2nd EAS) myelin-water pool. The dispersion effect was incorporated by weighting the signal of each cylinder around $$$\vec{\mu}$$$ by the Watson distribution6 (modulated by kappa, κ, Figure 1B). Each EAS was sampled 5000 times with additive Gaussian complex noise to achieve an experimentally-akin signal-to-noise ratio of 1007. The simulation sampling scheme was: θμ from 2 to 90° (steps of 2°), κ from 0.001 to 6 (steps of 0.25) and TE from 3 to 54 ms (steps of 3.34 ms). The latter replicated the GRE measurements (Table 1) and fulfilled the static dephasing regime5.Experimental dataset: R2*-weighted GRE (Figure 2A) and multi-shell dMRI data were acquired at 7T and 9.4T for a human OC sample, respectively. The relevant acquisition information, pre- and post-processing steps per each dataset are given in Table 1. Using the main diffusion direction ($$$\vec{V_1}$$$, from dMRI analysis) and the $$$\vec{B_0}$$$ directions (from GRE preprocessing), the voxel-wise angular orientation (θμ = $$$acos(\vec{V_1} \cdot \vec{B_0})$$$) was estimated.
Inverse model: The experimental and both simulated signals were fitted to two signal models of the form:
$$\log(|S|) \approx \beta_0^M + \beta_1^M TE + \alpha_2 TE^2$$
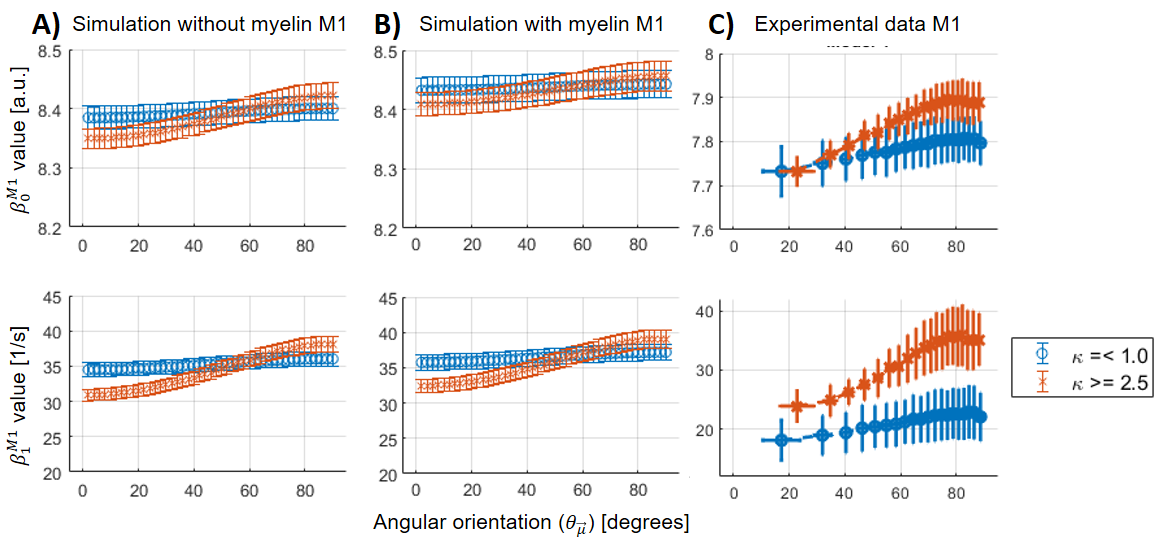
where the α2-coefficient was as follows: $$$\alpha_2(\theta_\mu) = 0$$$ (classical model, M1), and $$$\alpha_2(\theta_\mu) = \beta_2(\theta_\mu)$$$ (quadratic model, M2). The β-parameters ($$$\beta_{0,1}^M$$$ with M representing the model, and $$$\beta_{2}$$$) were fitted by linear regression. The experimental dataset was analysed voxel-wise per θμ-measurement, and the simulated data were analysed per θμ and κ. The experimental and simulated fitted β-parameters were compared for two κ ranges (κ < 1 for highly dispersed and κ > 2.5 for moderately high aligned fibres) using the coregistered κ map (see Table 1). For the experimental data, only WM voxels were used across all measurements, while the simulated dataset replicated the distribution of κ (not shown) in the aforementioned experimental-determined κ ranges.
Results and discussion
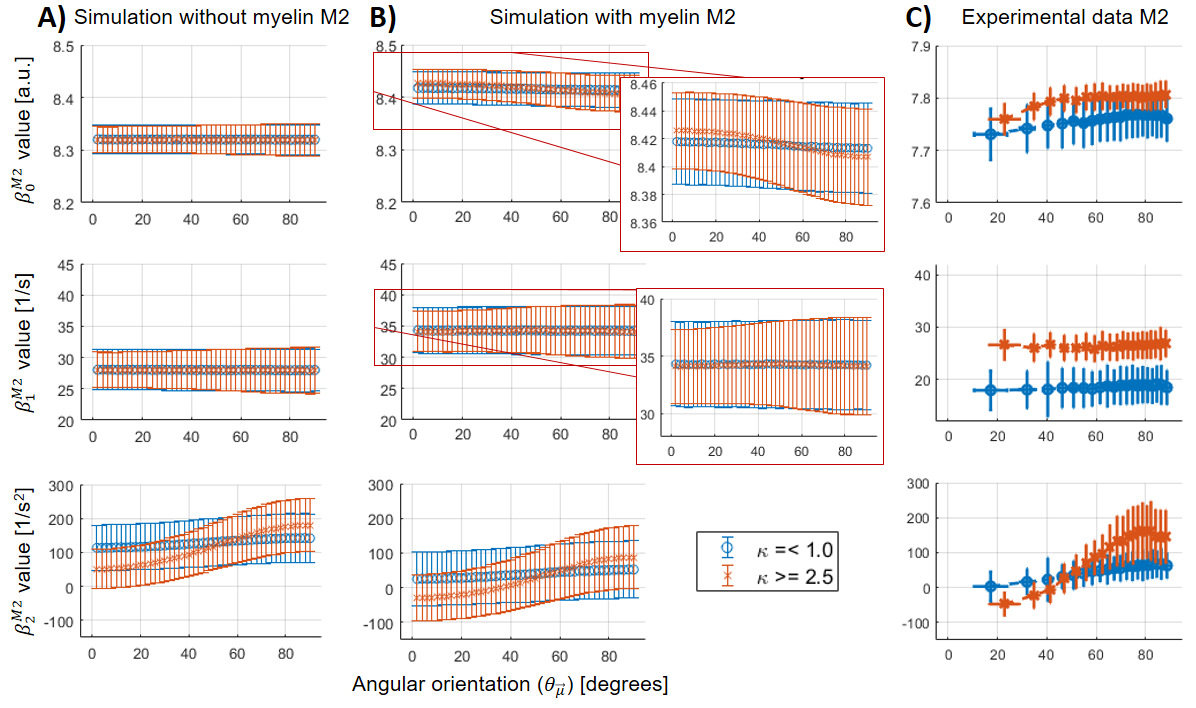
For all the analysed datasets, the β-parameters for M1 ($$$\beta_{0,1}^{M1}$$$) showed a θμ-dependency (Figure 3A-C), which was modulated as a function of dispersion (i.e. increasing θμ-dependency at higher κ).For M2, the θμ-dependency of $$$\beta_1^{M2}$$$ was mostly (Figure 4B) to completely removed (Figure 4A), but highly present in $$$\beta_2$$$. However, some residual θμ-dependency was still observed on $$$\beta_{0,1}^{M2}$$$ in the case of the simulated data with myelin-water contribution (Figure 3B, zoomed plots). In the experimental results, $$$\beta_0^{M1}$$$ has to be interpreted with caution because of varying coil-sensitivity with orientation. Also, the offsets in $$$\beta_{0,1}^{M2}$$$ at different dispersion ranges were not replicated in the simulations. For $$$\beta_2$$$, the modulating effect of dispersion was similar between all datasets, but the offset at small angles as observed in the experimental data could only be reproduced in simulated data with myelin-pool contribution.
Conclusion
In this work, we used experimental and simulated MR data to show that fibre dispersion decreases the θμ-dependency of model parameters, whereas the θμ-dependency is almost unaffected by the myelin-water contribution. However, for $$$\beta_2$$$, we found that for small angles the observed offset in the experimental data could only be explained when incorporating the myelin-water compartment into the model used for the simulations. Our findings indicate that at small angles the inclusion of myelin might reveal new insights. Future work will explore (1) the effect of shorter-TE regimes, in which the influence of the myelin-water pool will become more important, and (2) the impact of special fibre configurations such as acute crossing fibres.Acknowledgements
This work was supported by the German Research Foundation (DFG Priority Program 2041 "Computational Connectomics”, [MO 2397/5-1; MO 2249/3–1], by the Emmy Noether Stipend: MO 2397/4-1) and by the BMBF (01EW1711A and B) in the framework of ERA-NET NEURON and the Forschungszentrums Medizintechnik Hamburg (fmthh; grant 01fmthh2017). The research leading to these results has received funding from the European Research Council under the European Union's Seventh Framework Programme (FP7/2007-2013) / ERC grant agreement n° 616905.References
1.-Li, Tie-Qiang, Bing Yao, Peter van Gelderen, Hellmut Merkle, Stephen Dodd, Lalith Talagala, Alan P. Koretsky, and Jeff Duyn. 2009. ‘Characterization of T2* Heterogeneity in Human Brain White Matter’. Magnetic Resonance in Medicine 62 (6): 1652–57.
2. Fritz, Francisco J., Luke J. Edwards, Tobias Streubel, Kerrin J. Pine, Nikolaus Weiskopf, and Siawoosh Mohammadi. 2020. ‘Simulating the Effect of Axonal Dispersion and Noise on Anisotropic R2* Relaxometry in White Matter’. In Proceedings of the 2020 ISMRM & SMRT Virtual Conference & Exhibition.
3. Wharton, Samuel, and Richard Bowtell. 2012. ‘Fiber Orientation-Dependent White Matter Contrast in Gradient Echo MRI’. Proceedings of the National Academy of Sciences 109 (45): 18559.
4.
Papazoglou, Sebastian, Tobias
Streubel, Mohammad Ashtarayeh, Kerrin J. Pine, Luke J. Edwards, Malte
Brammerloh, Evgeniya Kirilina, et al. 2019. ‘Biophysically Motivated Efficient
Estimation of the Spatially Isotropic Component from a Single Gradient-Recalled
Echo Measurement’. Magnetic Resonance in Medicine 82 (5): 1804–11.
5. Wharton, Samuel, and Richard Bowtell. 2013. ‘Gradient Echo Based Fiber
Orientation Mapping Using R2* and Frequency Difference Measurements.’ NeuroImage 83.
6. Sra, Suvrit, and Dmitrii Karp. 2013. ‘The Multivariate Watson Distribution: Maximum-Likelihood Estimation and Other Aspects’. Journal of Multivariate Analysis 114: 256–69.
7. Gudbjartsson, H., and S. Patz. 1995. ‘The Rician Distribution of Noisy MRI Data’. Magnetic Resonance in Medicine 34 (6): 910–14.
8. Zhang, H., T. Schneider, C. A. Wheeler-Kingshott, and D. C. Alexander. 2012. ‘NODDI: Practical in Vivo Neurite Orientation Dispersion and Density Imaging of the Human Brain’. Neuroimage 61 (4): 1000–1016.
9. Dhital, Bibek, Elias Kellner, Valerij G. Kiselev, and Marco Reisert.
2018. ‘The Absence of Restricted Water Pool in Brain White Matter.’ NeuroImage
182 (November): 398–406.
Figures