3317
Inter-vendor 3T R2* mapping evaluation on a standardized R2* phantom with and without a human subject1Department of Radiology, Mayo Clinic Arizona, Phoenix, AZ, United States
Synopsis
Quantitative MRI can precisely measure biomarkers for disease, such as liver hemochromatosis. R2* correlates with liver iron concentration (LIC), but data is scarce for 3T R2* mapping. The out-of-the box vendor provided sequences for quantitative R2* measurements do not precisely measure large R2* values in a standardized phantom. The discrepancy is greater at higher R2* values. This can lead to underestimates in LIC quantification for patients with severe hemochromatosis. R2* mapping from different MRI vendors may yield different results, and patient specific QA may be necessary for clinical utilization for quantitative R2* mapping.
Introduction
Iron overload has primarily been diagnosed by liver biopsy in past clinical practice1. In recent years, MRI has increasingly been utilized to quantify and map biomarkers for disease, including FDA-approved commercial products that can provide LIC measurements with MRI2. One such biomarker is the relaxation rate R2*; mapping R2* in the liver can detect high liver iron concentration (LIC) without the need for an invasive biopsy. Many of the previous studies on LIC quantification using R2* mapping were performed at 1.5T, with threshold values for disease being extrapolated to higher field strengths by simply scaling the values by a constant. R2* mapping sequences are now available clinically on 3T scanners. We seek to characterize the accuracy of these sequences at 3T using a standardized R2* phantom. In addition, a strategy for calibrating individual patient exams is explored by scanning the phantom and a human volunteer simultaneously.Methods
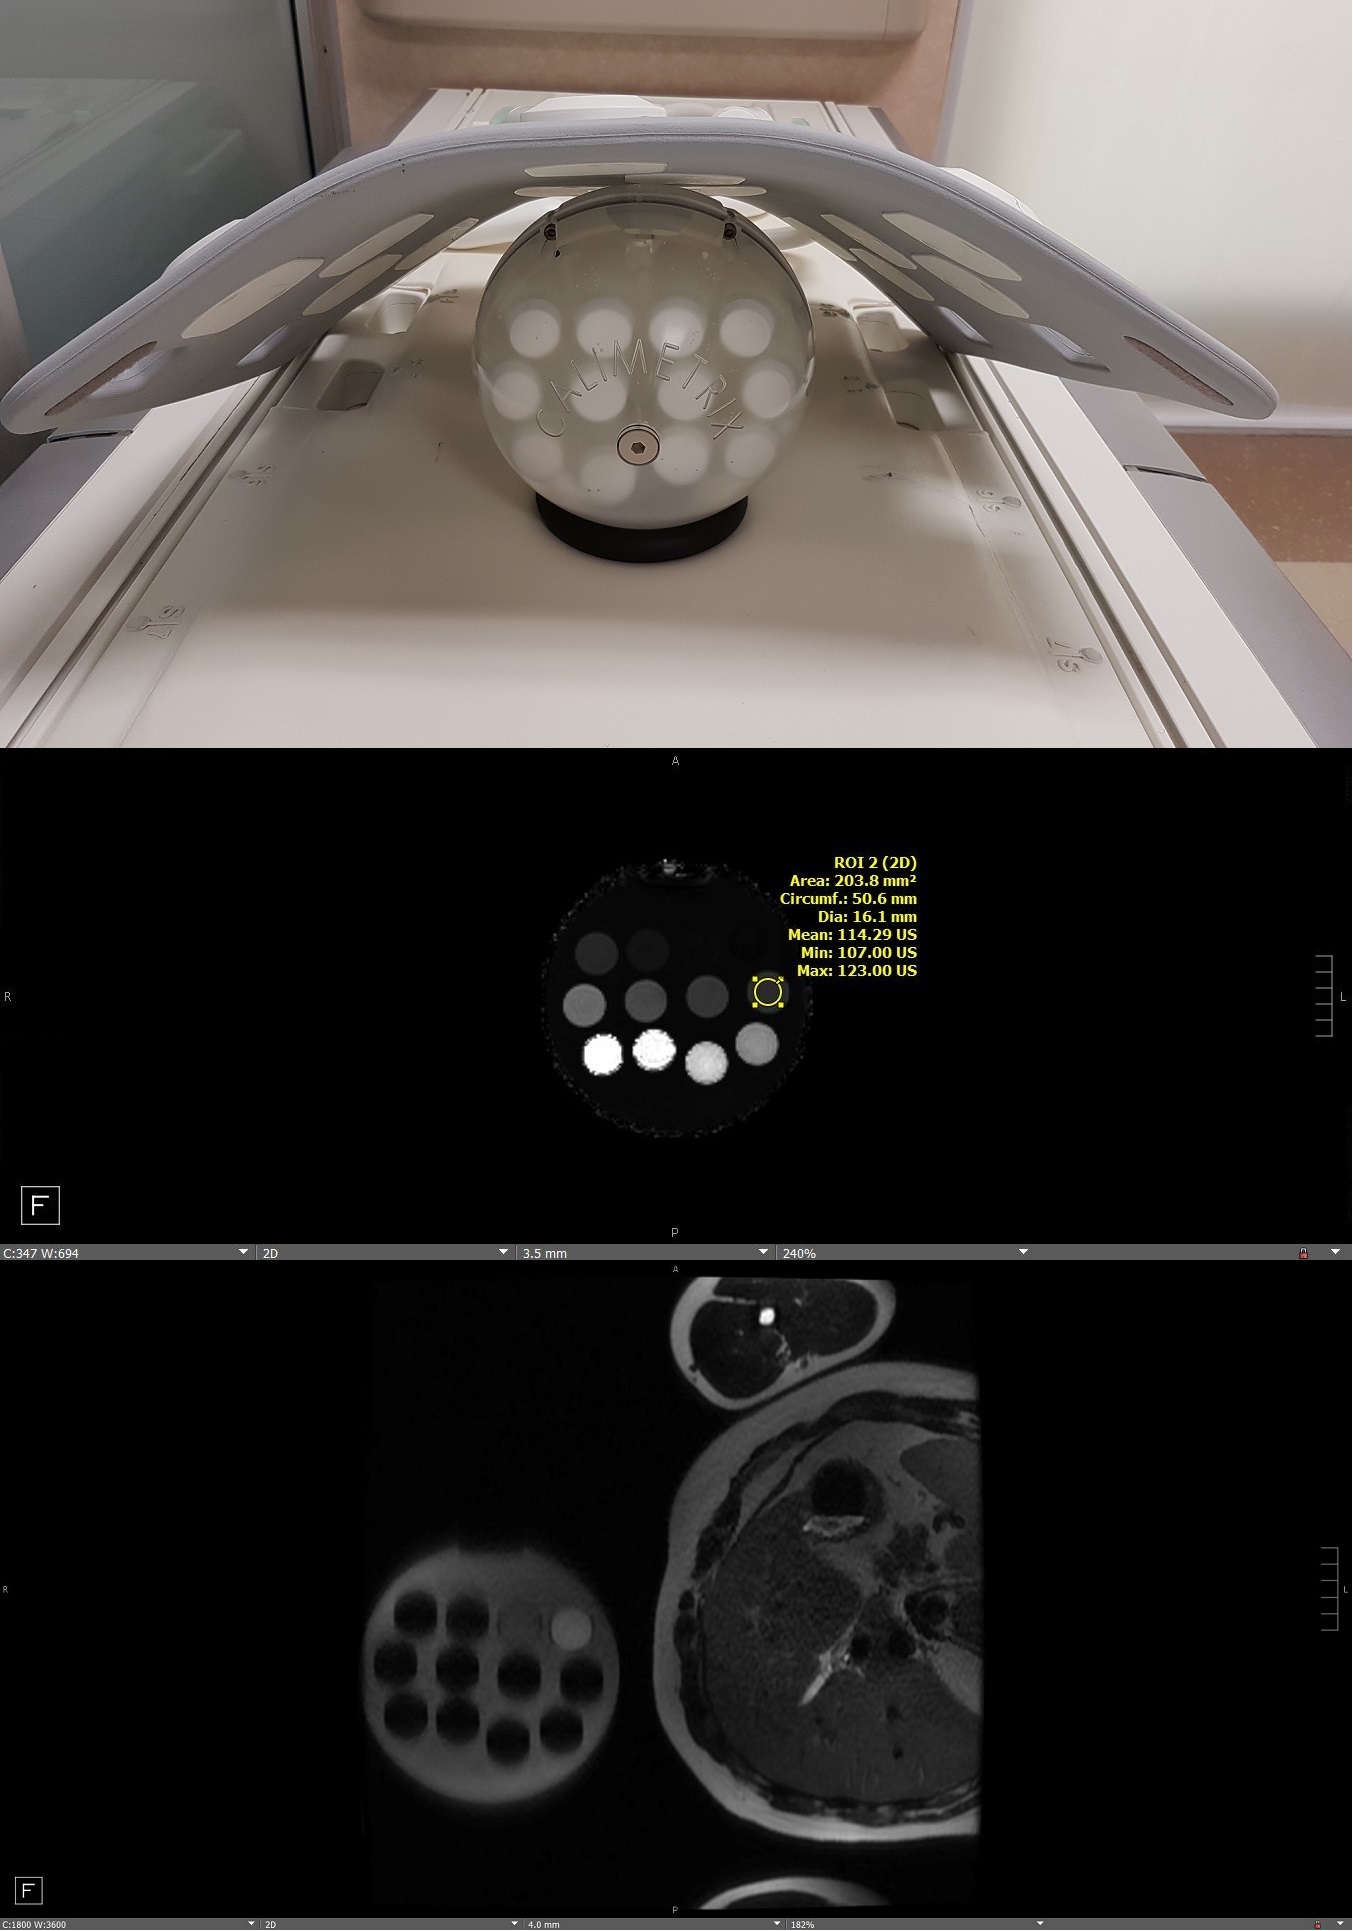
A Calimetrix (Madison, WI, USA) R2* phantom was scanned using two 3T MRI scanners from two vendors (referred as ‘vendor A’ and ‘vendor B’) with the whole-body transmit and multi-channel body receive coil. Out-of-box multi-echo DIXON sequences were used for data acquisition. The phantom manufacturer reported R2* values ranging from 16.6 to 991.4 s-1 using 12 vial inserts. The phantom was scanned three times; once with the phantom alone in the scanner, and once with a volunteer on the table at the same time, with two different volunteers. The volunteers were in the right lateral recumbent position, with the phantom placed anterior to the volunteer’s chest, at the same level as the liver. When scanning, the phantom vials and the volunteer right liver lobe were in the same field of view. The Vendor A mapping sequence had TR 9.23ms, TE at 0.9, 1.55, 2.2, 2.85, 3.5, 4.15, 4.8, 5.45, 6.1ms, slice thickness 3.5mm, FA of 4 deg. The Vendor B mapping sequence had TR 9.26ms, TE at 1.26, 2.60, 3.94, 5.28, 6.62, 7.96ms, slice thickness 3.5mm, FA of 4 deg. All slices were acquired axially, and the scans for each vendor were performed back to back. 16mm diameter ROIs were drawn in Visage PACS and the means recorded.Results
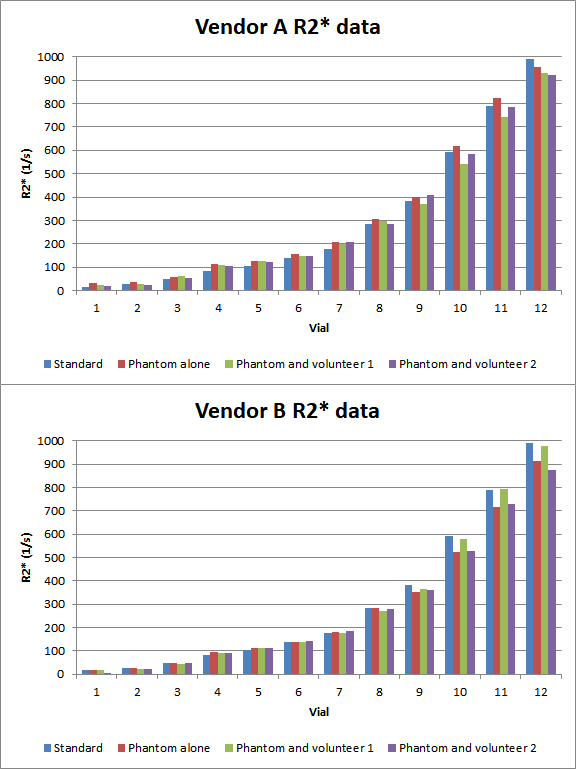
R2* values are summarized in Figure 2. R2* mapping from vendor A and vendor B do not perform identically when measuring the phantom alone, or the phantom with a volunteer present. The data obtained from volunteer 1 are different from that of volunteer 2. In the 12 measured vials, higher discrepancies between the measured value and the phantom manufacturer reported values are found in the high R2* range vials (vials 10-12) than the low R2* vials.Discussion
The data shows that vendor A and B had mildly variable performance for measuring R2*. Vendor A slightly overestimates R2* for vials 1-11, and Vendor B slightly underestimates R2* for vials 9-12 as compared to scanning the phantom alone (red bar in Figure 2). This suggests that imaging centers need to characterize the R2* mapping performance of their equipment on a scanner by scanner basis. Furthermore, both vendors’ data shows more inaccuracy for vials in the high range of R2* values (~400 s-1 and up)3. Thus, additional optimization is required for the pulse sequences and/or post processing algorithms for scanning patients with suspected higher iron concentration.Introducing a human body to the phantom scan seems to generate some variation in the final measured R2* values. For vendor A, the measured values of the phantom plus the volunteer are slightly lower than the R2* values measured with the phantom alone. For vendor B, the results are more variable, with the measurements being higher with volunteer 1, and the measurements being roughly the same for volunteer 2. This suggests that in order to correlate R2* measurements with liver iron concentration, patient specific calibration may yield better results than a universal calibration curve for that scanner.
Scanning the phantom alongside the patient’s liver is a potential method for patient specific calibration, but this setup may not be well tolerated for some patients, and it deviates from the norm of supine positioning for abdominal scans. Additional scans with more volunteers may elucidate the effects of scanning the phantom alongside a person.
Conclusion
This preliminary study shows that currently existing 3T R2* mapping sequences perform well for low to moderate R2* ranges but is less accurate at high R2* ranges corresponding to severe liver iron concentration. Further refinement to these sequences and their post processing algorithms may improve their accuracy in this region. The variation in measured R2* values using different scanning positions also warrants further investigation, in order to create workflows that maximize mapping accuracy while also preserving patient comfort and keeping exam setup simple.Acknowledgements
No acknowledgement found.References
1. Hernando D, Levin YS, Sirlin CB, Reeder SB. Quantification of liver iron with MRI: State of the art and remaining challenges. Journal of Magnetic Resonance Imaging. 2014;40(5):1003-1021. doi:10.1002/jmri.24584
2. Chan WC, Tejani Z, Budhani F, Massey C, Haider MA. R2* as a surrogate measure of ferriscan iron quantification in thalassemia. Journal of Magnetic Resonance Imaging. 2013;39(4):1007-1011. doi:10.1002/jmri.24216
3. Labranche R, Gilbert G, Cerny M, et al. Liver Iron Quantification with MR Imaging: A Primer for Radiologists. RadioGraphics. 2018;38(2):392-412. doi:10.1148/rg.2018170079
Figures