3316
Simultaneous Fat- and B1-Corrected T1 Mapping Using Chemical-Shift Encoded MRI1Radiology, University of Wisconsin - Madison, Madison, WI, United States, 2Electrical and Computer Engineering, University of Wisconsin - Madison, Madison, WI, United States, 3Medical Physics, University of Wisconsin - Madison, Madison, WI, United States, 4Biomedical Engineering, University of Wisconsin - Madison, Madison, WI, United States, 5Medicine, University of Wisconsin - Madison, Madison, WI, United States, 6Emergency Medicine, University of Wisconsin - Madison, Madison, WI, United States
Synopsis
Tissue fat and spatially varying B1 inhomogeneities are known confounders of quantitative T1W(ater) mapping methods that use variable flip angle techniques. T1W measurements can be corrected for B1 heterogeneity, but this typically requires an additional B1 calibration acquisition both extending patient acquisition time and introducing image registration considerations. In this work we propose simultaneous estimation of B1, T1W, proton density fat-fraction and R2* using a three-pass approach using dual orthogonal RF pulses and multiple flip angles. The feasibility and noise performance of this proposed acquisition and fitting strategy are evaluated using Cramer-Rao Lower Bound analysis, simulations, and phantom experiments.
Introduction
T1 is emerging as a quantitative biomarker of tissue fibrosis. Fibrosis, the most important prognostic histological feature of diffuse liver disease, can progress to cirrhosis and increases the risk of hepatocellular cancer1–3. T1 mapping using variable flip angle (VFA) spoiled gradient echo (SGRE) acquisitions is commonly used in the body where short acquisition times and motion robustness are important4,5. However, VFA methods are confounded by the presence of tissue fat and B1 inhomogeneities6. The effects of fat can be addressed through fat-water separated chemical shift encoded MRI (CSE-MRI) techniques7,8; however, standard B1-correction requires a separate calibration acquisition to measure B1 inhomogeneities9.Therefore, the purpose of this work is to present a simultaneous fat- and B1- corrected CSE-MRI T1 mapping method. Our approach combines a phase-based B1 mapping method10 with a traditional VFA strategy5 to jointly estimate T1, PDFF, B1, and R2* without the need for a separate B1 mapping acquisition.
Theory
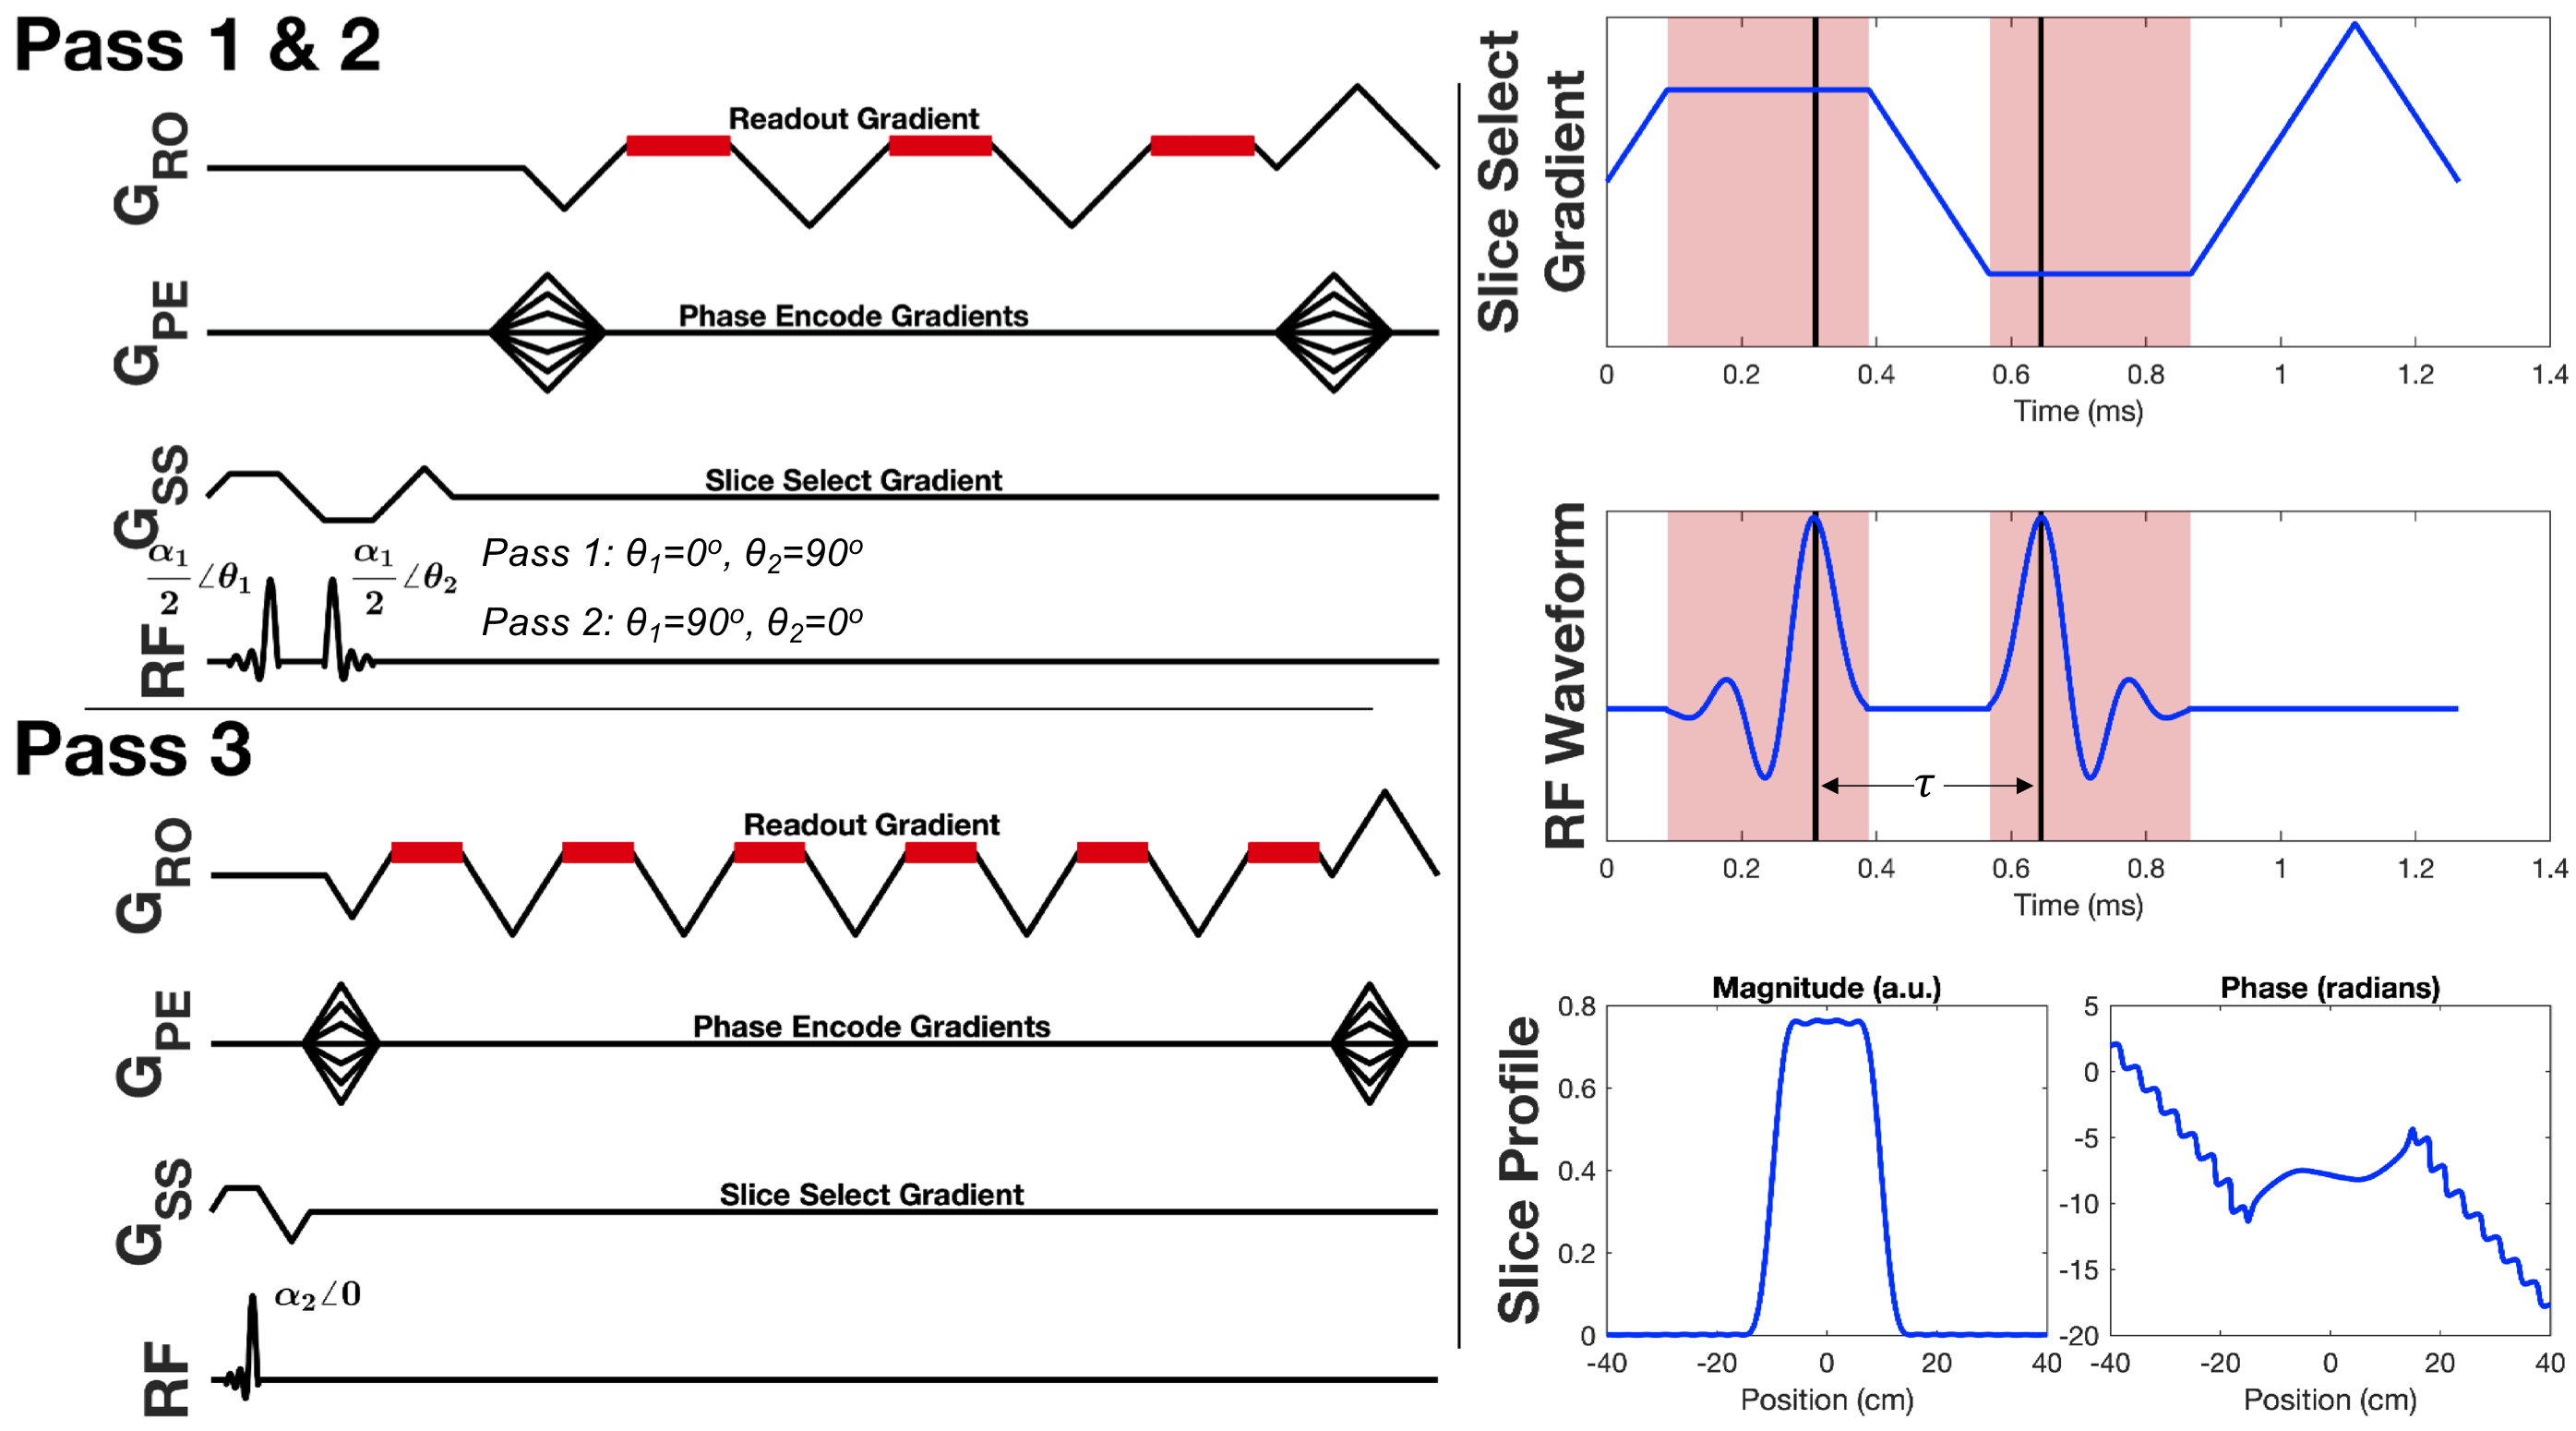
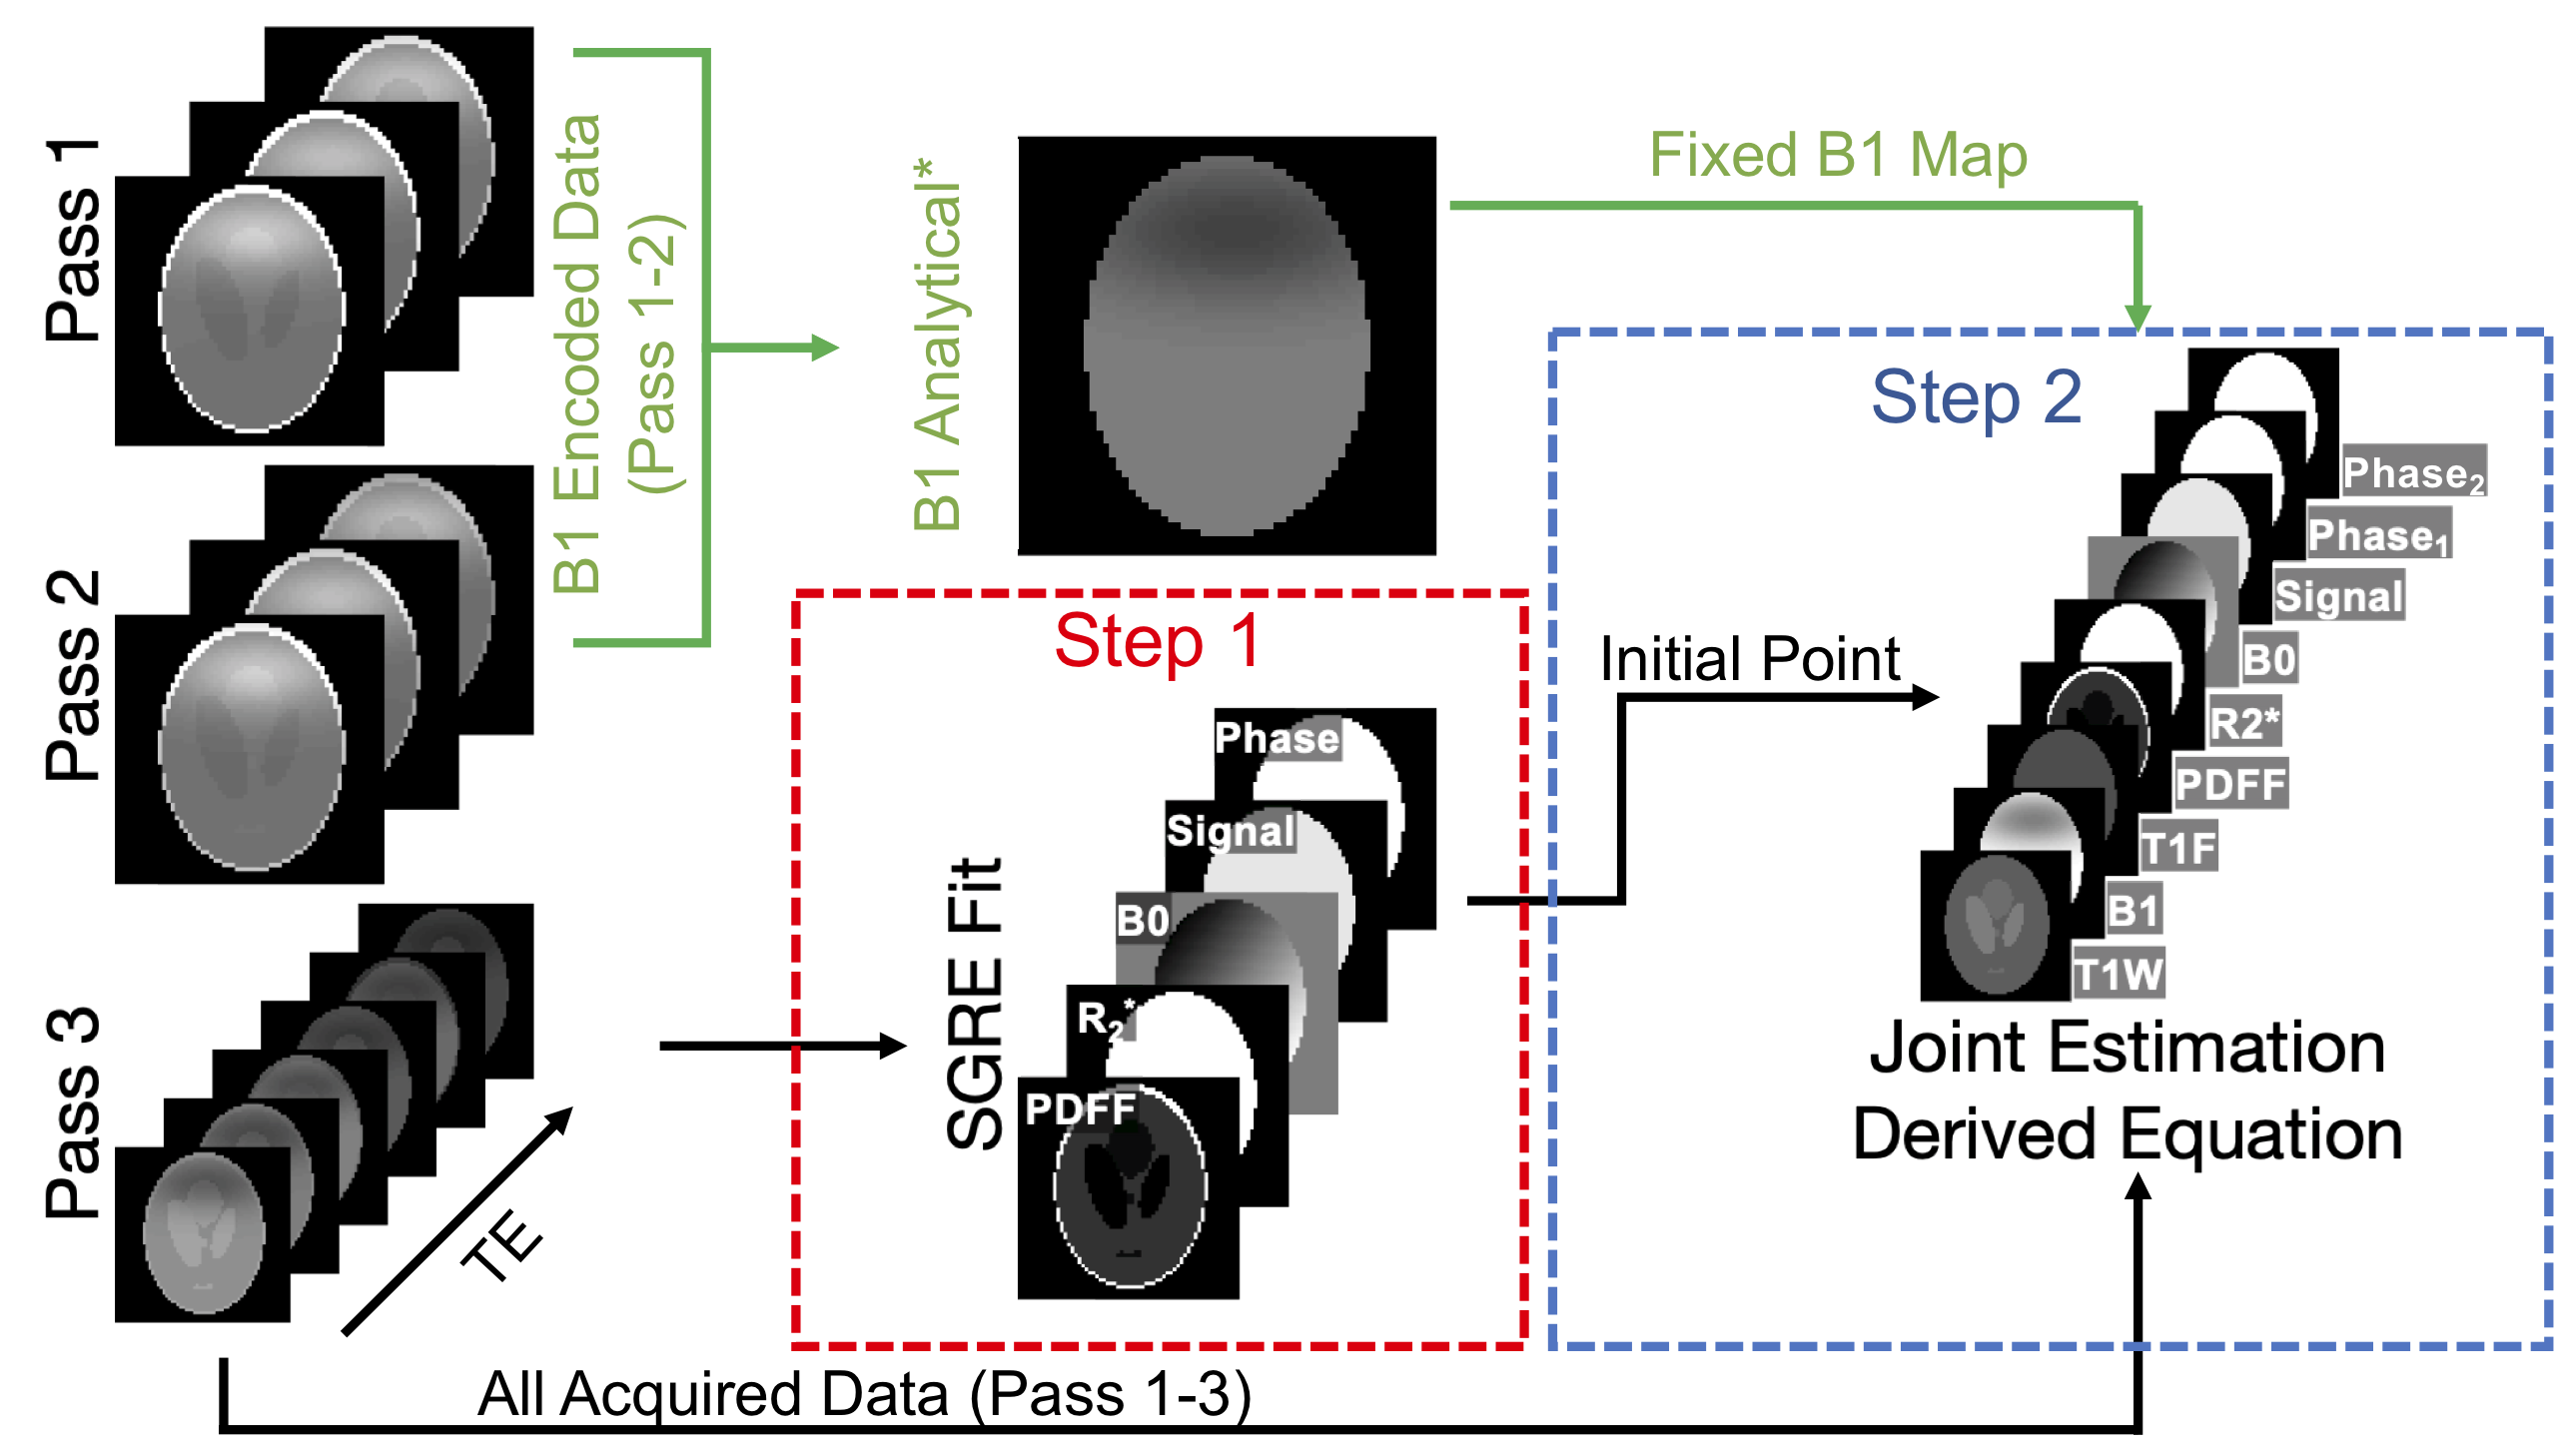
The orthogonal-$$$\alpha$$$ B1 mapping method10 uses two non-selective RF pulses of equal magnitude, but orthogonal phase, to encode the actual flip angle into the phase of the free induction decay signal. This strategy exploits the non-commutative relationship of rotations about orthogonal axes, and uses two passes to remove background phase, and thus estimate local B1.We propose the design of slab selective pulses that maintain a short inter-RF separation (𝜏) using bipolar slice select gradients and a time-reversed RF waveform to form a composite excitation of two orthogonal RF pulses used in two passes (Figure 1). A third pass, a typical multi-echo SGRE acquisition, completes the B1, VFA, and CSE-MRI strategy. Using the derived signal model of this acquisition strategy (computed using the MATLAB symbolic toolbox) and a 6-peak spectral model of fat11,12, B1, T1W(ater), T1F(at), PDFF, and R2* are estimated using a multi-step fitting strategy as described in Figure 2.
Methods
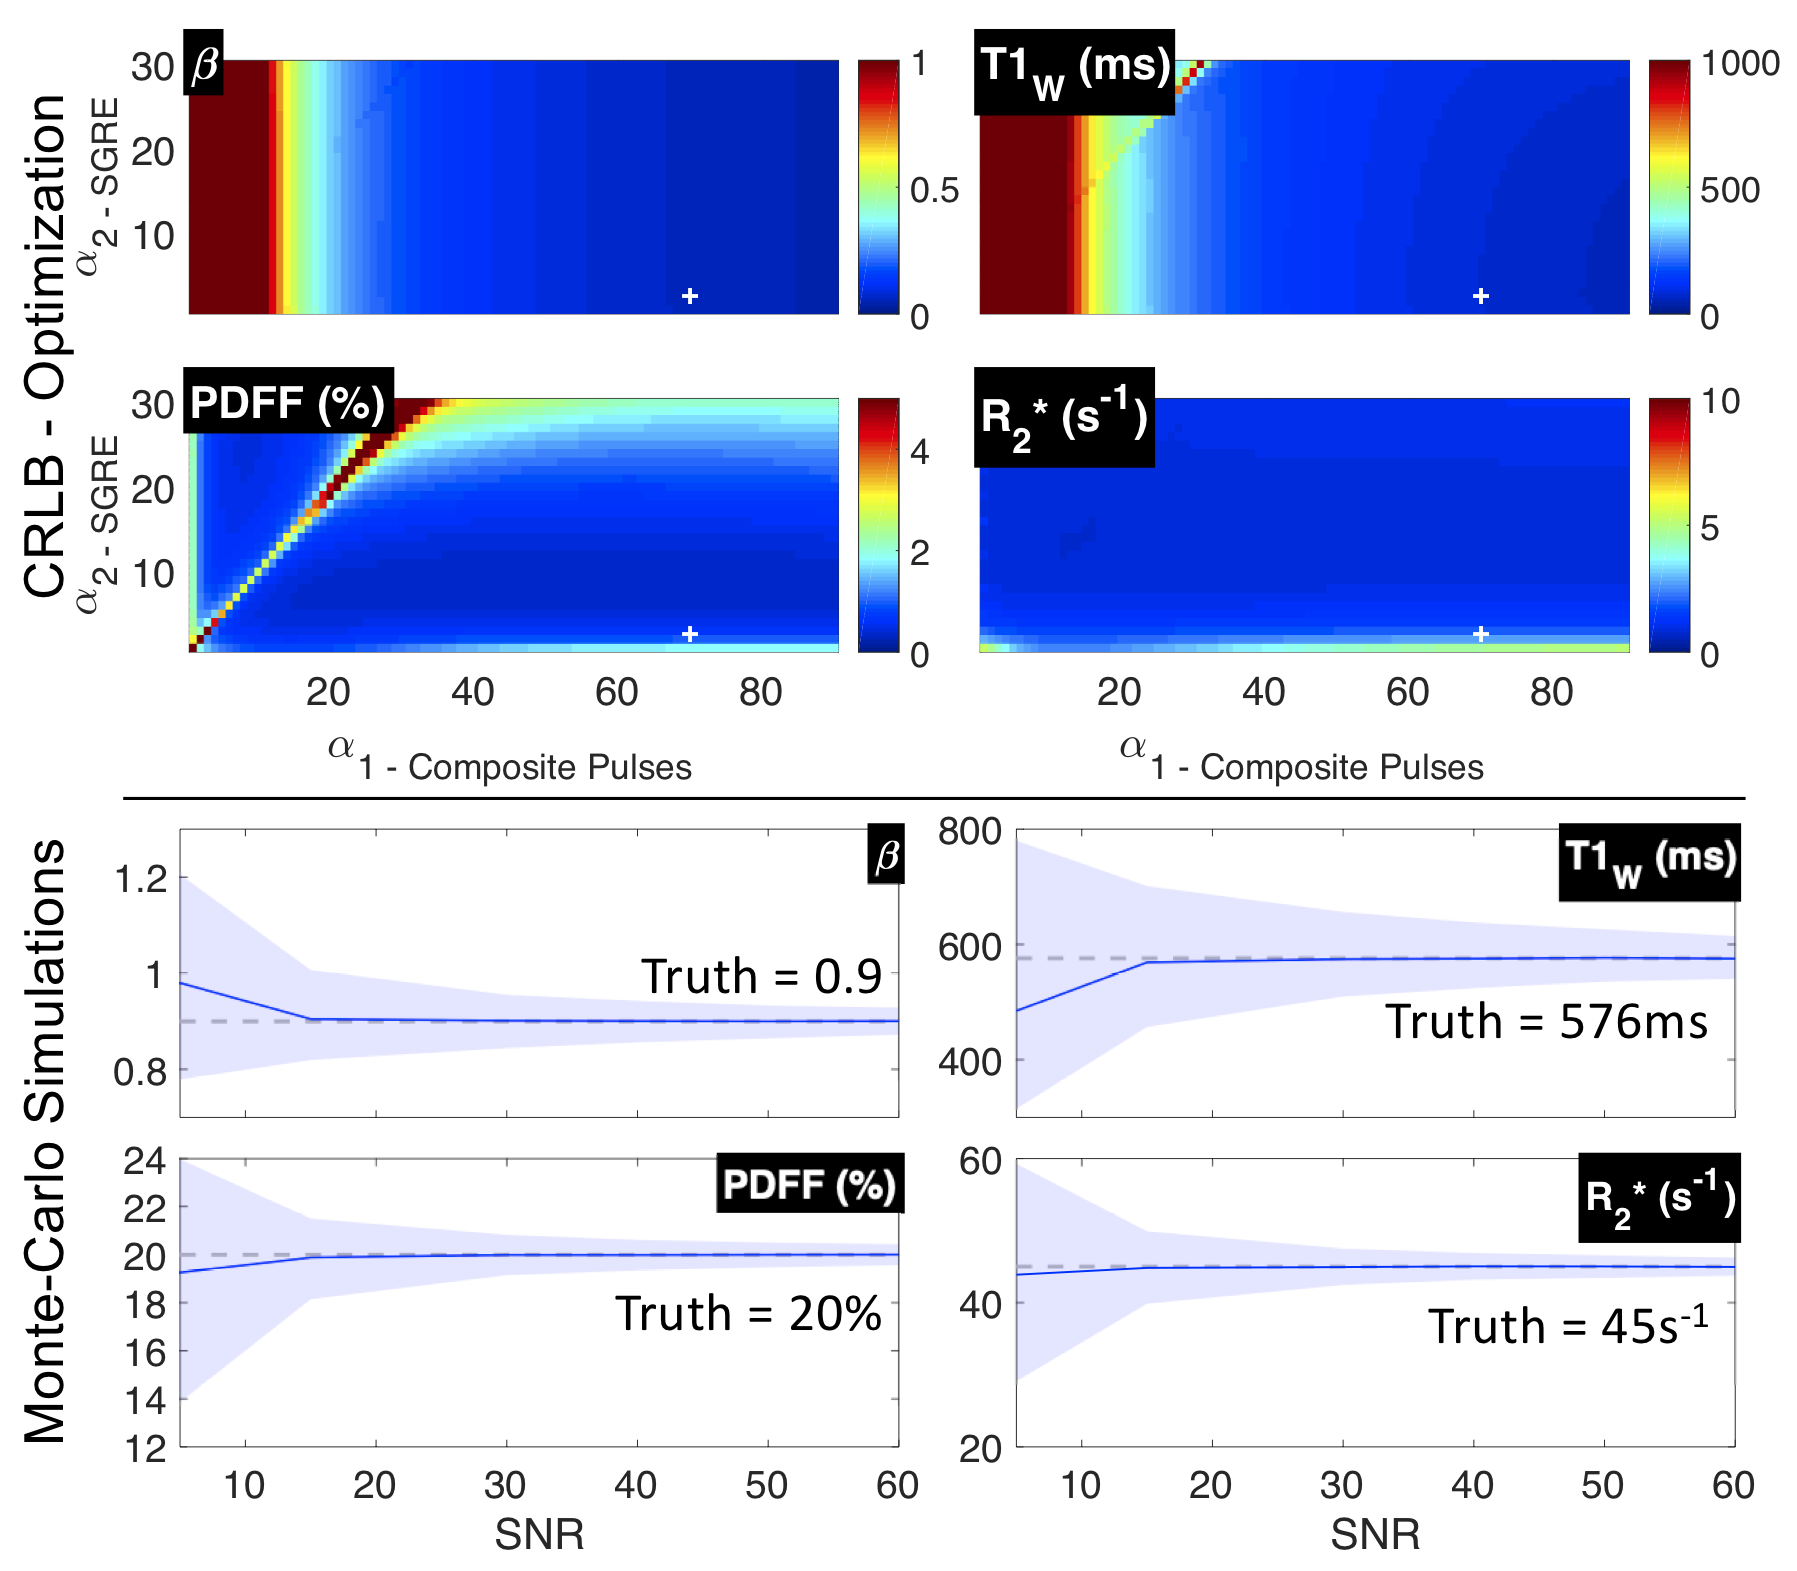
Optimization of Acquisition ParametersA Cramer-Rao Lower Bound (CRLB)13 was calculated for the acquisition strategy described above and used to determine acquisition parameters (constrained to realizable TRs, TEs, and flip angles) that would minimize the standard deviation of estimated T1W.
Numerical Simulations
The proposed method was simulated with common 1.5T liver tissue parameters14,15: T1W=576ms, T1F=300ms, PDFF=20%, R2*=45s-1 and acquisition parameters: α1=70o/α2=3o, TR1=9.5ms/TR2=15.8ms, 𝜏=368µs, TE1=1.98ms, ΔTE=2.23ms, echo train length (ETL)1=3, ETL2=6. B0 inhomogeneity was chosen to be 10Hz and a relative B1 inhomogeneity (β) was chosen to be 0.90.
For SNR ranging from 5-50 (SNR defined as: |SPass3,TE1|/σ, where σ=standard deviation of the noise), 10000 realizations were simulated with added zero-mean complex Gaussian noise. Nonlinear least-squares was used to estimate the unknown parameters, including β (B1), T1W, PDFF, and R2*.
Phantom Acquisitions
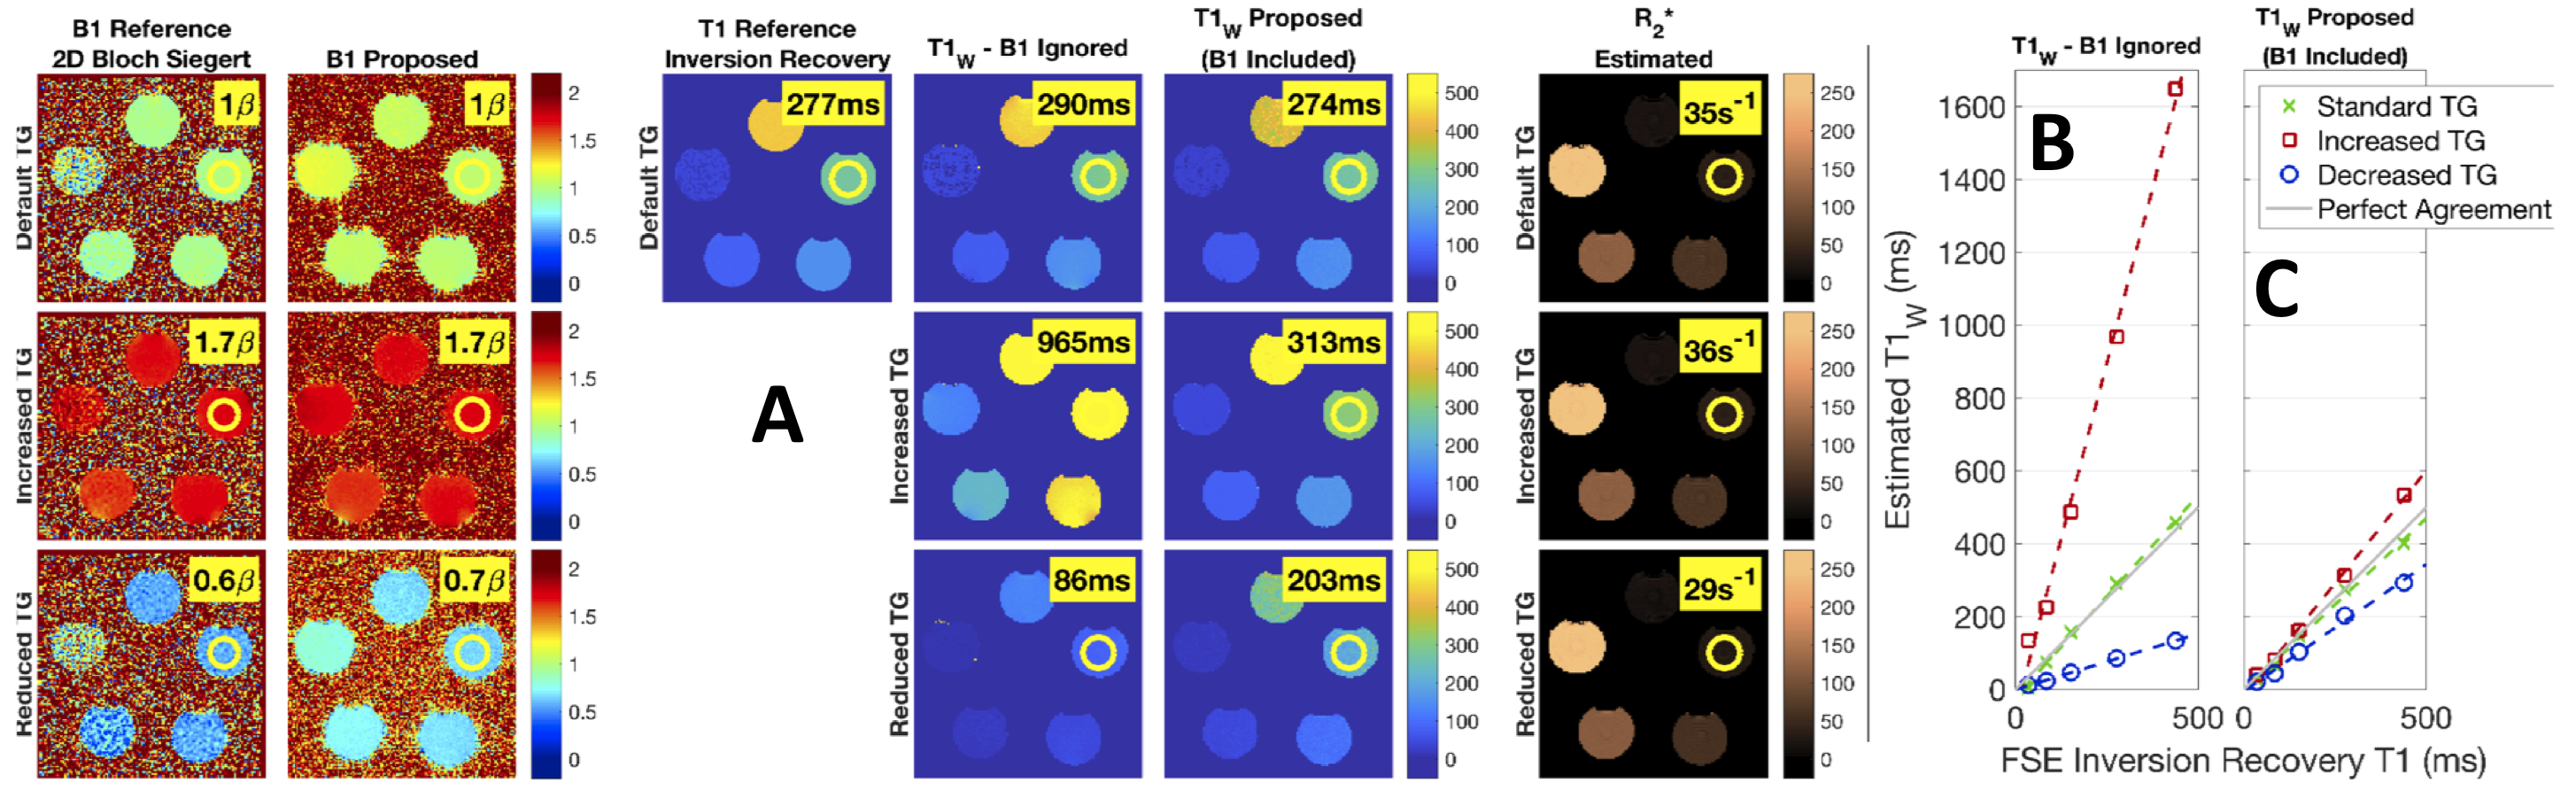
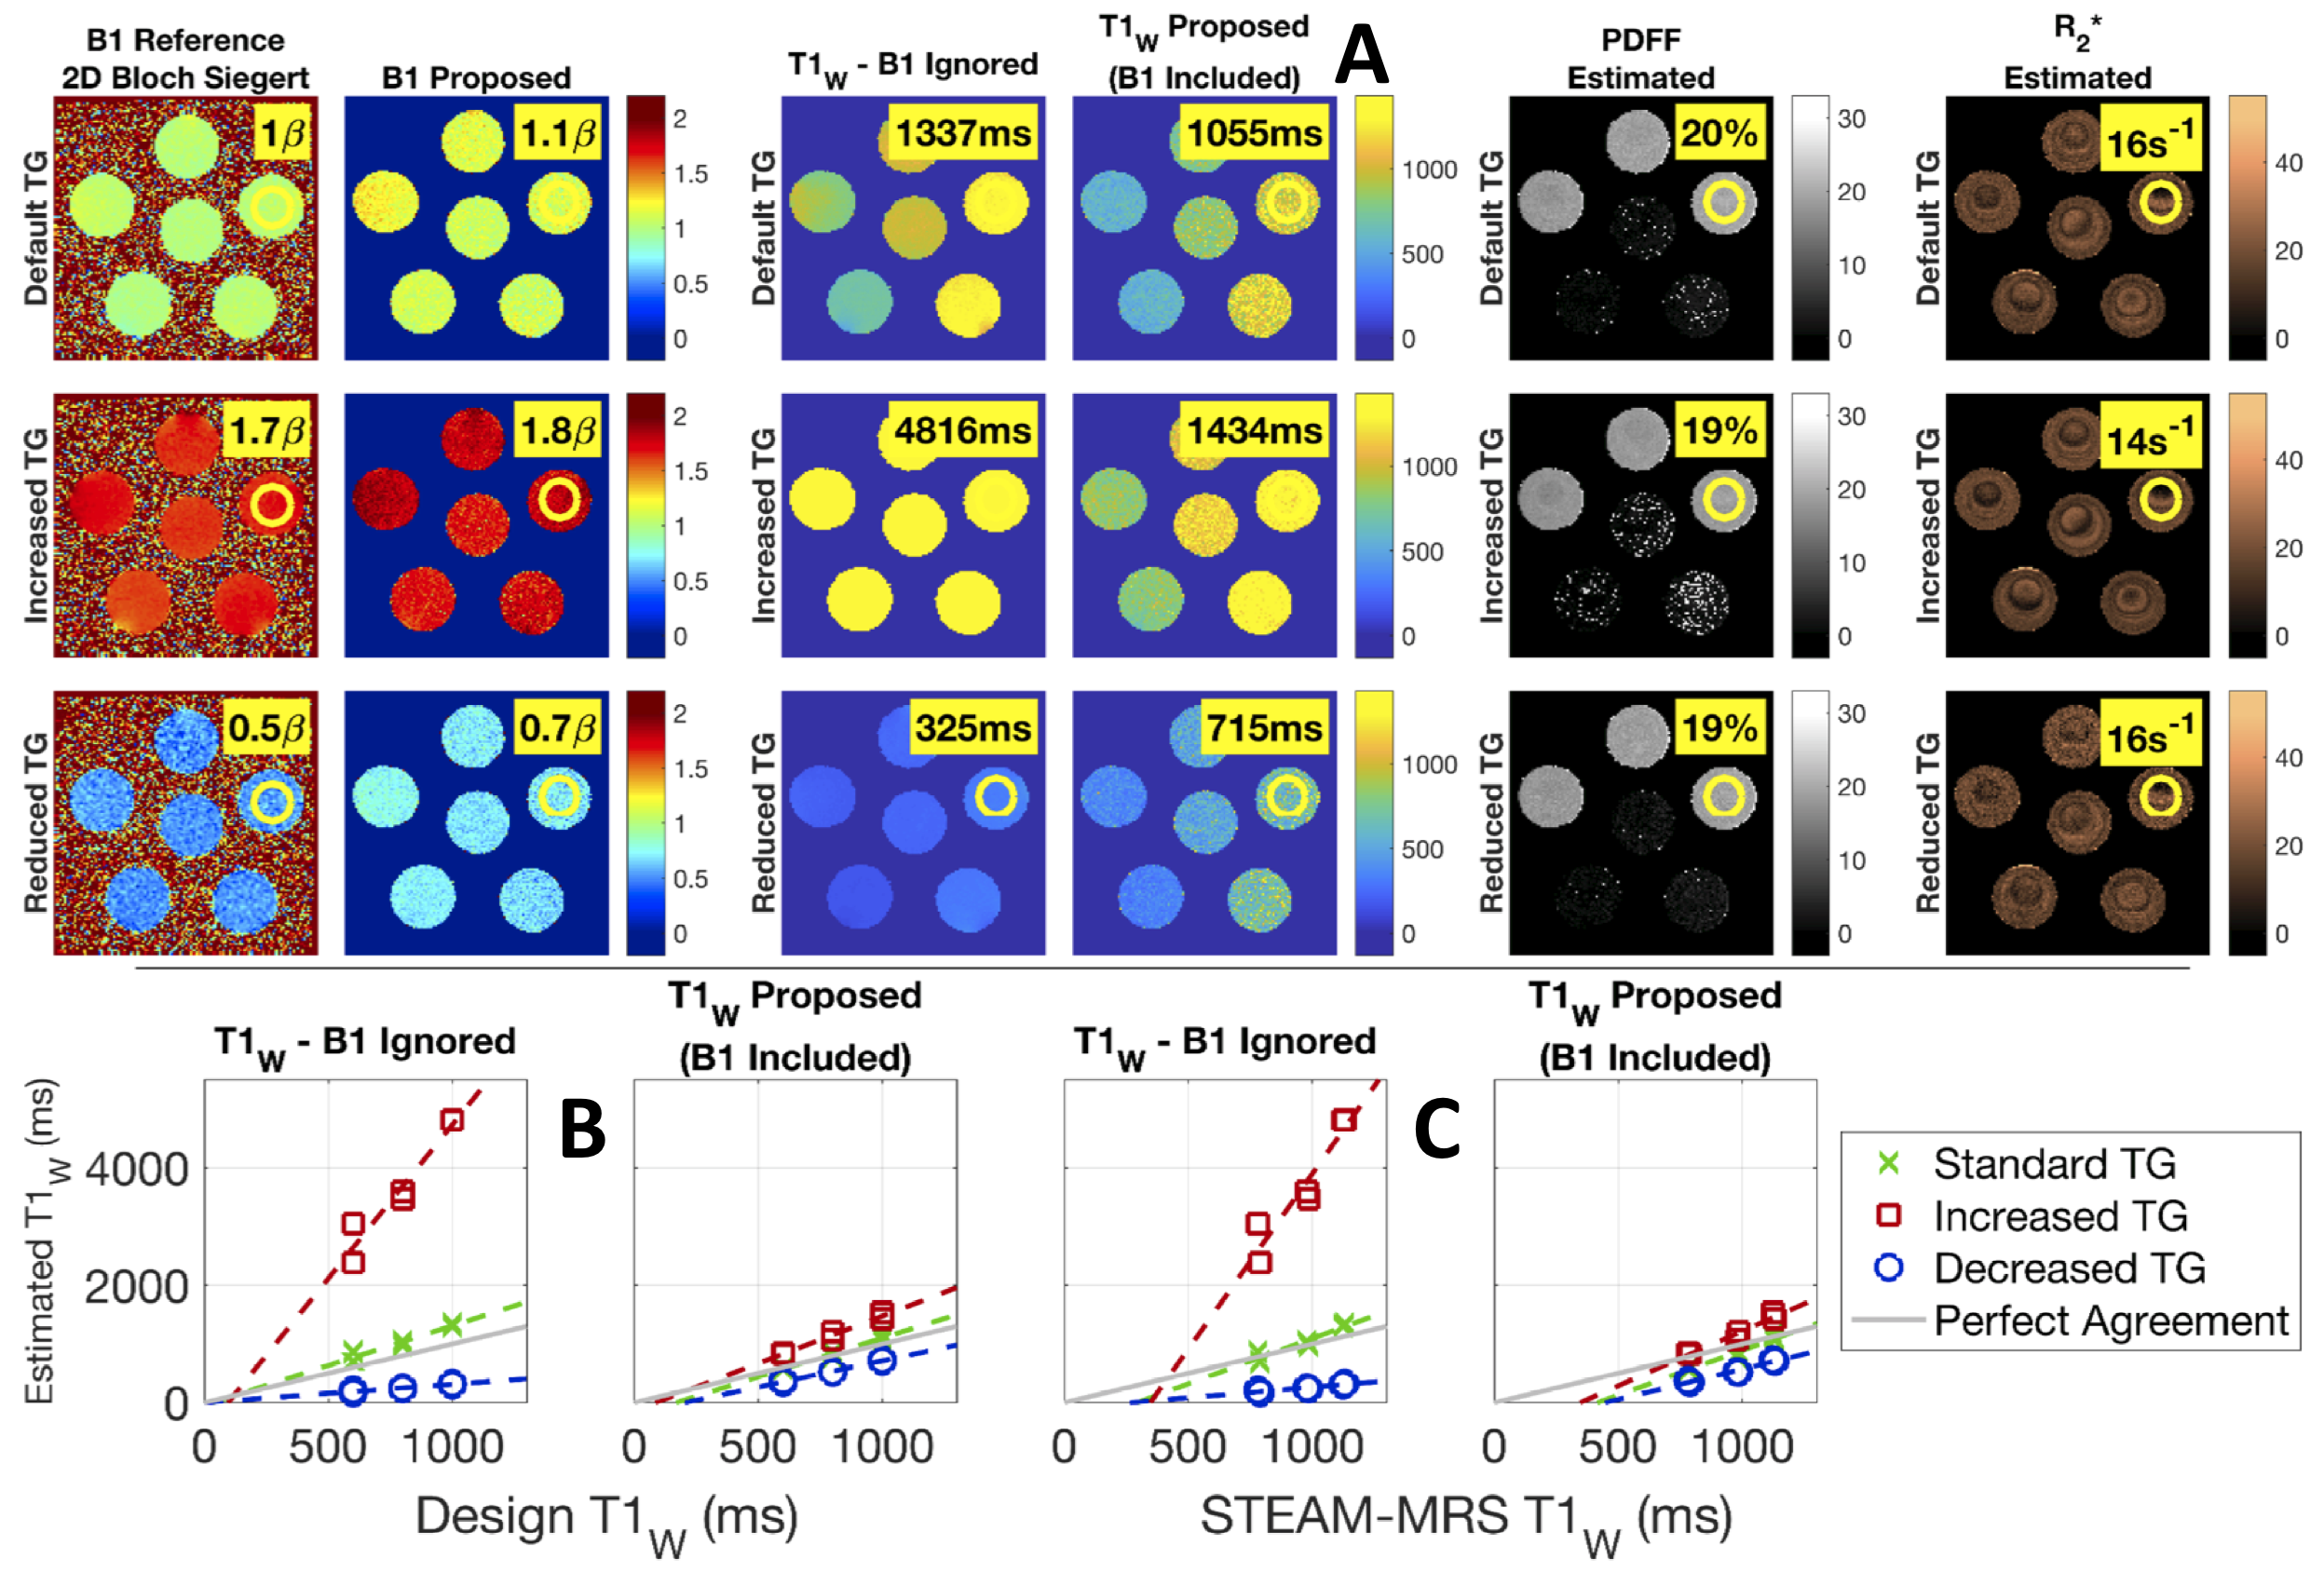
The proposed method was tested in a multi-vial water phantom of varying T1W (40-450ms) and R2* (20-230s-1) modulated with MnCl2, and in a multi-vial agar gel (20mg agar / g water) phantom of varying T1W (600, 800, 1000ms) and PDFF (0%, 20%) modulated with NiCl2 and peanut oil, respectively. Each spherical vial was approximately 150mL. Imaging was performed with a single channel quadrature head coil at 1.5T (GE Healthcare Optima MR450W, Waukesha, WI) using the acquisition parameters listed in the numerical simulations and with the following: 3D acquisition with 24 slices, 5mm slice thickness, 28x28cm2 FOV, ±62.50kHz bandwidth, and a 128x128 matrix. Transmit gain (TG) was both increased and decreased to replicate global B1 errors with an acquired 2D Bloch-Siegert B1 map used as a reference16.
Multiple fast spin echo inversion recovery (FSE-IR) (GE Healthcare) images were acquired over a range of inversion times and fit as a T1 reference in the water phantom. Multi-TE-TR spectroscopy (STEAM)17 was used as the reference for T1W in the agar gel phantom.
Parameters were estimated using the strategy described in Figure 2 and without prior knowledge of adjustments made to TG. A region of interest (ROI) analysis compared the proposed method to T1 references in each vial.
Results
Optimization of Acquisition ParametersCRLB analysis determined T1W estimation becomes less variable as α1 increases. Plots showing the CRLB optimization space are shown in Figure 3.
Numerical Simulations
Monte-Carlo simulations demonstrated the proposed strategy converges to unbiased estimators for all parameters of interest (Figure 3).
Phantom Acquisitions
T1W estimates in both water (Figure 4) and fat/agar gel (Figure 5) phantom experiments showed good agreement with reference T1 measurements, with some remaining bias.
Discussion
This work describes the development of a fat- and B1-corrected VFA and CSE-MRI-based T1 mapping method. Theoretical analysis was used to determine optimal acquisition parameters and performance was confirmed in numerical simulations and phantom acquisitions.While phantom experiments demonstrated the proposed method’s ability to correct for fat and B1, some bias was still observed in T1W estimates. We suspect this bias to be partially explained by a non-optimal inter-RF separation (𝜏) and flip angle (α1) pairing, coupled with imperfect RF spoiling. Ongoing development is aimed at addressing this bias and adapting this strategy for in vivo body imaging.
Conclusion
The proposed strategy demonstrates feasibility for a rapid, breath hold eligible, B1- and fat-corrected T1-mapping technique without the need for a separate B1 calibration acquisition.Acknowledgements
We wish to acknowledge support from the NIH (R01 DK088925, UL1TR002373), UW Department of Radiology, UW Institute for Clinical and Translational Research, and the Clinical and Translational Science Award of the NCATS/NIH. Further, we wish to acknowledge GE Healthcare who provides research support to the University of Wisconsin. Finally, Dr. Reeder is a Romnes Faculty Fellow, and has received an award provided by the University of Wisconsin-Madison Office of the Vice Chancellor for Research and Graduate Education with funding from the Wisconsin Alumni Research Foundation.References
1. Michelotti GA, Machado MV, Diehl AM. NAFLD, NASH and liver cancer. Nat. Rev. Gastroenterol. Hepatol. 2013;10:656–665 doi: 10.1038/nrgastro.2013.183.
2. Angulo P, Keach JC, Batts KP, Lindor KD. Independent predictors of liver fibrosis in patients with nonalcoholic steatohepatitis. Hepatology 1999;30:1356–62 doi: 10.1002/hep.510300604.
3. Banerjee R, Pavlides M, Tunnicliffe EM, et al. Multiparametric magnetic resonance for the non-invasive diagnosis of liver disease. J Hepatol 2014;60:69–77 doi: 10.1016/j.jhep.2013.09.002.
4. Brookes JA, Redpath TW, Gilbert FJ, Murray AD, Staff RT. Accuracy of T1 measurement in dynamic contrast-enhanced breast MRI using two- and three-dimensional variable flip angle fast low-angle shot. J. Magn. Reson. Imaging 1999;9:163–171 doi: 10.1002/(SICI)1522-2586(199902)9:2<163::AID-JMRI3>3.0.CO;2-L.
5. Deoni SC, Rutt BK, Peters TM. Rapid combined T1 and T2 mapping using gradient recalled acquisition in the steady state. Magn Reson Med 2003;49:515–26 doi: 10.1002/mrm.10407.
6. Deoni SC. Correction of main and transmit magnetic field (B0 and B1) inhomogeneity effects in multicomponent-driven equilibrium single-pulse observation of T1 and T2. Magn Reson Med 2011;65:1021–35 doi: 10.1002/mrm.22685.
7. Liu CY, McKenzie CA, Yu H, Brittain JH, Reeder SB. Fat quantification with IDEAL gradient echo imaging: correction of bias from T(1) and noise. Magn Reson Med 2007;58:354–64 doi: 10.1002/mrm.21301.
8. Wang X, Hernando D, Wiens C, Reeder S. Fast T1 Correction for Fat Quantification Using a Dual-TR Chemical Shift Encoded MRI Acquisition. In: ; 2017.
9. Cheng H-LM, Wright GA. Rapid high-resolution T1 mapping by variable flip angles: Accurate and precise measurements in the presence of radiofrequency field inhomogeneity. Magn. Reson. Med. 2006;55:566–574 doi: 10.1002/mrm.20791.
10. Chang YV. Rapid B1 mapping using orthogonal, equal-amplitude radio-frequency pulses. Magn Reson Med 2012;67:718–723 doi: 10.1002/mrm.23051.
11. Hamilton G, Yokoo T, Bydder M, et al. In vivo characterization of the liver fat (1)H MR spectrum. NMR Biomed 2011;24:784–90 doi: 10.1002/nbm.1622.
12. Yu H, Shimakawa A, McKenzie CA, Brodsky E, Brittain JH, Reeder SB. Multiecho water-fat separation and simultaneous R2* estimation with multifrequency fat spectrum modeling. Magn Reson Med 2008;60:1122–34 doi: 10.1002/mrm.21737.
13. Scharf LL, Mcwhorter LT. Geometry of the Cramer-Rao Bound. Signal Process. 1993;31:301–311 doi: Doi 10.1016/0165-1684(93)90088-R.
14. Stanisz GJ, Odrobina EE, Pun J, et al. T1, T2 relaxation and magnetization transfer in tissue at 3T. Magn. Reson. Med. 2005;54:507–12 doi: 10.1002/mrm.20605.
15. Gold GE, Han E, Stainsby J, Wright G, Brittain J, Beaulieu C. Musculoskeletal MRI at 3.0 T: relaxation times and image contrast. AJR Am J Roentgenol 2004;183:343–51 doi: 10.2214/ajr.183.2.1830343.
16. Sacolick LI, Wiesinger F, Hancu I, Vogel MW. B1 mapping by Bloch-Siegert shift. Magn. Reson. Med. 2010;63:1315–1322 doi: 10.1002/mrm.22357.
17. Hamilton G, Middleton MS, Hooker JC, et al. In vivo breath-hold (1) H MRS simultaneous estimation of liver proton density fat fraction, and T1 and T2 of water and fat, with a multi-TR, multi-TE sequence. J Magn Reson Imaging 2015;42:1538–43 doi: 10.1002/jmri.24946.
Figures