3314
The feasibility of T1ρ magnetic resonance fingerprinting with a random design of T1ρ preparation at 11.7T1Institute of Science and Technology for Brain-Inspired Intelligence, Fudan University, Shanghai, China, 2Human Phenome Institute, Fudan University, Shanghai, China, Shanghai, China
Synopsis
In this study, we demonstrate that T1ρ-MRF can be achieved by varying flip angle, repetition time, echo time, as well as spin lock time—in a pseudorandom manner at 11.7T MR system.
Introduction
Magnetic resonance fingerprinting (MRF) has been shown to provide fast multiparametric quantitative imaging [1]. In recent studies, T1ρ relaxation is added to the MRF framework using spin lock preparations [2-4]. To improve the accuracy of quantification, T1ρ preparation and T2 preparation were designed separately in the MRF sequence in previous studies. At ultra-high magnetic fields, chemical exchange and proton diffusion in biological tissues are more prominent, T1ρ would be affected by the chemical exchange rate between free water and macromolecules. The current study aims to test the feasibility of T1ρ MRF with a random design of T1ρ preparation at ultra-high fields.Method
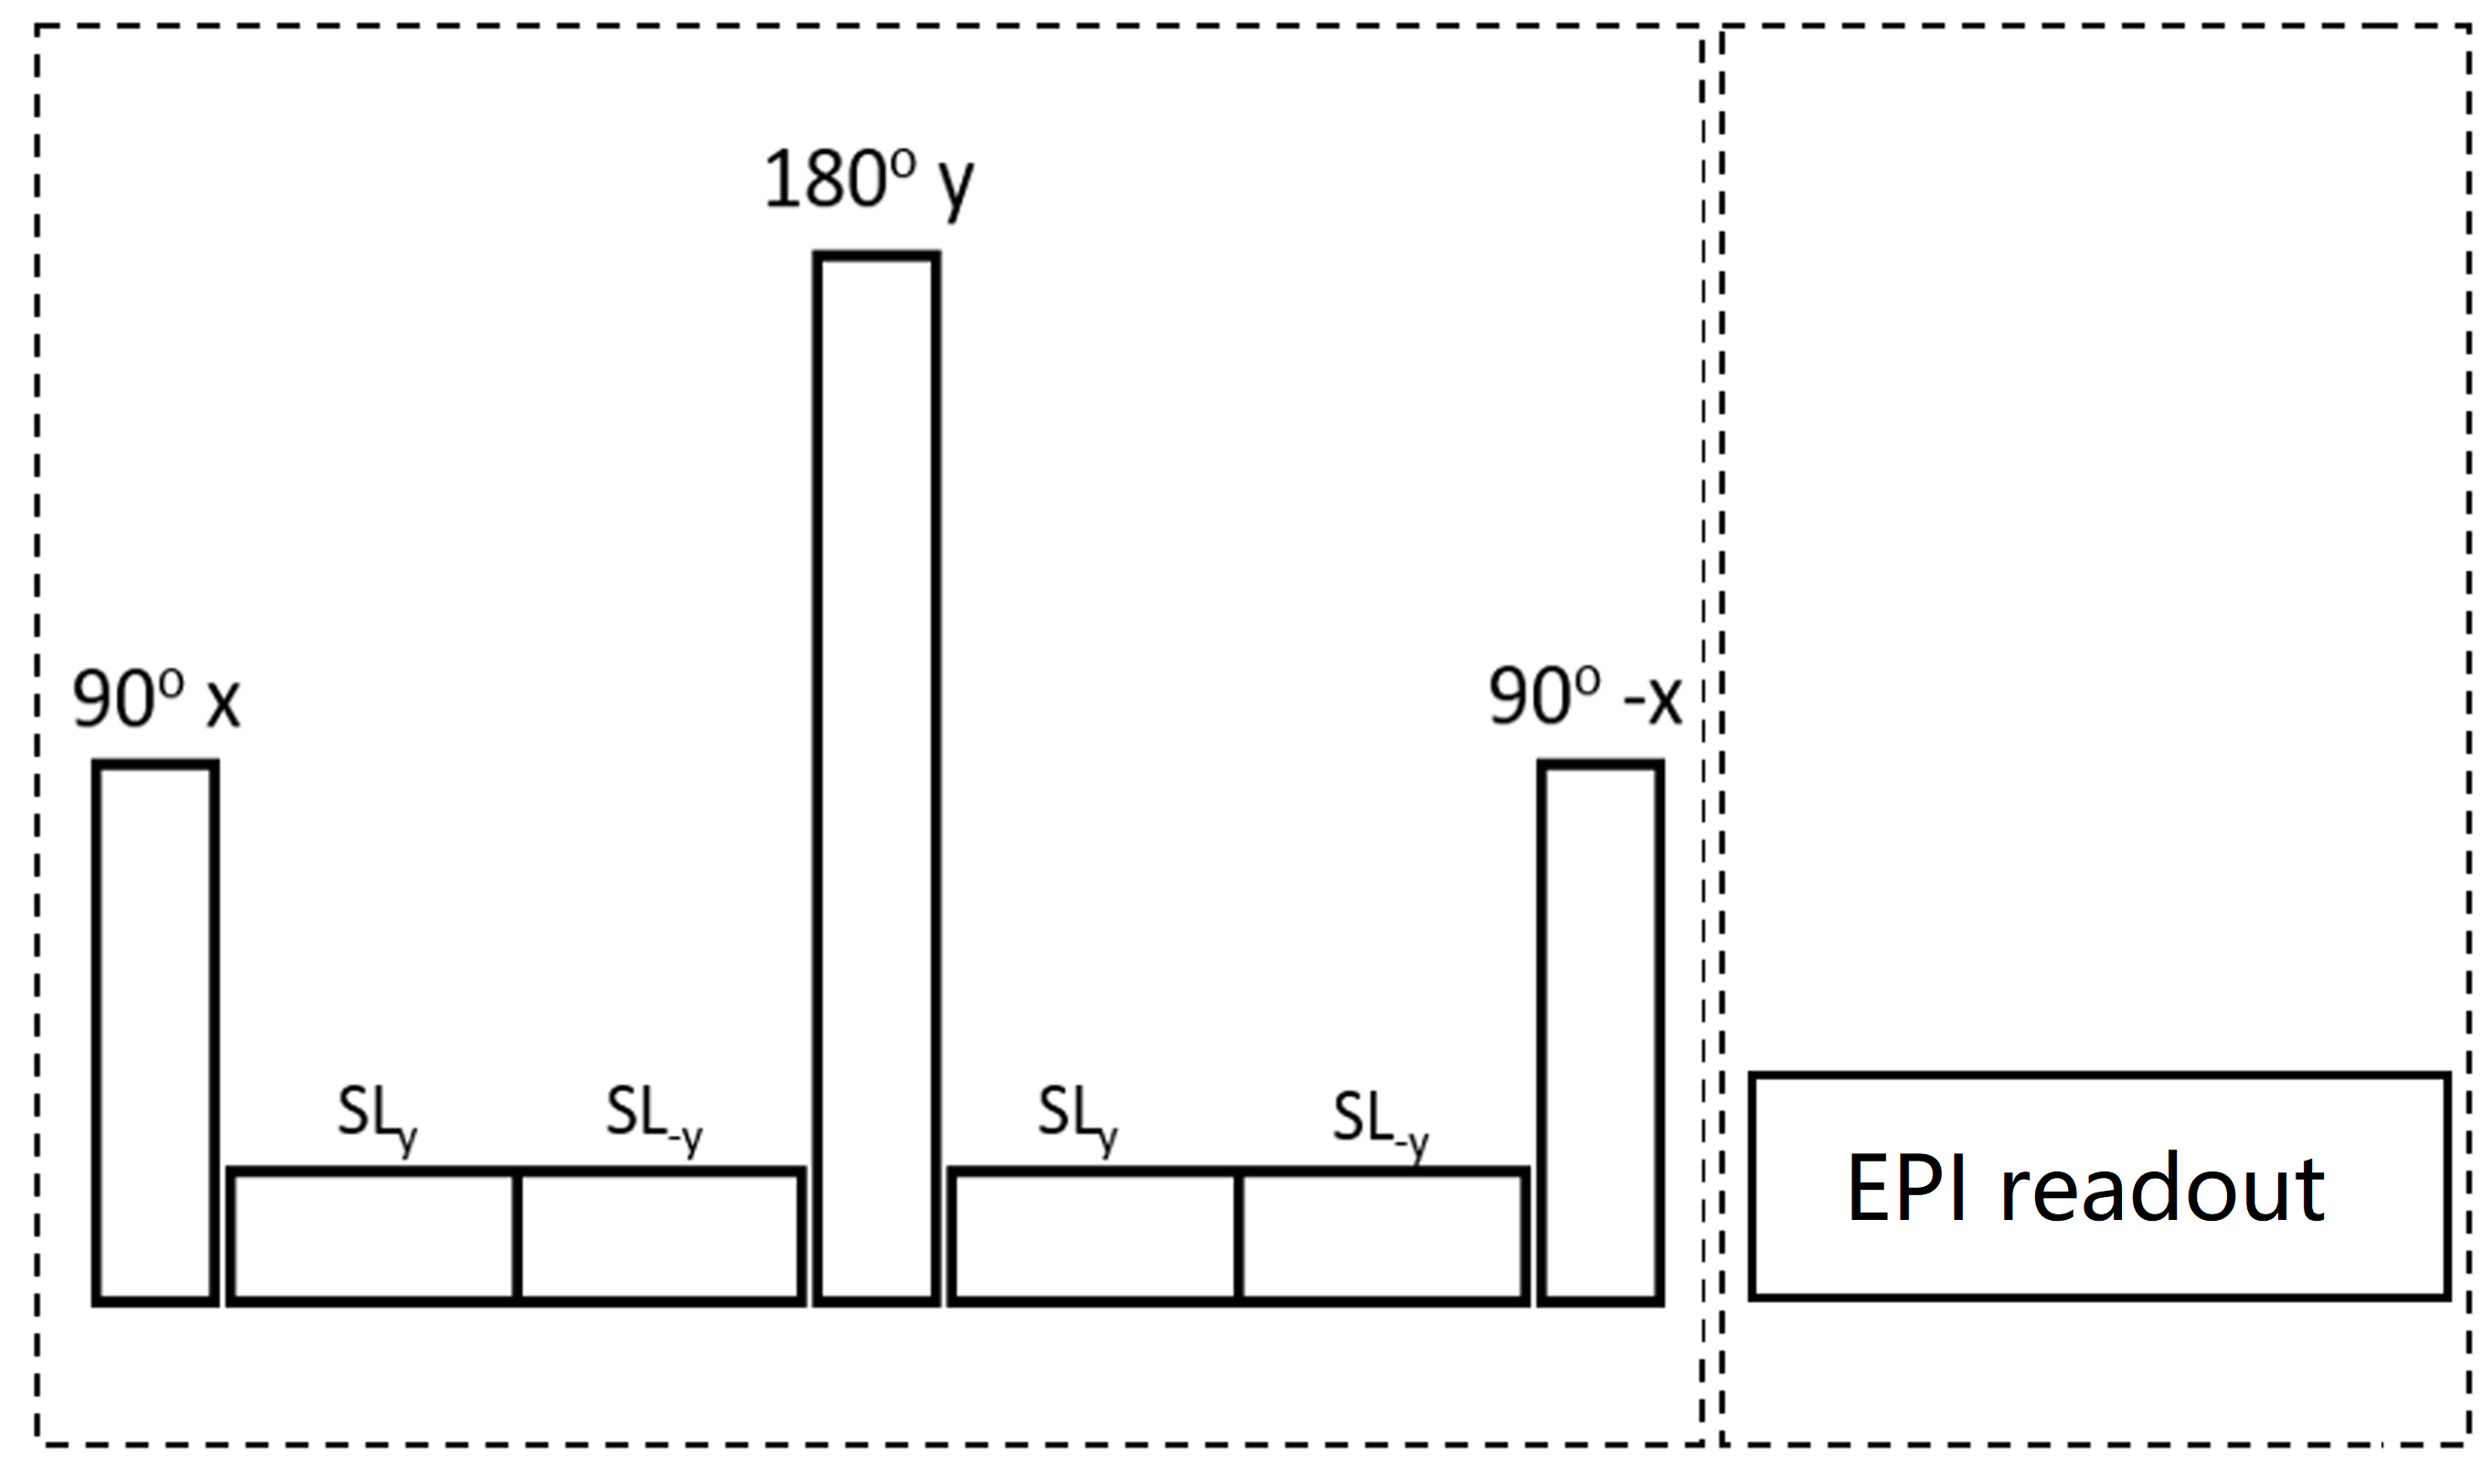
Seven phantoms with varying amount of Gadolinium contrast agent were prepared. The T1ρ MRF sequence with EPI readout was developed on Bruker 11.7T MR system (figure 1). A 4-channel Tx/Rx coil was used to receive signal. Pseudo-random designed MRF sequence, the signal intensities evolve according to the following equation:S(TR,TE,FA,TSL)=S(0 ) (1-e(-TR / T1 ))e(-TSL / T1ρ ) e(-TE / T2 ) sin(FA)
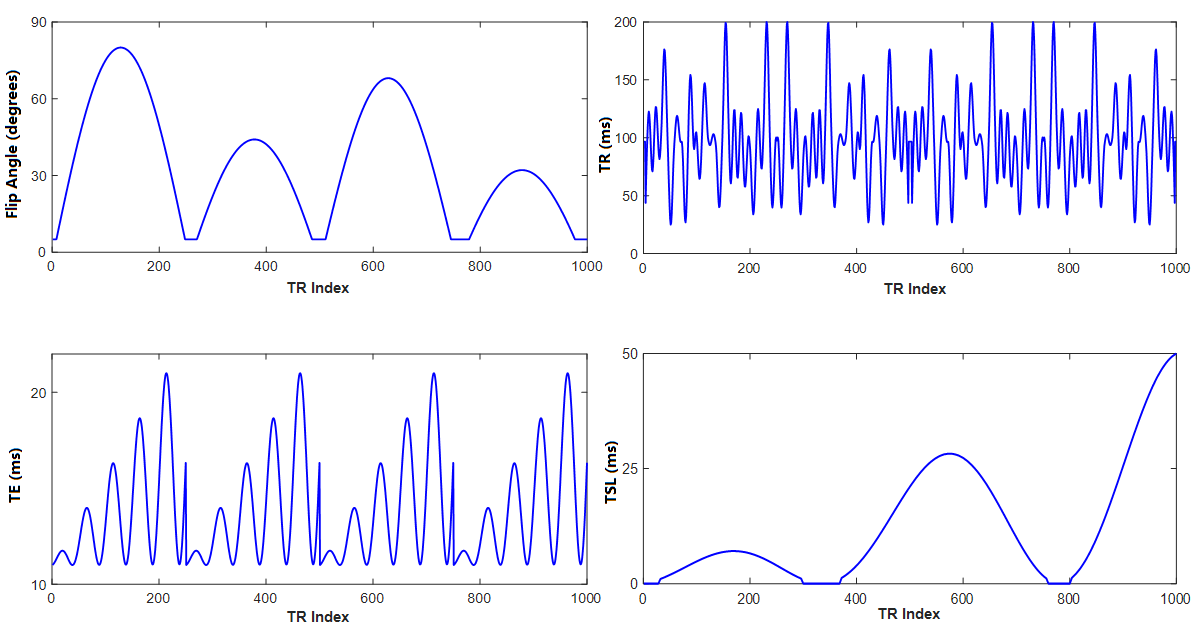
The phantoms were scanned with the proposed MRF sequence in figure 1 (1000 time points) and with conventional T1, T2, and T1ρ relaxation mapping sequences. The MRF sequence uses different TSL, FA, TR and TE for each excitation, where TSL ranges from 0 ms to 50 ms, FA ranges from 5 degrees to 80 degrees, TE ranges from 11 ms to 21 ms, and the repetition time was a Perlin noise pattern ranging from 25 ms to 200 ms (figure 2). FOV=20×20 mm2, acquisition matrix=96×57, slice thickness=5 mm, spin-lock frequency (FSL)=2000 Hz.
The saturation recovery (IR) sequence was used to measure the T1 map of 7 phantoms with 12 different TR values (153, 200, 400, 600, 800, 1000, 1500, 2000, 3000, 4000, 5000, 6000 ms). T2 was acquired using the Carr-Purcell-Meiboom-Gill (CPMG) sequence (TR/TE1=4000/6.5 ms, echo spacing 6.5 ms, 20 echoes). Spin-lock preparation with RARE readout was developed to quantify T1ρ [5]. For T1ρ sequence, TR/TE=5000/14 ms, rarefactor=4, 11 different spin lock times (TSL=1, 10, 20, 30, 40, 50, 60, 70, 80, 90, 100 ms), FSL=2000 Hz. All conventional images were acquired with FOV=20×20 mm2, matrix=128×128, slice thickness=5 mm.
The dictionary used in the matching algorithm was simulated using MATLAB (The MathWorks). A total of 222,656 signal time courses, each with 1,000 time points, with different sets of characteristic parameters (T1, T2, and T1ρ) were simulated for the dictionary. The dictionary entry with the highest dot product was selected as most likely to represent the true signal evolution. Conventional T1 and T2 maps were fit using the Bruker inline software (ParaVision 6.01), while conventional T1ρ map used mono-exponential two-parameter fits in MATLAB. The two-way mixed intraclass correlation coefficient (ICC) was calculated to determine the agreement between conventional T1/T2/T1ρ and MRF T1, T2, and T1ρ using SPSS Statistics software (20.0, Chicago, IL, USA).
Results and discussions
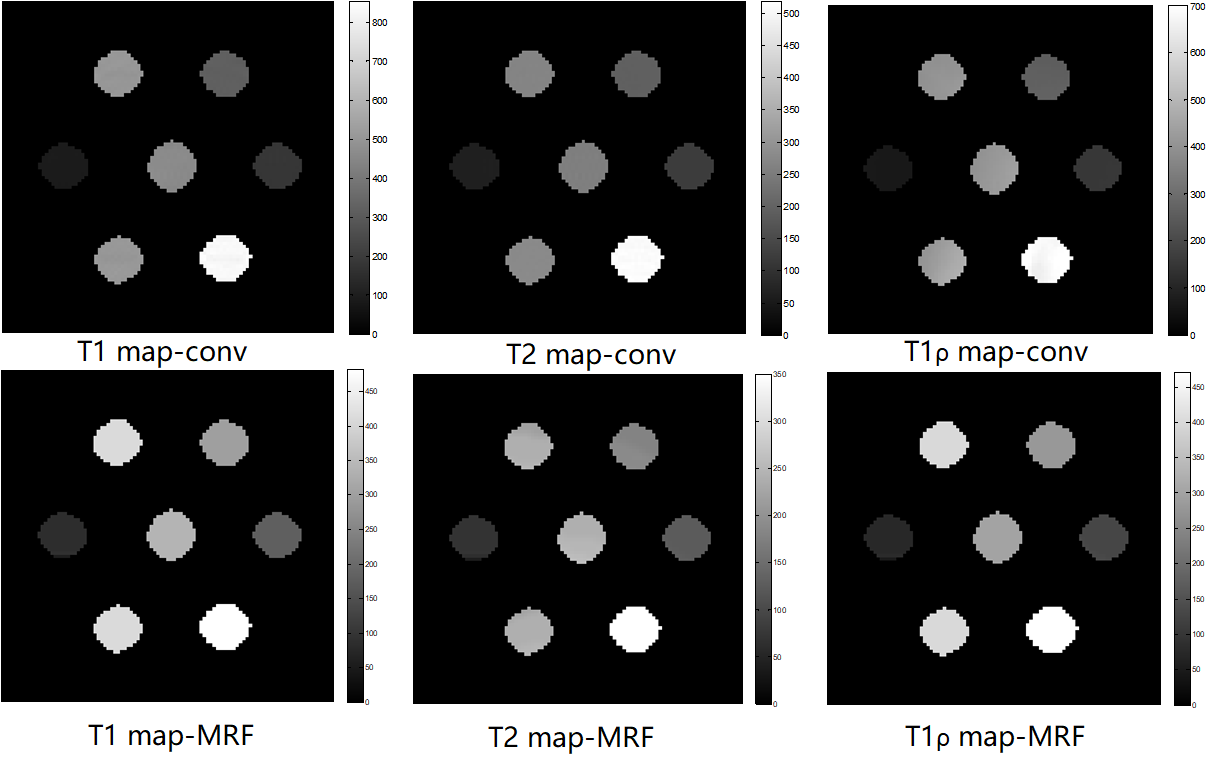
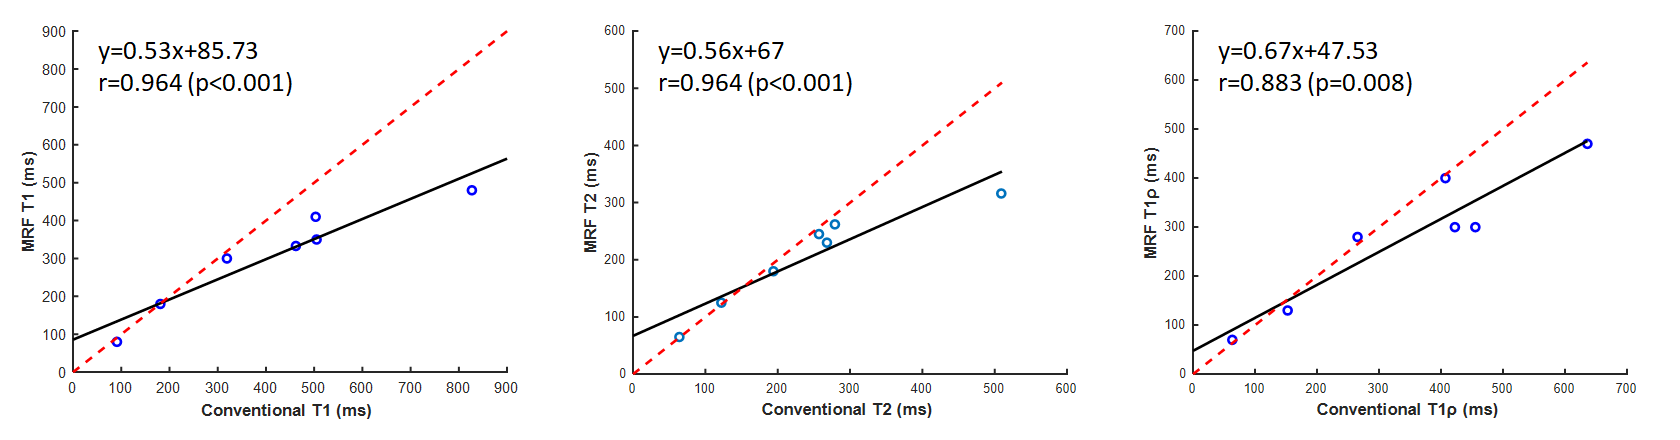
The T1, T2, and T1ρ relaxation maps for the conventional sequences acquired and MRF in phantoms are shown in figure 3. The ICC values between MRF and conventional sequences are 0.842, 0.834, and 0.919 for T1, T2, and T1ρ, respectively. Spearman’s correlation analysis (two-tailed) indicated that MRF measurements and conventional measurements showed excellent correlation with r=0.964, p<0.001, r=0.964, p<0.001, and r=0.883, p=0.008 for T1, T2, and T1ρ, respectively (figure 4).Conventional multiparametric mapping of T1, T2, and T1ρ is time-consuming and may be impractical in clinical settings [4]. In a recent study by Wyatt et al, T1ρ relaxation has been added as an additional quantitative parameter for MRF, making it able to provide several quantitative parameters within a single breath-hold in the abdomen [2]. Sharafi et al have applied the rapid T1ρ MRF sequence to the quantitative multiparametric mapping of the knee articular cartilage. The current study tried to examine the feasibility T1ρ MRF sequence with a random design of T1ρ preparation at ultra-high field MR system. The ICC values for all relaxation times were above 0.8, indicating a strong quantitative agreement between conventional and MRF sequences. Future research will focus on evaluation of the performance of the T1ρ MRF sequence in vivo at ultra-high field MRI.
Conclusions
In this study, strong correlations between conventional and MRF T1, T2, and T1ρ relaxation times were seen in phantoms at ultra-high field MRI. Compared to the traditional exponential fitting method, the T1ρ-MRF method can greatly shorten the scan time and is expected to have greater application value in T1ρ imaging.Acknowledgements
This work was supported by the National Natural Science Foundation of China (No. 81971583), Shanghai Municipal Science and Technology Major Project (No.2017SHZDZX01, No.2018SHZDZX01, VBH2306002).References
[1] Ma D, Gulani V, Seiberlich N, et al. Magnetic resonance fingerprinting. Nature 2013;495(7440):187-192.
[2] Wyatt CR, Barbara TM, Guimaraes AR. T1ρ magnetic resonance fingerprinting. NMR in Biomedicine 2020;33(4).
[3] Sharafi A, Zibetti MVW, Chang G, et al. MR fingerprinting for rapid simultaneous T1, T2, and T1ρ relaxation mapping of the human articular cartilage at 3T. Magnetic Resonance in Medicine 2020.
[4] Ma S, Wang N, Fan ZY et al. Three‐dimensional whole‐brain simultaneous T1, T2, and T1ρ quantification using MR Multitasking: Method and initial clinical experience in tissue characterization of multiple sclerosis. Magnetic Resonance in Medicine 2020.
[5] Wang YX, Zhang Q, Li X et al. T1ρ magnetic resonance: basic physics principles and applications in knee and intervertebral disc imaging. Quant Imaging Med Surg 2015; 5(6):858-885.
Figures