3313
Efficient Phase Cycling Strategy for High Resolution Three-Dimensional GRE Quantitative Mapping1Department of Radiology, Albert Einstein College of Medicine, Bronx, NY, United States, 2Department of Medical Physics, Memorial Sloan Kettering Cancer Center, New York, NY, United States, 3Philips Healthcare, Andover, MA, United States, 4Program of Advanced Musculoskeletal Imaging (PAMI), Cleveland Clinic, Cleveland, OH, United States, 5Department of Biomedical Engineering, Cleveland Clinic, Cleveland, OH, United States, 6Department of Diagnostic Radiology, Cleveland Clinic, Cleveland, OH, United States
Synopsis
Magnetization-prepared gradient echo (MP-GRE) sequences have been commonly used for quantitative MRI in the literature to improve imaging speed. Paired acquisitions with RF phase-cycling could eliminate image blurring due to longitudinal relaxation and loss of MP contrast along the GRE readouts, with doubled scan time. This study introduces a novel unpaired phase cycling strategy to eliminate the time penalty with reduced sensitivity to B0 field inhomogeneities for high resolution quantitative mapping in MP-GRE sequences. The feasibility and efficacy of this strategy were demonstrated in both phantom and human studies.
INTRODUCTION
Magnetization-prepared gradient echo (MP-GRE) sequences have been commonly used for quantitative MRI in the literature to improve imaging speed in 3D quantitative imaging, where MR signals are acquired in a GRE readout train after each MP. Although multiple k-space lines can be acquired after each preparation, quantitative accuracy and spatial fidelity are both compromised by the contaminating T1 relaxation and loss of MP contrast along the GRE readouts. The combination of PC and flip angle sweep in the 3D MP-GRE sequence led to the development of the magnetization-prepared angle-modulated partitioned k-space spoiled gradient-echo snapshots (MAPSS) sequence, which has been applied for high resolution T1ρ mapping for knee cartilage evaluation.1 The MAPSS sequence, however, doubles the already long scan time in 3D quantitative mapping, which may undermine its reliability and reproducibility due to potential motion during the lengthened scan. We propose here an efficient PC strategy to eliminate the confounding term in 3D-GRE quantitative mapping.THEORY AND METHODS
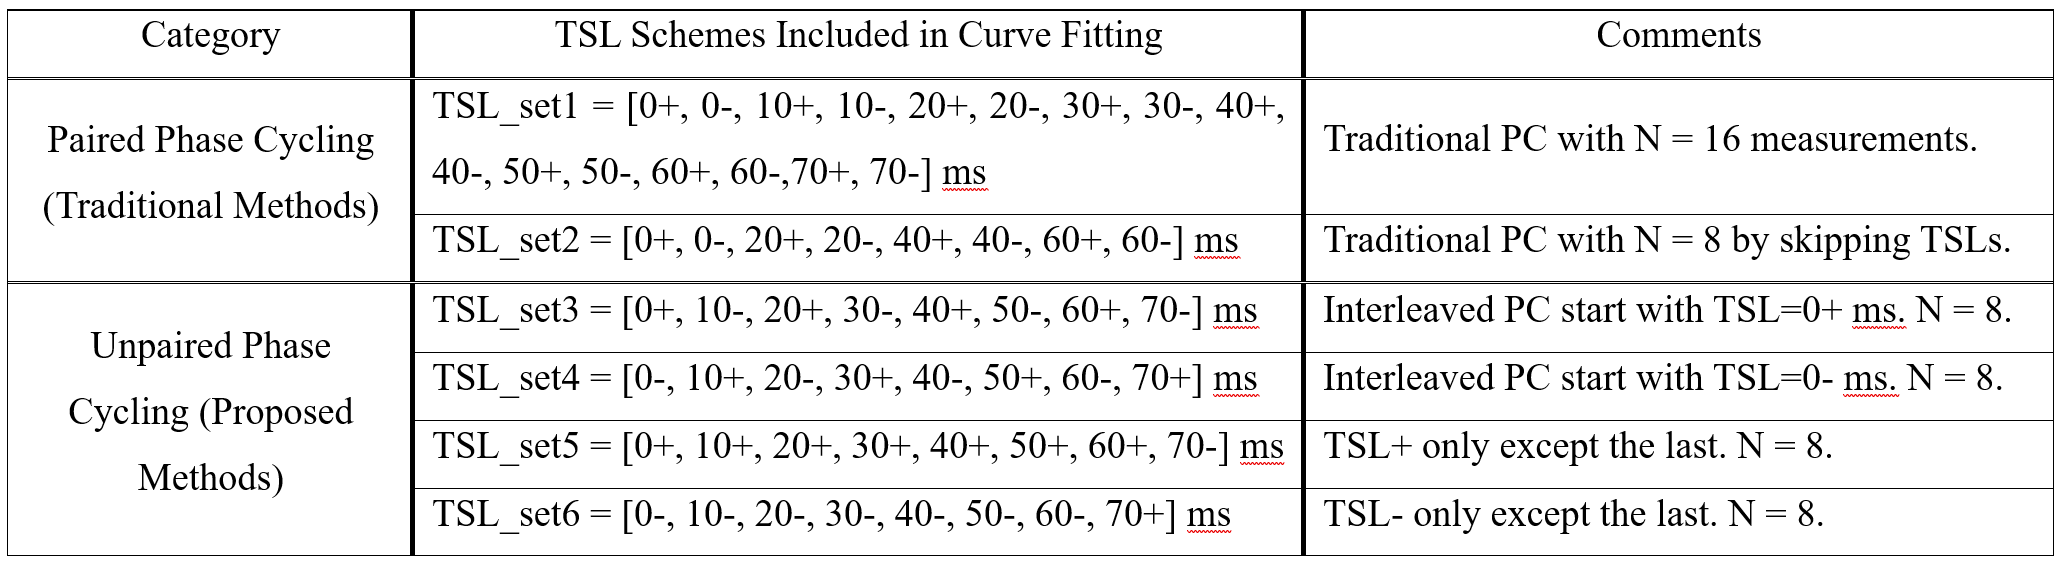
In a train of uniformly spaced RF pulses, the signal after the nth RF excitation based on the Block equation can be expressed as Mxy(n)=A(n)Mprep+B(n).2 In MAPSS, two acquisition with opposite phase cycles are obtained before subtraction to eliminate the contaminating B(n) term. We propose to use S, where paired PC is no longer mandated before curve-fitting. All experiments were performed using a 3T (Philips Ingenia) using a phantom with three pairs of tubes (2, 3, and 4 % agarose). The 3D T1ρ MAPSS scan had 16 acquisitions with different TSL and PC, and the T1ρ maps using the six TSL PC schemes were generated retrospectively (Table 1). The quantitative results from six different tubes within the center plane, as well as 4 additional off-center slices with 1.5cm gap were compared. T1ρref was measured from the ROI on the T1ρ map of the center slice using TSL_set1. The T1ρ measurements from all 5 ROIs at different slices of each tube were averaged to get the overall T1ρmean and T1ρstdev of each tube. T1ρ quantification performance for each PC scheme was evaluated using the Mean Percentage Error (MPE) and Coefficient of Variation (CV). A volunteer knee scan was also performed to confirm its validity on human.RESULTS
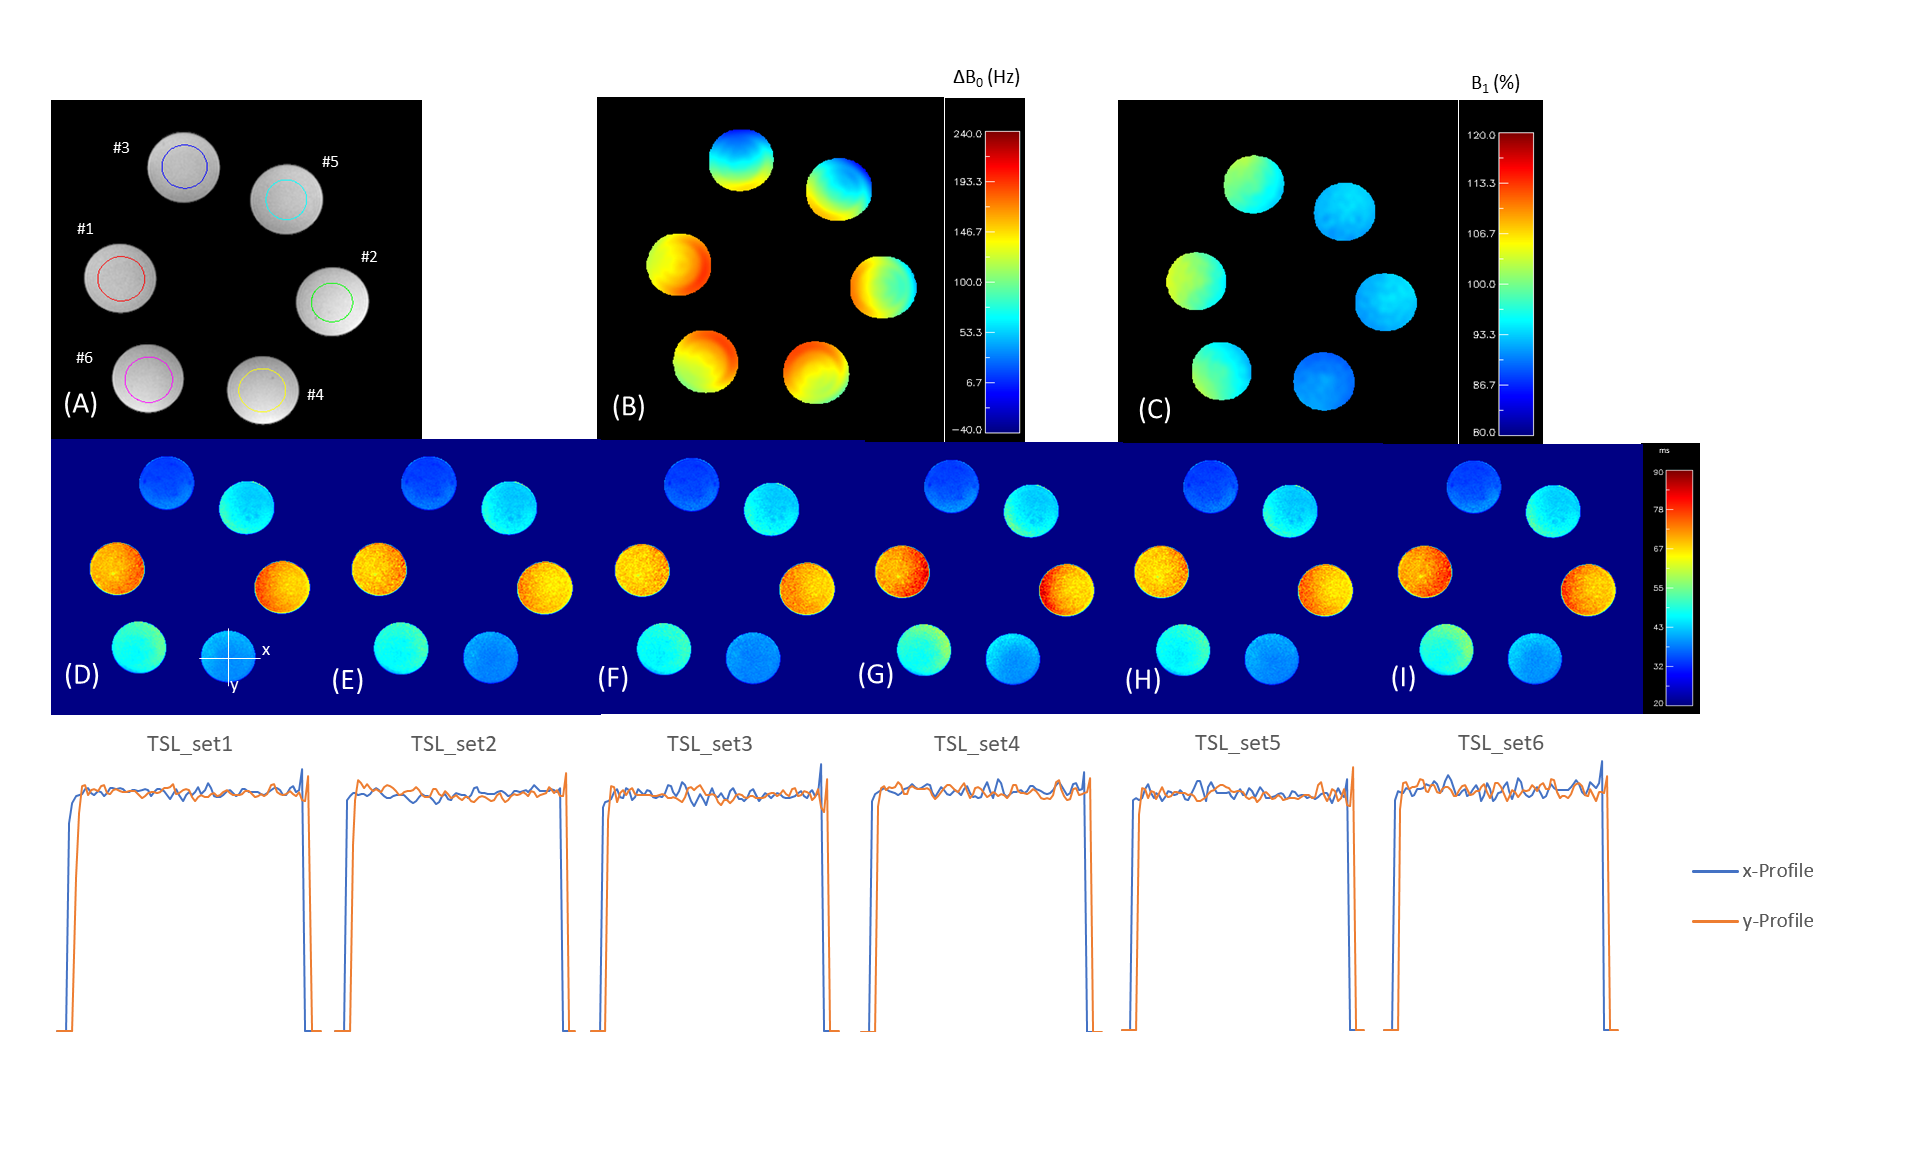
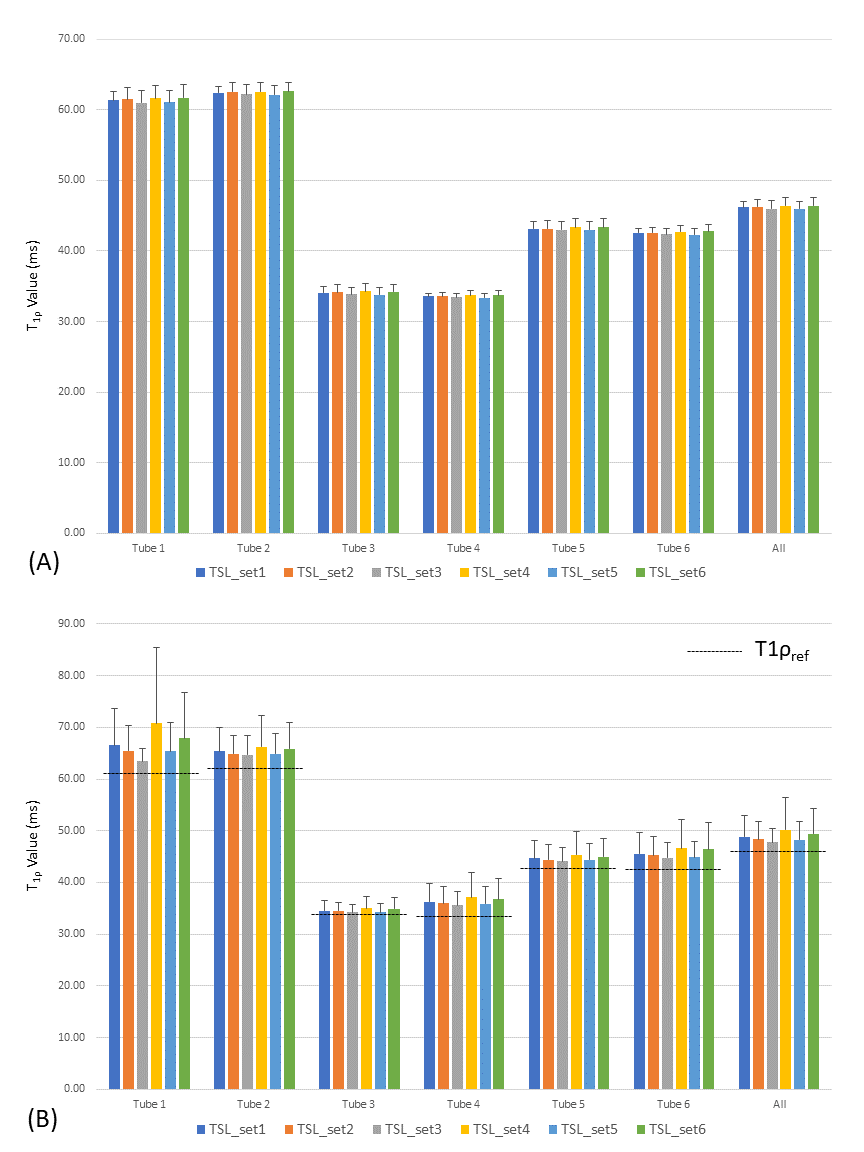
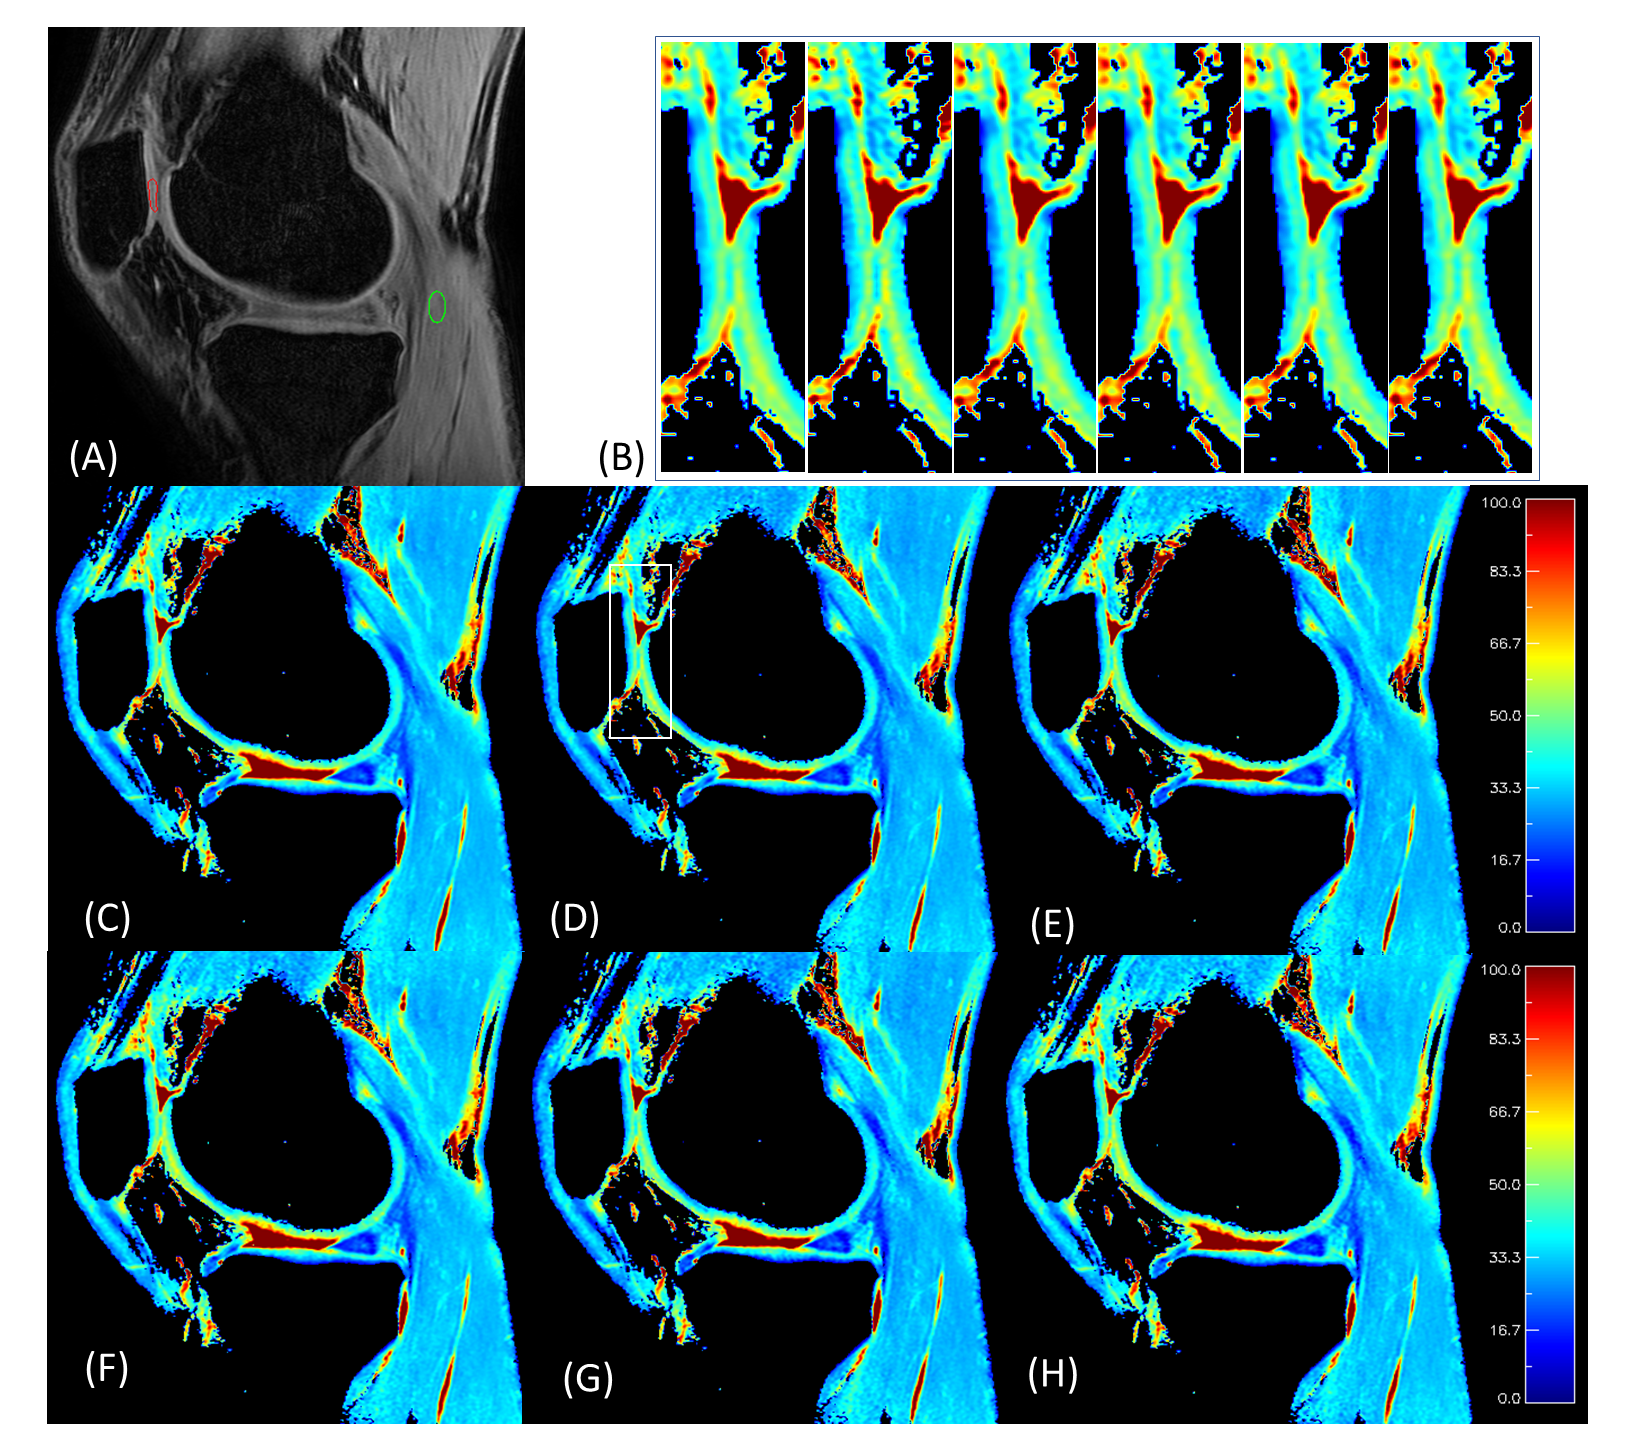
Representative phantom results are shown in Figure 1. No significant boundary signal oscillation/blurring can be observed from these maps, indicating that the unpaired PC strategy effectively eliminated the signal contaminations from T1 recovery as expected. This observation is further confirmed when comparing the y line profiles against the x line profiles, indicating similar boundary response for all methods tested. Based on visual observation, TSL_set3 outperforms the rest including TSL_set1 with the least T1ρ non-uniformity within each phantom, as well as the best consistency between phantom pairs. Quantitatively, the average MPE from the center slices were all less than 0.5% (Figure 2A), regardless of which TSL schemes used. Five-slice averaged results however had much different T1ρ than T1ρref. Among them all, TSL_set3 had minimum average MPE and CV of 3.51% and 5.79%, compared to these of 5.76% and 8.33% using TSL_set1 (Figure 2B). Overall, of the four newly proposed unpaired PC schemes, TSL_set3 compared favorably with the traditional MAPSS with paired PC (TSL_set1 and TSL_set2), TSL_set5 had slightly better or similar performance, and TSL_sets 4, 6 had worse performance when compared to TSL_set1. Figure 3 shows the representative results from the human study. All T1ρ maps had high spatial fidelity along both directions with little difference between them. In the zoom-in figures of Figure 3B, all maps had nice T1ρ variations along cartilage layers at the interface of the patellar femoral joint, and without adjacent synovial fluids contaminations due to minimal spatial blurring. The high spatial fidelity of the T1ρ maps from all four unpaired TSL PC schemes further confirmed the effectiveness of the unpaired PC strategy, consistent with the phantom results.DISCUSSION
The originally proposed MAPSS sequence acquires paired RF PC datasets and eliminates T1 recovery signal contamination along a long readout train with paired subtraction.1 In this work, we demonstrated the feasibility and the additional advantages of using an unpaired PC strategy for more efficient quantitative MR mapping. Our proposed PC framework alleviated the time penalty to achieve high spatial fidelity in quantitative imaging required by the original MAPSS sequence. Unlike other recent fast imaging such as PI or CS, this 50% reduction of scan time comes without loss of SNR efficiency, compromised spatial fidelity, or undesirable artifacts. It can be combined with all existing fast imaging techniques including PI and CS. This approach allows additional flexibility in protocol optimization to ultimately achieve high spatial resolution and high accuracy quantitative mapping. Carefully chosen schemes with this strategy potentially allow more accurate quantitative mapping with halved scan time needed, without reducing number of sampling points, to obtain more accurate quantitative mapping within clinically affordable scan duration in a variety of applications.CONCLUSION
Unpaired PC strategy potentially allows more accurate quantitative mapping with halved scan time compared to the paired PC approach. It therefore offers additional flexibility in SNR optimization, spatial resolution improvement, and choice of sampling points to obtain more accurate quantitative mapping.Acknowledgements
No acknowledgement found.References
1. Li X, Han ET, Busse RF, Majumdar S. In vivo T(1rho) mapping in cartilage using 3D magnetization-prepared angle-modulated partitioned k-space spoiled gradient echo snapshots (3D MAPSS). Magn Reson Med 2008;59(2):298-307.
2. Williams CF, Redpath TW. Sources of artifact and systematic error in quantitative snapshot of FLASH imaging and methods for their elimination. Magn Reson Med 1999;41(1):63-71.
Figures