3312
MR T1Ρ preparations: B1 and B0 inhomogeneity response on 3T and 7T systems1Department of Biomedical Engineering, Program of Advanced Musculoskeletal Imaging (PAMI), Cleveland Clinic, Cleveland, OH, United States, 2Case Western Reserve University, Cleveland, OH, United States, 3Department of Radiology, Albert Einstein College of Medicine and Montefiore Medical Center, Bronx, NY, United States, 4Department of Medical Physics, Memorial Sloan Kettering Cancer Center, New York, NY, United States, 5Philips Healthcare, Andover, MA, United States, 6Department of Diagnostic Radiology, Cleveland Clinic, Cleveland, OH, United States
Synopsis
Quantitative T1ρ mapping is a promising biomarker for detecting tissue compositional changes at early stages of diseases. For reliable and reproducible measurements, T1ρ preparation pulses should be robust to B0 and B1 inhomogeneity. In this work, six different preparation schemes were evaluated in terms of their responses to B0 and B1 inhomogeneities on agarose phantoms and volunteers using both 3T and 7T MRI systems.
Introduction
Quantitative T1ρ mapping has shown its capability in detecting tissue compositional changes at the early stages of diseases for multiple organs including brain, liver, breast, and musculoskeletal tissues.1-4 To use T1ρ measures as reliable imaging biomarkers, reproducible measures across sites and vendors are desired. Among the discrepancies between vendors, the most prominent factor is the B0 and B1 profile. Due to different loading effects, shimming gradients, and receiver/transmitter coil structures, the accuracy and reproducibility of the T1ρ measurement can vary significantly. This phenomenon is more significant at ultra-high field strength such as 7T. Different forms of T1ρ preparation pulses have been proposed in the literature, primarily aiming to minimize artifacts due to B0 and B1 inhomogeneities. However, systematic evaluations of T1ρ quantification accuracy under inhomogeneous B0 and B1 were limited, and no data has been reported comparing different T1ρ preparations at 7T. In this study, the T1ρ quantification accuracy of 6 different types of T1ρ preparations (5 from literature and one new preparation proposed in this study) were evaluated with different B0 and B1 field conditions at 3T and 7T, in phantoms and in knees of volunteers.Methods
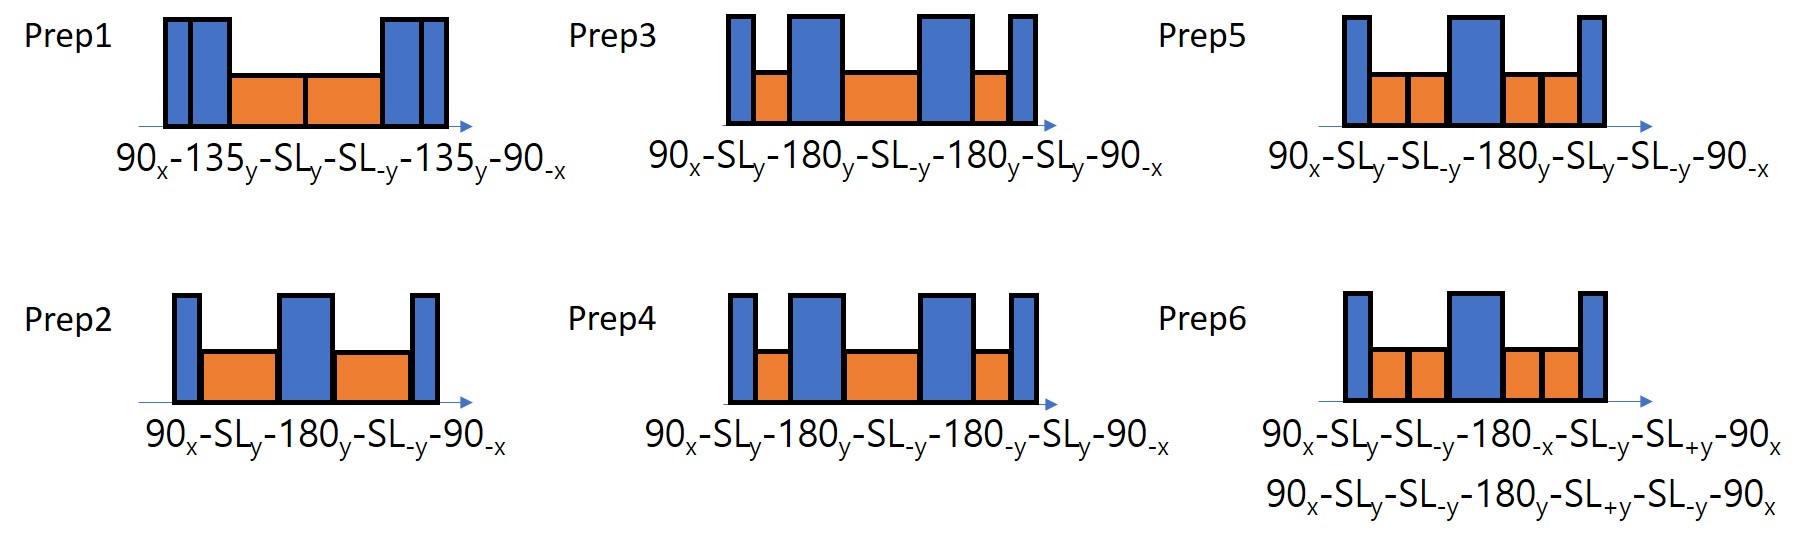
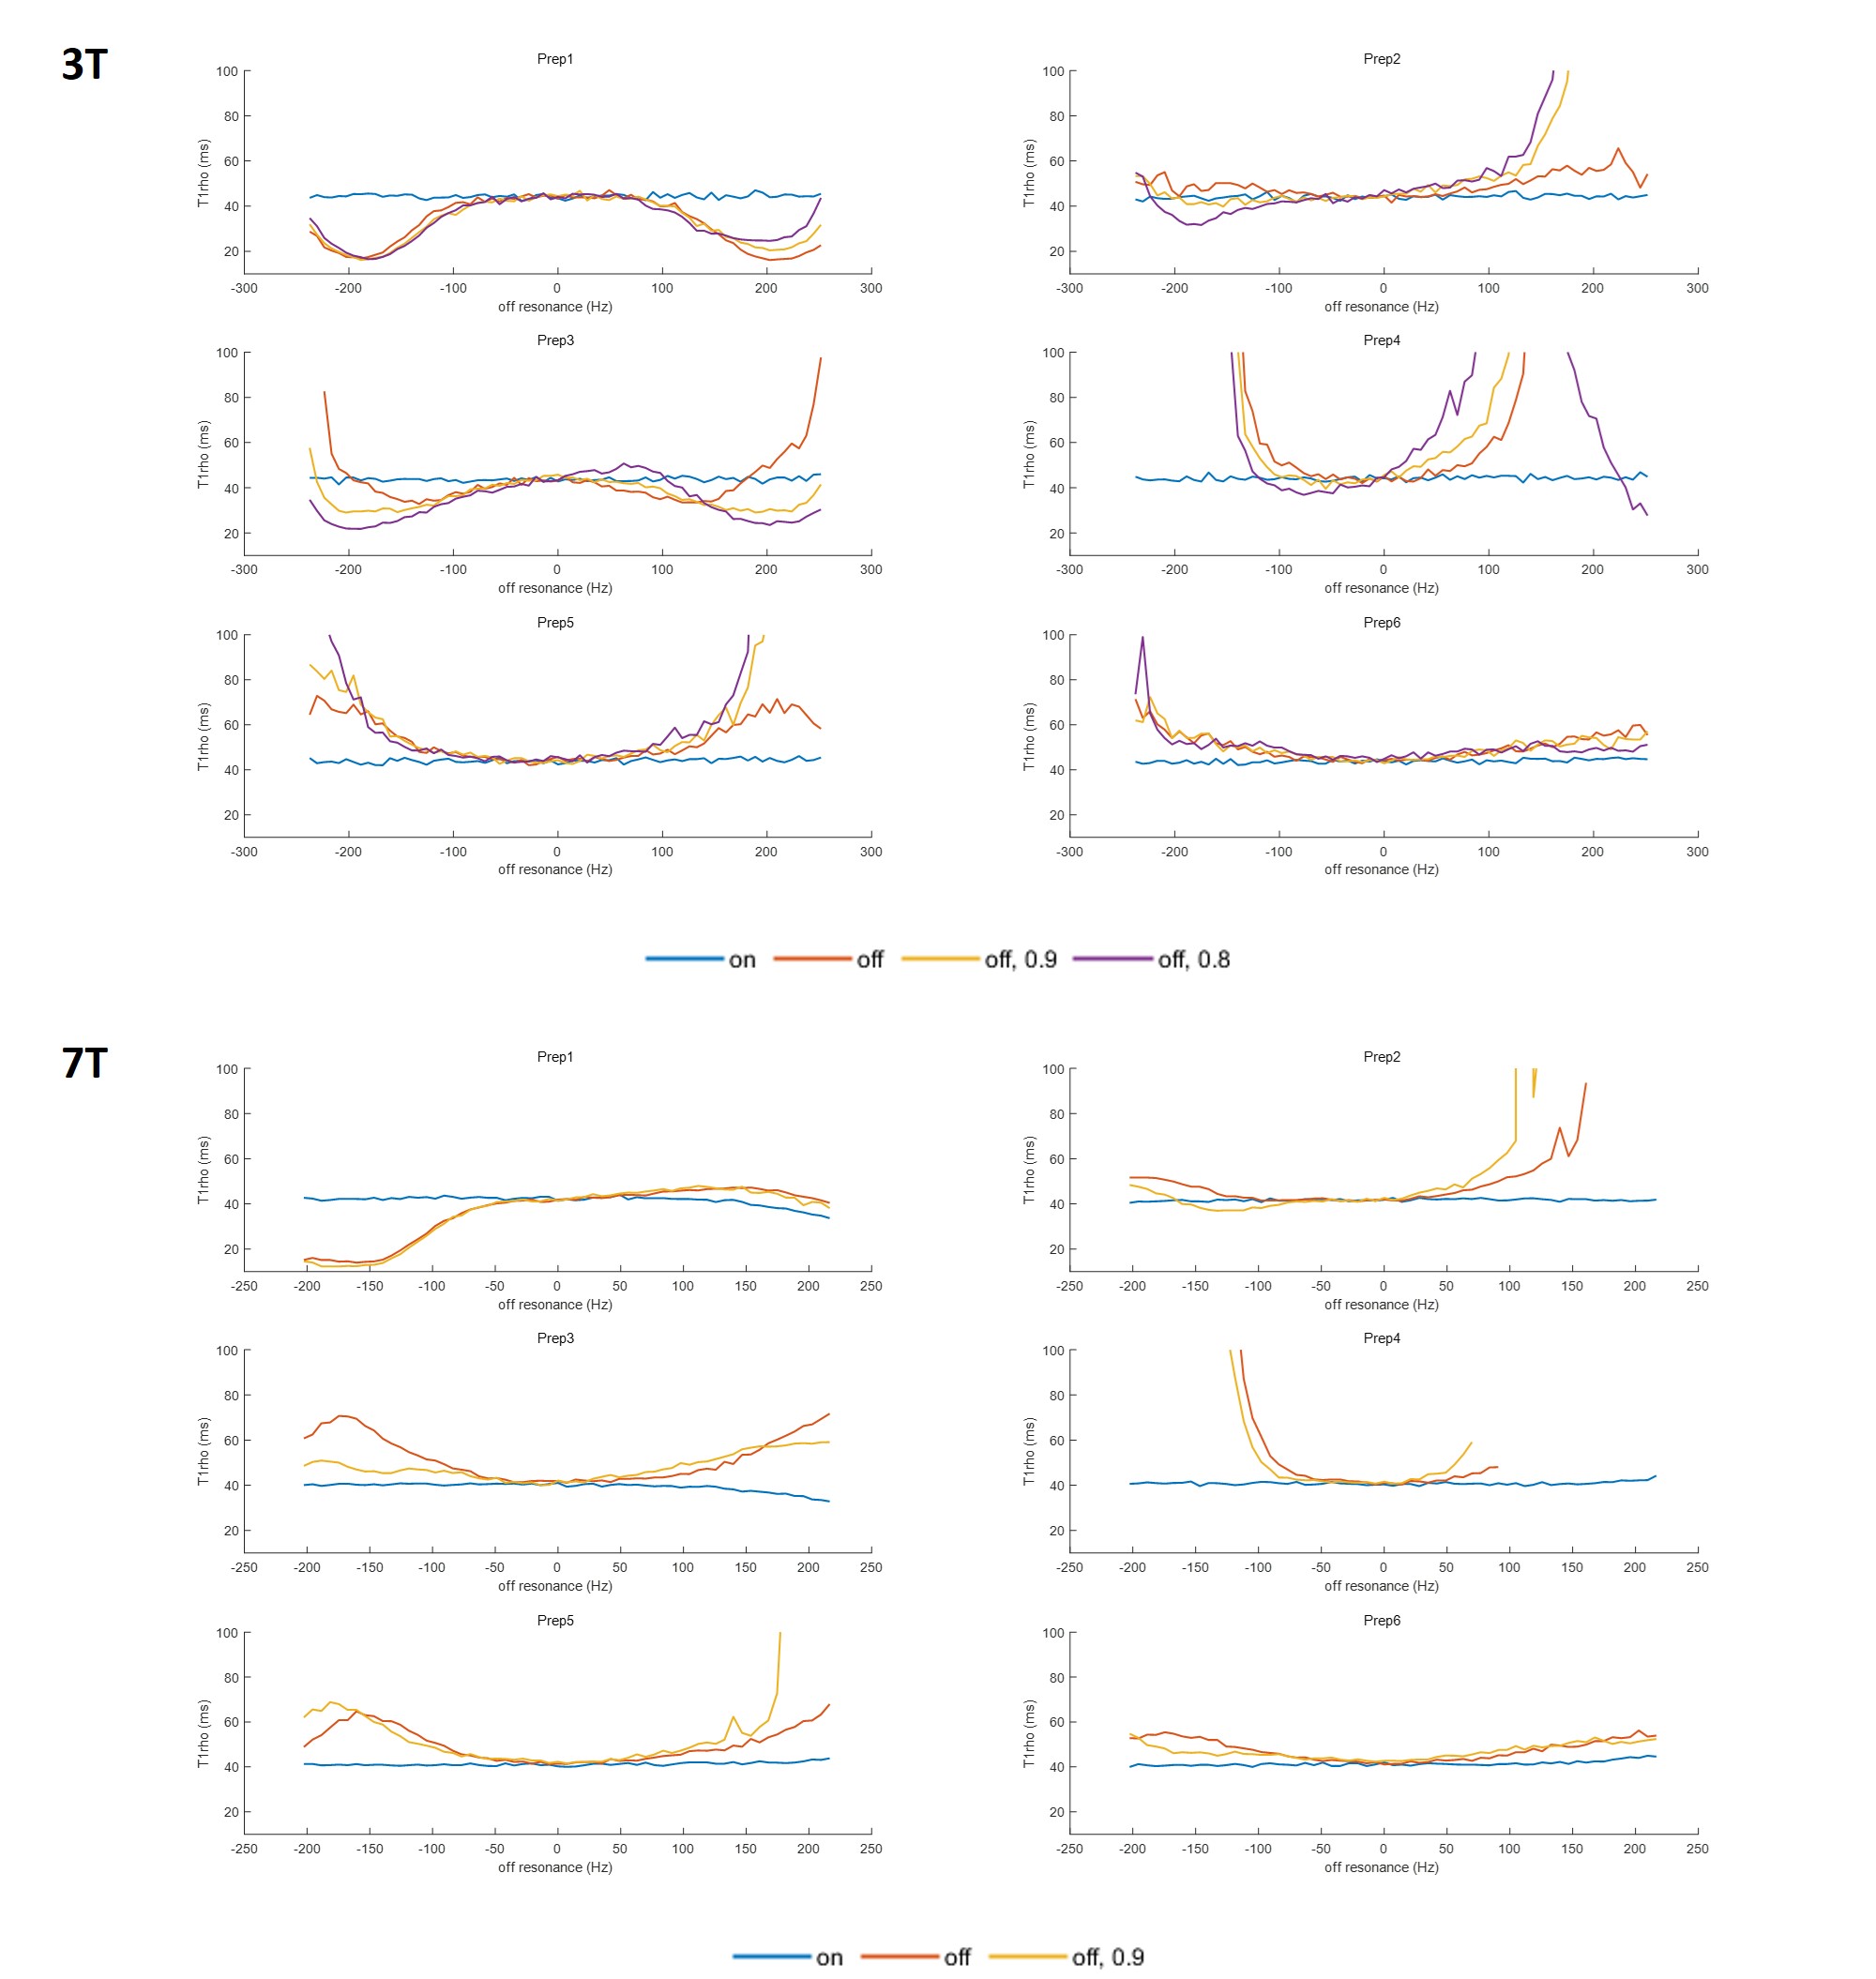
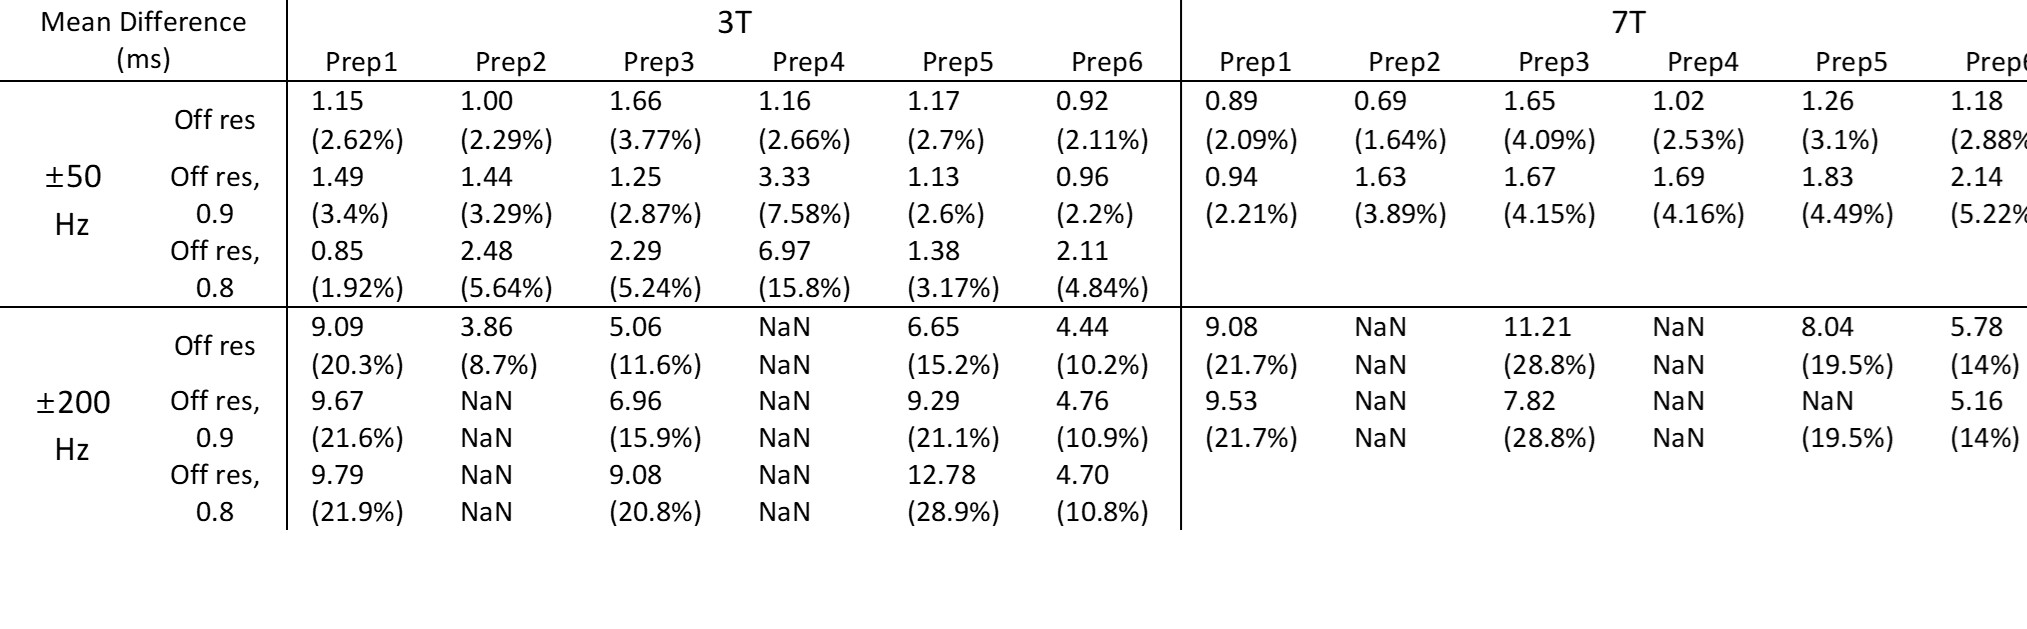
T1ρ preparations used for testing are shown in Figure 1. Prep1-5 were proposed in the literature5-8 and Prep6 was proposed based on Prep5 but with changes in phases for better compensation of B1 inhomogeneity. All preparations were implemented on both 3T Prisma and 7T MR scanners (Siemens Healthcare AG, Erlangen, Germany) in a 3D magnetization-prepared angle-modulated partitioned k-space spoiled gradient-echo snapshots (MAPSS) sequence.9,10 For RF cycling scheme in MAPSS, the phase of the last 90-degree pulse was flipped except for Prep6, where a more complex phase cycling pattern was used (Figure 1). Head coils were used for phantom (3T: 1Tx/20Rx, 7T 1Tx/32Rx), and knee coils for volunteers (3T: 1Tx/15Rx, 7T: 1Tx/28Rx).Phantom evaluations were performed with a 3% agarose gel phantom. Firstly, reference T1ρ values were measured with dedicated shimming. Secondly, to evaluate the effect of B0 inhomogeneity, T1ρ values were measured with a gradient field applied to the imaging volume to deliberately change the B0 field with respect to the position. A 300uT/m gradient was applied in the long axis of phantom, which resulted in ±250Hz inhomogeneity in a 4cm range. Lastly, to evaluate the effect of B1 inhomogeneity, T1ρ values were measured with 0.9 and 0.8 nominal B1 applying to all non-spin-lock pulses (blue in Figure 1). The B1 manipulation was not applied to spin-lock pulses to avoid the results being influenced by change in spin-lock frequency. The results were visually evaluated using the central line profiles along the applied gradient direction of the T1ρ maps generated using each preparation. For quantitative evaluations, the mean absolute and percentage differences between the reference T1ρ values and T1ρ values with added B0/B1 inhomogeneities were calculated within ±50Hz and ±200Hz B0 inhomogeneity for each preparation respectively. Spin-lock time of [0,10,20,30] ms and spin-lock frequency of 500Hz at 3T and 400Hz at 7T was used.
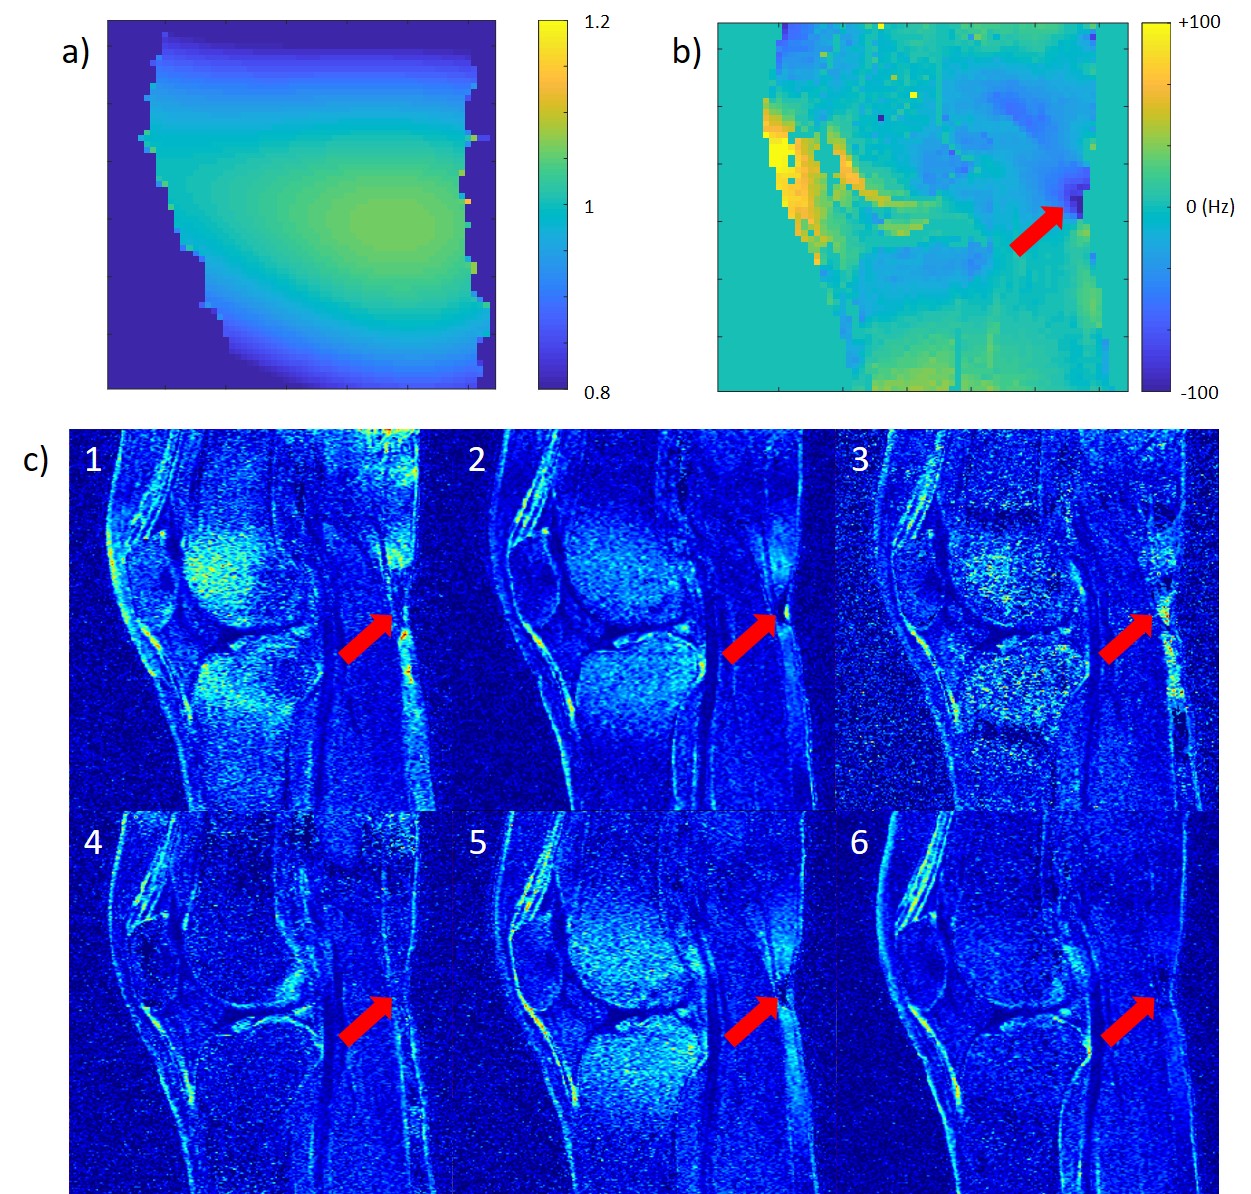
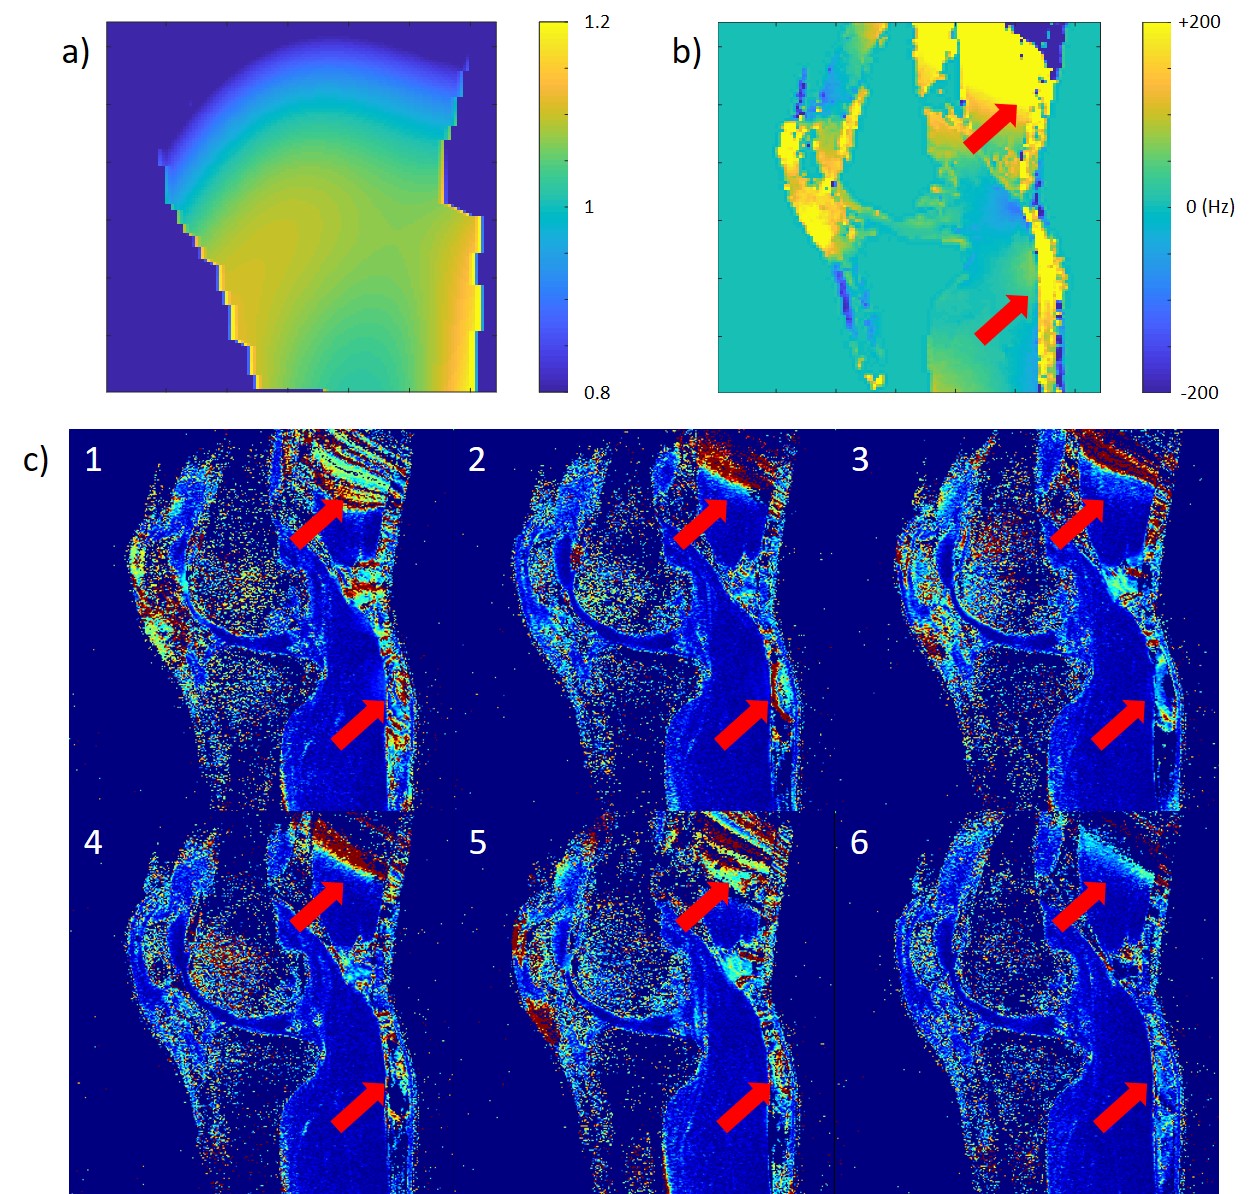
For volunteer scans, B0/B1 maps, and T1ρ imaging were collected. Spin-lock times of [0,10,40,70] ms and spin-lock frequency of 500Hz was used at 3T, and spin-lock times of [0,10,20,30] ms and spin-lock frequency of 400Hz was used at 7T. Normalized root-mean-squared-error (NRMSE) map in the fitting result was used to evaluate the results.
Results
All preparations provided the same reference T1ρ values when imaged without any B0 or B1 inhomogeneity applied. For most of the preparations, B0 inhomogeneity of 50Hz could be tolerated without much difference in T1ρ (Figure 2), and Prep1 showed the smallest mean difference from reference values with ±50Hz (average difference of 1.2ms and 2.7% at 3T and 0.9ms and 2.2% at 7T compared to the reference value) (Table 1). With increased inhomogeneity, all preparations began to quickly fail except for Prep6, where it showed to suppress imaging artifacts even in extreme cases and had the smallest mean differences from reference values within ±200Hz. In general, 7T results showed a worse profile compared to 3T due to difficulties in shimming and lower spin-lock frequency.Figure 3 and 4 show the volunteer scan results at 3T and 7T respectively. Prep6 yielded the best results, which agrees with the phantom results.
Discussion
As seen from the results, Prep6 provided the best overall performance among preparations evaluated in this study. With low B0 inhomogeneity (within ±50Hz), Prep1 performed the best with the least deviation from reference T1ρ measures. One possible explanation could be the potential contamination of T2ρ component with Prep6. While the structure of Prep6 provides cleaner echo images, the relaxation could be influenced more by T2ρ relaxation, while the structure of Prep1 was designed to align the magnetization with spin-lock RF pulse better even with the presence of B0/B1 inhomogeneities.5 To further validate and explain the findings from this experiment, Bloch-equation-based simulation with measured phantom T1ρ and T2ρ values is warranted.Conclusion
Different T1ρ preparation schemes were tested on 3T and 7T systems with various B0/B1 field setup. Prep6 provided the best performance among the candidates, but its influence from T2ρ relaxation should be further validated with numerical simulations.Acknowledgements
The study was supported by NIH/NIAMS R01 AR077452 and NIH/NIBIB U01EB023829.References
1. Haris, Mohammad, et al. "T1ρ (T 1ρ) MR imaging in Alzheimer’disease and Parkinson’s disease with and without dementia." Journal of neurology 2011; 258(3):380-5.
2. Koon, Chi-Man, et al. "Black blood T1ρ MR imaging may diagnose early stage liver fibrosis: a proof-of-principle study with rat biliary duct ligation model." Quantitative imaging in medicine and surgery 2016; 6(4):353-63.
3. Li, Lin Z., He N. Xu, and Ravinder Reddy. "Characterizing Breast Cancer Mouse Xenografts with T 1ρ-MRI." Oxygen Transport to Tissue XXXII. Springer, Boston, MA, 2011. 137-142.
4. MacKay, James W., et al. "Systematic review and meta-analysis of the reliability and discriminative validity of cartilage compositional MRI in knee osteoarthritis." Osteoarthritis and cartilage. 2018; 26(9):1140-52.
5. Chen, Weitian. "Errors in quantitative T1ρ imaging and the correction methods." Quantitative imaging in medicine and surgery. 2015; 5(4):583-91.
6. Pang, Yuxi. “A self-compensated spin-locking scheme for quantitative R1ρ dispersion in articular cartilage” ISMRM 2020
7. Gram, Maximilian, et al. "Balanced spin‐lock preparation for B1‐insensitive and B0‐insensitive quantification of the rotating frame relaxation time T1ρ." Magnetic Resonance in Medicine (2020).
8. Mitrea, Bogdan G., et al. "Paired self-compensated spin-lock preparation for improved T1ρ quantification." Journal of Magnetic Resonance. 2016; 268:49-57.
9. Li X, Han ET, Busse RF, Majumdar S. In vivo T(1ρ) mapping in cartilage using 3D magnetization prepared angle-modulated partitioned k-space spoiled gradient echo snapshots (3D MAPSS). Magnetic resonance in medicine. 2008;59(2):298-307.
10. Li X, Pedoia V, Kumar D, Rivoire J, Wyatt C, Lansdown D, et al. Cartilage T1ρ and T2 relaxation times: longitudinal reproducibility and variations using different coils, MR systems and sites. Osteoarthritis and cartilage. 2015;23(12):2214-23.
Figures