3309
Fat-insensitive T2water measurement using multiple Dixon turbo spin-echo acquisitions with effective echo time increments
Ruaridh M Gollifer1,2, Tim JP Bray1,3, Margaret Hall-Craggs1,3, and Alan Bainbridge2
1Centre for Medical Imaging (CMI), University College London, London, United Kingdom, 2Department of Medical Physics and Bioengineering, University College London Hospital, London, United Kingdom, 3Department of Imaging, University College London Hospital, London, United Kingdom
1Centre for Medical Imaging (CMI), University College London, London, United Kingdom, 2Department of Medical Physics and Bioengineering, University College London Hospital, London, United Kingdom, 3Department of Imaging, University College London Hospital, London, United Kingdom
Synopsis
Short tau inversion recovery (STIR) imaging is the mainstay of clinical imaging in inflammatory musculoskeletal (MSK) diseases, and generates hyperintense signal in areas of inflammation in bone marrow (bone marrow oedema). However, the assessment of STIR images of bone marrow is based on qualitative judgement of signal intensity and can be confounded by variations in fat content resulting from the healing response in bone to inflammation. We aimed to develop a method which would (1) separate fat and water and (2) provide a water-specific T2 measurement, enabling separation and individual quantification of oedema and fat in the bone marrow.
Introduction
MRI has become a key component of pathways for diagnosing, phenotyping and monitoring inflammation in inflammatory musculoskeletal (MSK) diseases1-3. T2-weighted short inversion time inversion recovery (STIR) imaging is the mainstay of imaging these disorders, and areas of hyperintensity within bone marrow indicate active inflammation. The key mechanisms for this hyperintensity are thought to be elongated T2 of the water component (T2water) and reduced fat fraction3,4. However, radiological assessment of STIR images for diagnostic and disease management purposes is subjective. Furthermore, variations in fat content due to chronic inflammation (e.g. fat metaplasia in the bone marrow) make interpretation difficult because the tissue becomes heterogenous and areas of ‘spared’ normal tissue are difficult to differentiate from oedema/inflammation1,2. Therefore, quantitative measurements of tissue characteristics are needed to improve specificity and to offer more detailed tissue characterisation.To address this problem, we aim to develop a single integrated acquisition that can (1) separate water and fat signals and (2) perform T2 relaxometry on the water component in the marrow. Here, as a proof of concept, we used a series of discrete Dixon turbo spin echo (TSE) acquisitions with incrementally increasing effective echo times in order to achieve water T2water quantification. This approach represents a simplification of methodology by Janiczek et al., who used a Carr-Purcell-Meiboom-Gill (CPMG) echo train with asymmetric echoes for Dixon encoding5. We assess the accuracy of this method in a phantom constructed to provide a range of fat fraction and T2 values, with T2water and T2fat values obtained using MR spectroscopy as a gold standard6,7.
Methods
Imaging was performed in the phantom and in the bone marrow of a healthy volunteer. The phantom consisted of containers with varying agar concentration (2%, 3% and 4% to modify T2)8 and with varying fat fraction (0%, 30% and 40% by volume). Emulsification was achieved using sodium dodecyl sulphate (SDS) surfactant, and all the phantoms were solid (Figure 1).Imaging was performed using a 3.0T Philips Ingenia scanner. T2water quantification was achieved using a series of optimised Philips Dixon TSE acquisitions with incrementally increasing effective echo time (TEeff 20ms, 30ms,40ms, 60ms, 80ms and 100ms) (see schematic, Figure 2). The echo spacing increased with increasing TEeff (corresponding values were 9.2ms, 13.8ms, 18.4ms, 27.6ms, 36.8ms and 46ms). Other parameters included: pixel spacing 0.6x0.6mm; slice thickness 5mm, TR 3000ms, linear k-space ordering; flip angle/refocusing angle 90o/180o; image matrix 400x392 (448x422 for healthy volunteer); echo train length 8; SENSE factor 2; acquisition duration 69 seconds. The total scan duration for six Dixon TSE acquisitions was approximately seven minutes. T2water measurements were obtained using a monoexponential fit, implemented in MATLAB using a nonlinear least squares solver (Levenberg-Marquardt). We implemented an extended phase graph (EPG) based correction method to account for the effect of non-180° refocusing pulses and to measure T2 over the TEeff increments9,10; however, this was not used in the present work as all TSE acquisitions used 180° refocusing pulses.
Multi-echo Point RESolved Spectroscopy (PRESS) was performed with a 15x15x15 voxel placed in the centre of each container with echo times of 40, 60, 80, 100 and 140ms and TR of 5000ms. The spectra were analysed in jMRUI11,12 using the AMARES package13 (Figure 1). T2water estimates from Dixon TSE data were compared against MRS (as a reference standard) using linear regression, with two tailed t-tests to determine if regression slopes and intercepts were significant.
Results
T2 estimates derived from water-only images from the Dixon TSE acquisition are compared against spectroscopy in Figure 3. Images from the volunteer are shown in Figures 4 and 5.T2water estimates from Dixon TSE were accurate and linearly related to reference T2water estimates from spectroscopy over the range of FF values investigated (regression slope = 0.77, P < 0.001, regression intercept = 10.5, P = 0.004. There was a decrease in T2water with increasing FF of the phantom observed in both the Dixon TSE data and in the MRS data.
In vivo imaging produced good quality images which were artifact free and produced plausible T2 values in relevant structures (with lower values in bone marrow (47.6ms) and fat (41.1ms) and higher values in intervertebral disc (388.8ms)) (Figure 4).
Discussion and Conclusions
T2water measurements using multiple Dixon TSE acquisitions with echo time increments provide T2 measurements over a range of fat fraction values that shown similar behaviour with respect to agar concentration and fat fraction as the reference MRS method. Separating out the water and fat signals before performing relaxometry may be particularly advantageous in bone marrow because it normally contains a substantial proportion of fat. Our results suggest that the proposed methodology is promising and offers sufficient accuracy and linearity14 to warrant further development.The proposed fat-insensitive T2water measurement offers a quantitative alternative to the widely-used STIR sequence and could enable more accurate and precise diagnosis, monitoring and phenotyping of inflammatory diseases affecting the bone marrow. This multiparametric approach has the advantage that a number of images with different contrasts can be generated in one acquisition, potentially increasing value and reducing scan time. Our next step will be to measure T2water in cohorts of healthy volunteers and in patients with bone marrow inflammation.
Acknowledgements
RMG is supported by the UCL Biomedical Research Centre (BRC). TJPB is supported by an NIHR Clinical Lectureship (CL-2019-18-001). MHC is supported by UCLH BRC. This work was undertaken at UCLH/UCL, which receives funding from the UK Department of Health’s the National Institute for Health Research (NIHR) Biomedical Research Centre (BRC) funding scheme.References
- Sieper, J. et al. The Assessment of SpondyloArthritis international Society (ASAS) handbook: A guide to assess spondyloarthritis. Ann. Rheum. Dis. 68, ii1–ii44 (2009).
- Bray, T. J. P. et al. Recommendations for acquisition and interpretation of MRI of the spine and sacroiliac joints in the diagnosis of axial spondyloarthritis in the UK. Rheumatology 58, 1831–1838 (2019).
- Bray, T. J. P., Bainbridge, A., Punwani, S., Ioannou, Y. & Hall-Craggs, M. A. Simultaneous Quantification of Bone Edema/Adiposity and Structure in Inflamed Bone Using Chemical Shift-Encoded MRI in Spondyloarthritis. Magn. Reson. Med. 79, 1031–1042 (2018).
- Bray, T. J. P., Chouhan, M. D., Punwani, S., Bridge, A. & Hall-Craggs, M. A. Fat fraction mapping using magnetic resonance imaging: Insight into pathophysiology. British Journal of Radiology vol. 91 (2018).
- Janiczek, R. L. et al. Simultaneous T 2 and lipid quantitation using IDEAL-CPMG. Magn. Reson. Med. 66, 1293–1302 (2011).
- Klose, U. Measurement sequences for single voxel proton MR spectroscopy. Eur. J. Radiol. 67, 194–201 (2008).
- Bley, T. A., Wieben, O., François, C. J., Brittain, J. H. & Reeder, S. B. Fat and water magnetic resonance imaging. Journal of Magnetic Resonance Imaging vol. 31 4–18 (2010).
- Christoffersson, J. O., Olsson, L. E. & Sjöberg, S. Nickel-doped agarose gel phantoms in MR imaging. Acta radiol. 32, 426–431 (1991).
- Weigel, M. Extended phase graphs: Dephasing, RF pulses, and echoes - Pure and simple. Journal of Magnetic Resonance Imaging vol. 41 266–295 (2015).
- Nöth, U., Shrestha, M., Schüre, J. R. & Deichmann, R. Quantitative in vivo T2 mapping using fast spin echo techniques – A linear correction procedure. Neuroimage 157, 476–485 (2017).
- Naressi, A., Couturier, C., Castang, I., De Beer, R. & Graveron-Demilly, D. Java-based graphical user interface for MRUI, a software package for quantitation of in vivo/medical magnetic resonance spectroscopy signals. Comput. Biol. Med. 31, 269–286 (2001).
- Stefan, D. et al. Quantitation of magnetic resonance spectroscopy signals: The jMRUI software package. Meas. Sci. Technol. 20, 104035 (2009).
- Vanhamme, L., Van Den Boogaart, A. & Huffel, S. Van. Improved Method for Accurate and Efficient Quantification of MRS Data with Use of Prior Knowledge. JOURNAL OF MAGNETIC RESONANCE vol. 129 (1997).
- Sullivan, D. C. et al. Metrology standards for quantitative imaging biomarkers1. Radiology 277, 813–825 (2015).
Figures
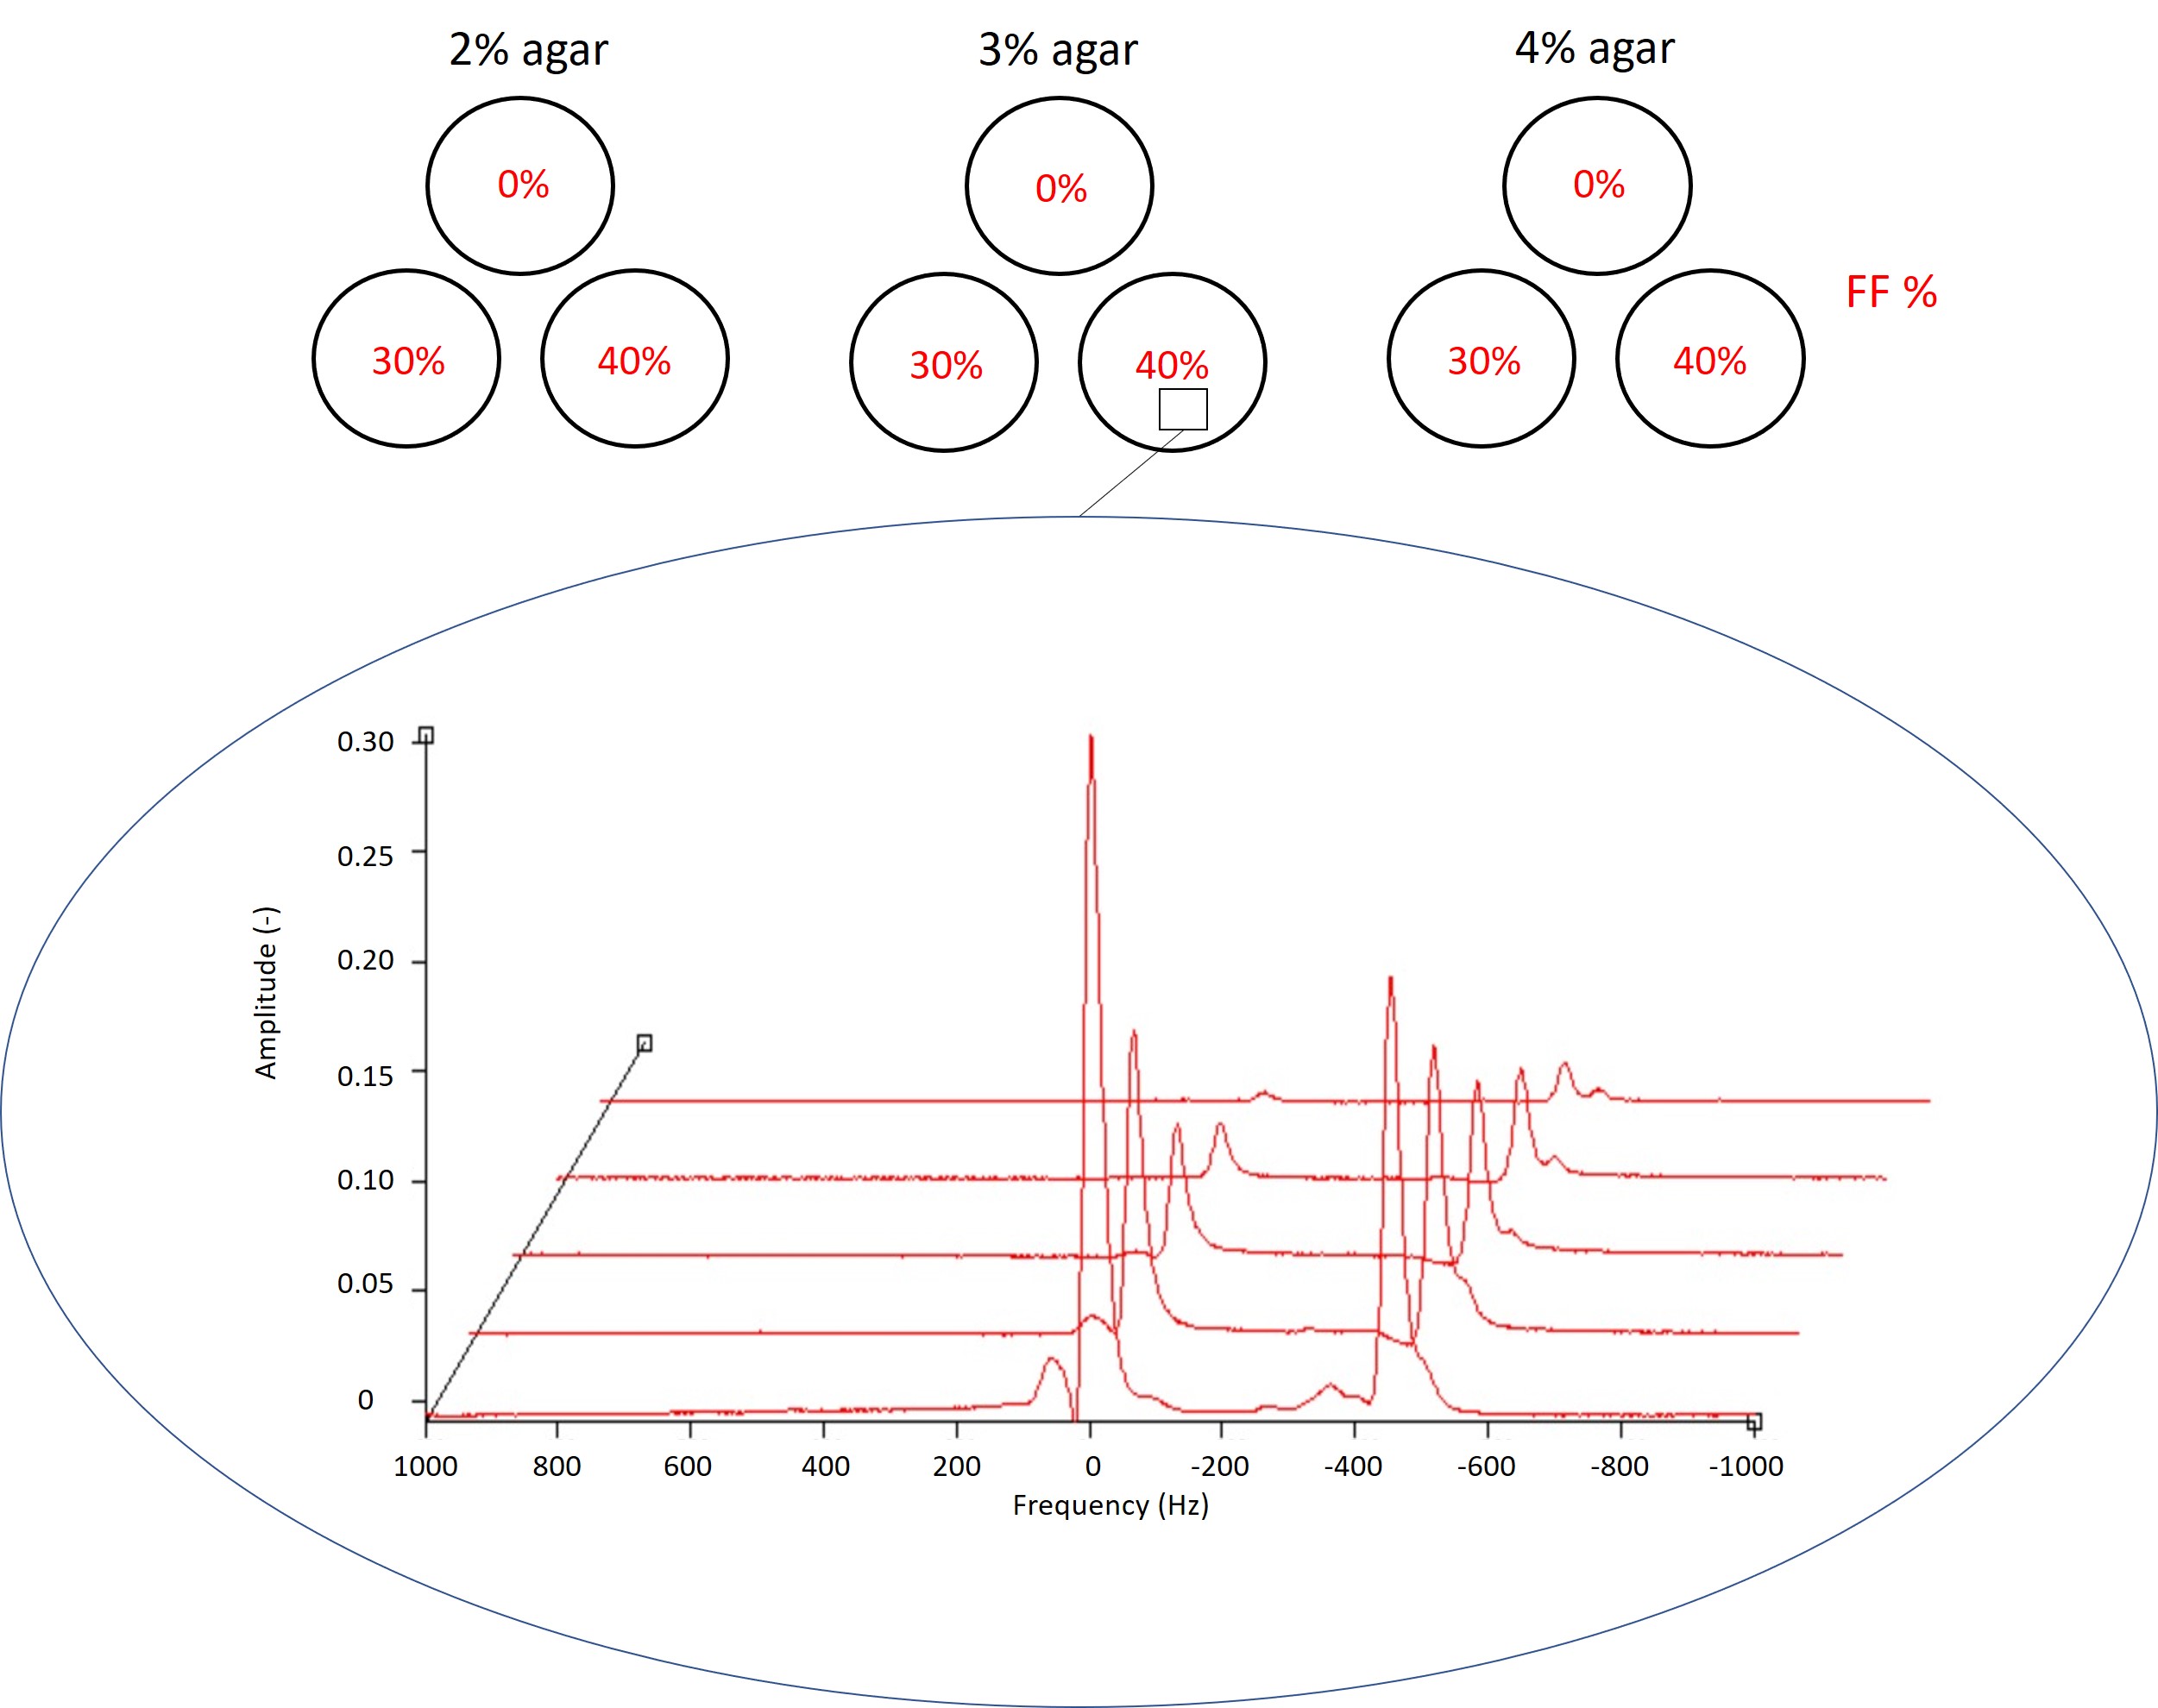
Figure 1: Schematic
of the fat-water phantom with varying agar concentration of 2% (top left), 3%
(top middle) and 4% (top right) and with varying fat fraction of 0%, 30% and
40% (labelled in red). The PRESS voxel for 3% agar 40% FF tub provides the
spectra (bottom) with a mixture of water peaks (main water peak at 0Hz) and fat
peaks (main fat peak resonates more slowly than water peak at -420Hz at 3.0T).
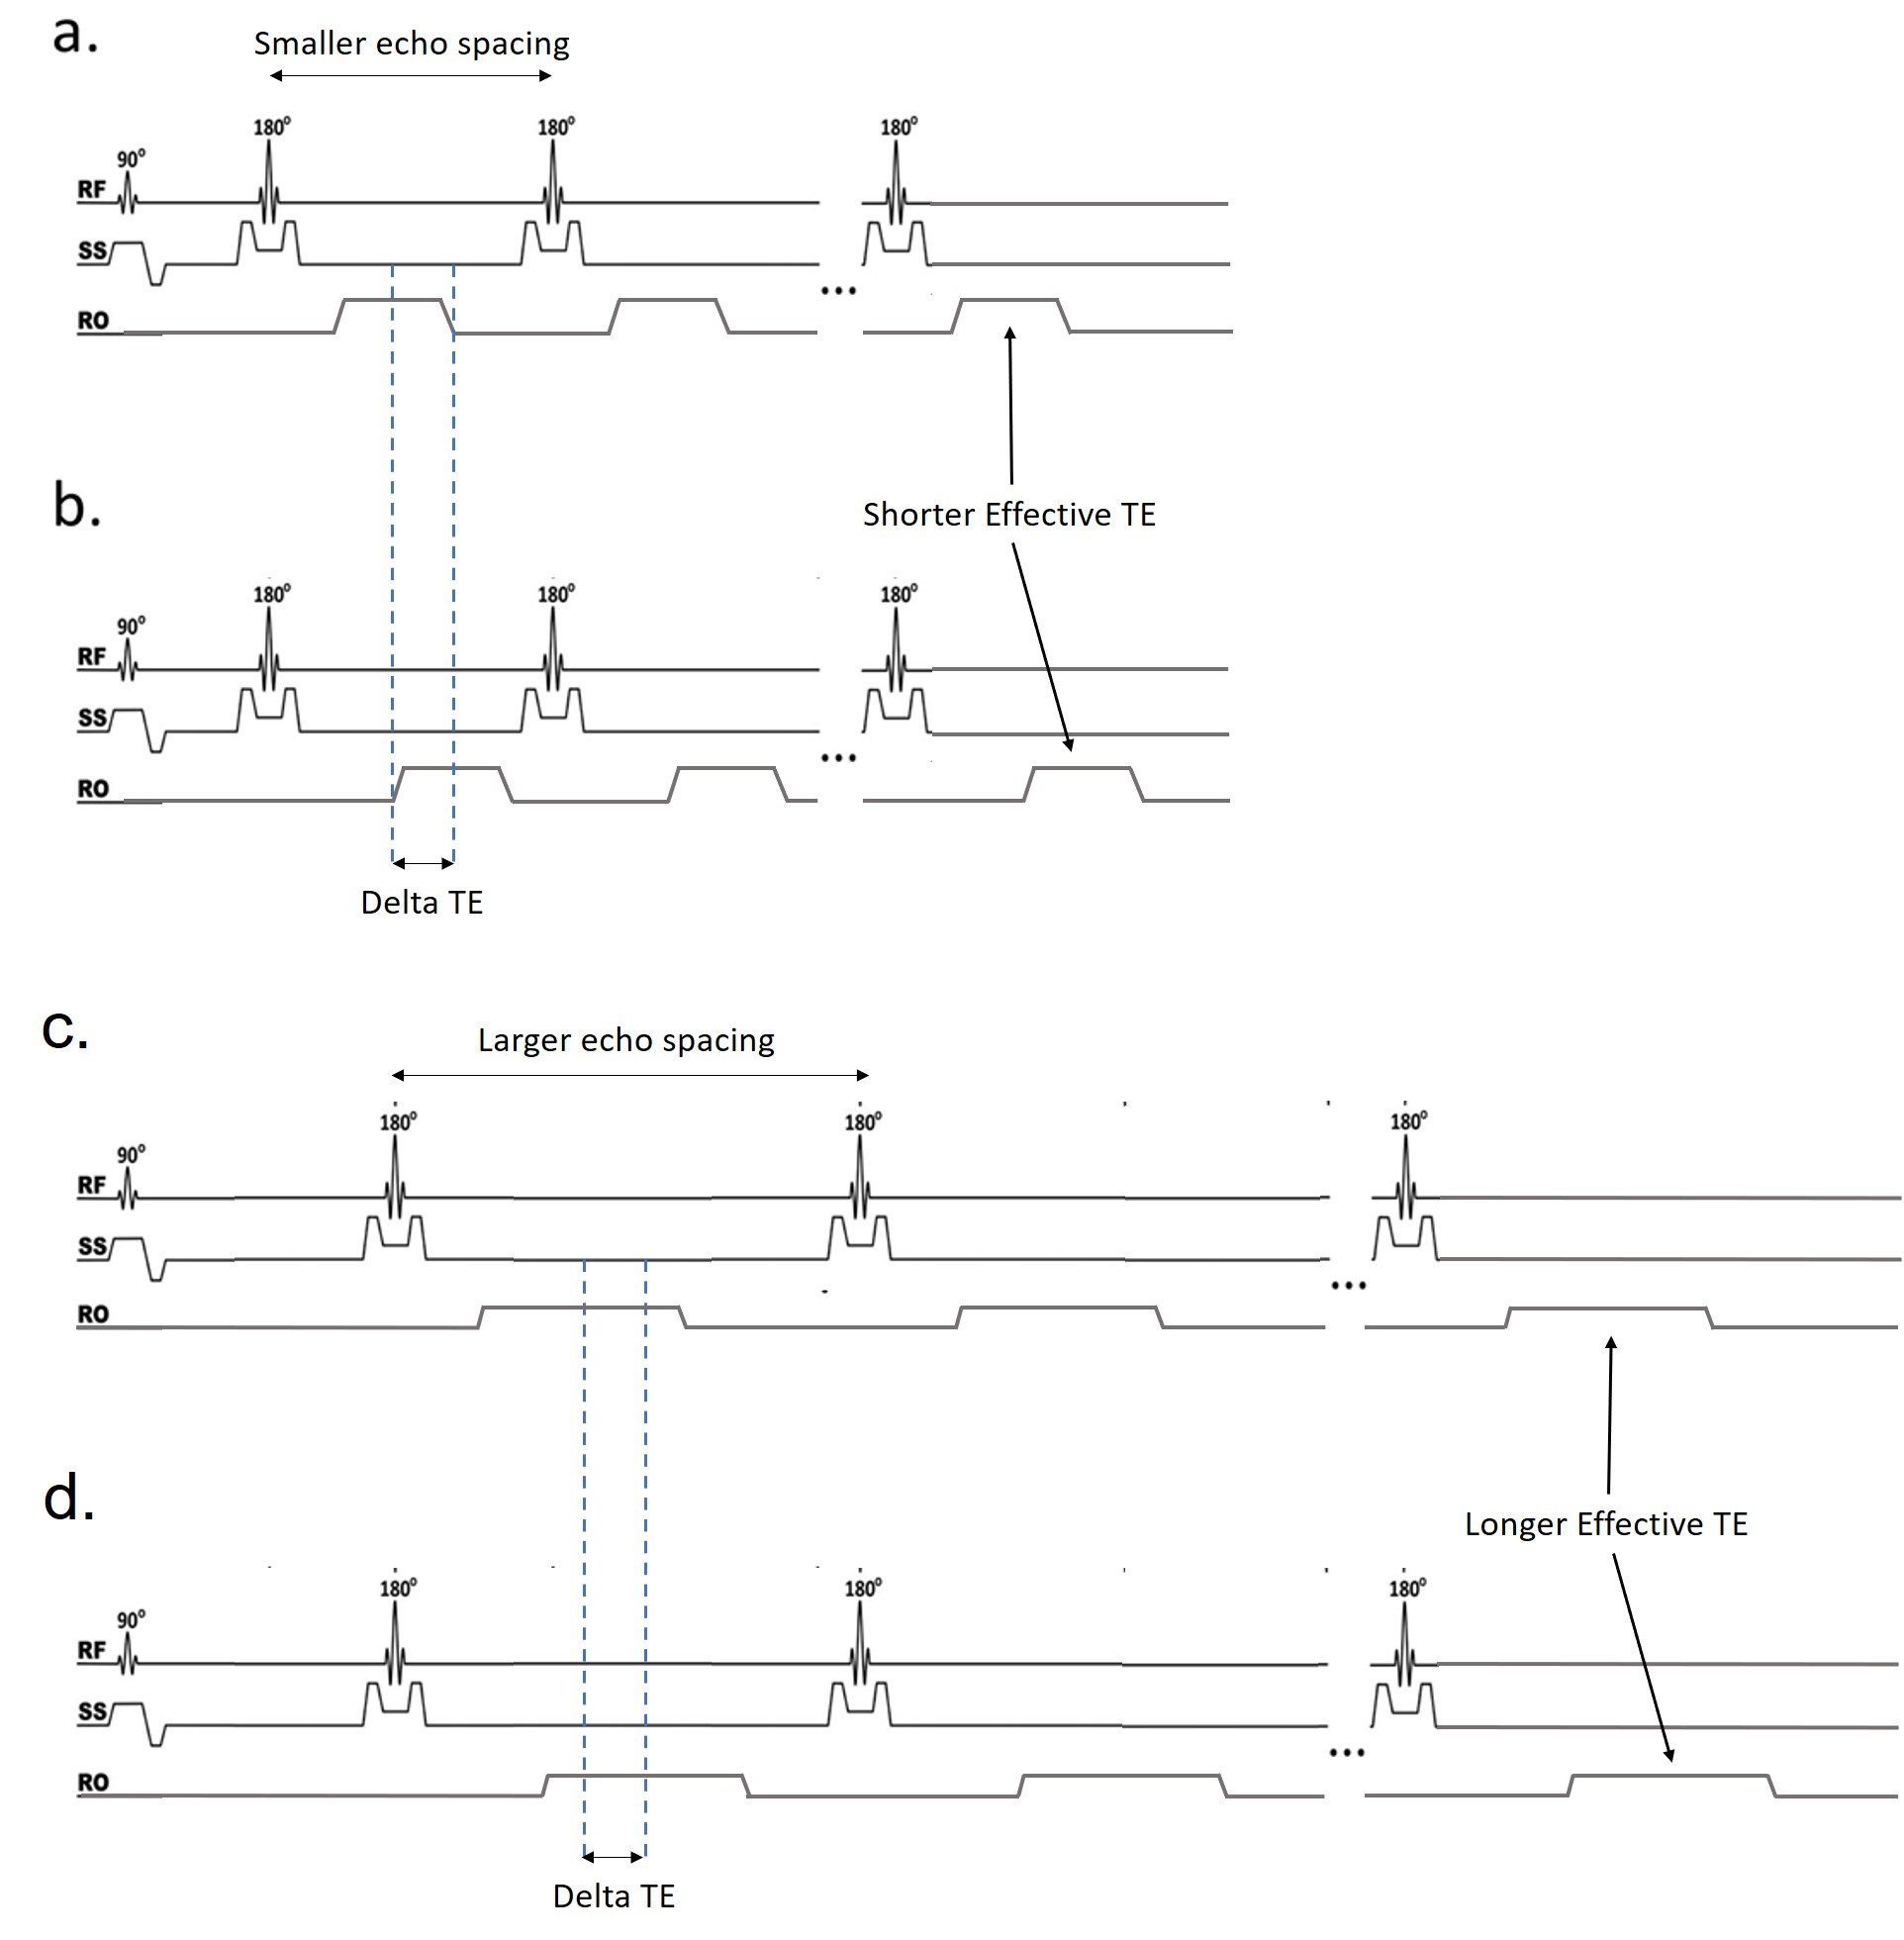
Figure 2: Sequence schematic of TSE Dixon. There are two echoes
acquired (shifted by delta TE) for each effective TE acquisition. Examples are
shown of the sequence for a shorter effective TE with a smaller echo spacing
and delta TE (a-b) and of the sequence for a longer effective TE with a larger
echo spacing and delta TE (c-d).
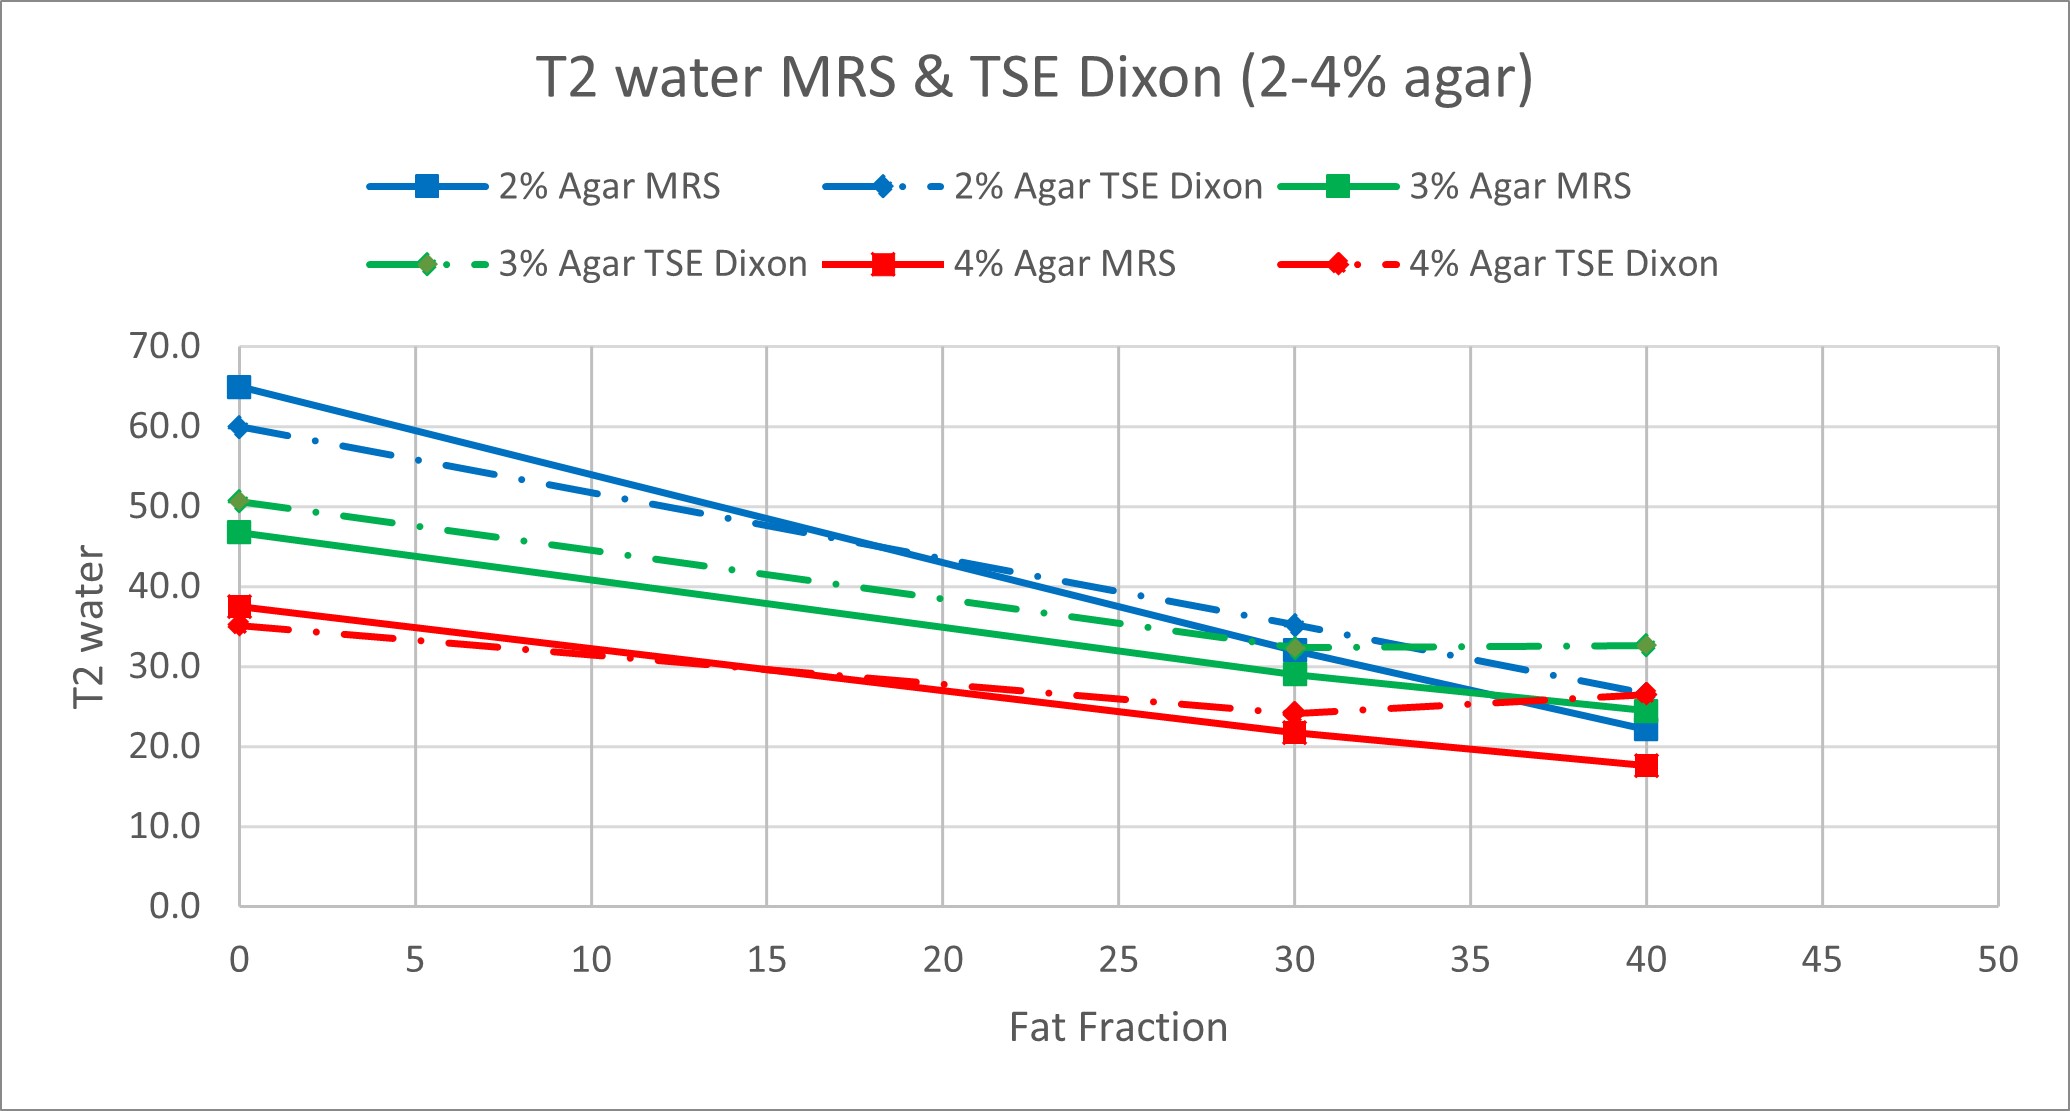
Figure 3: T2water values for TSE Dixon compared to
MRS for FFs of 0, 30 and 40% and agar concentrations of 2% (blue), 3% (green)
and 4% (red).
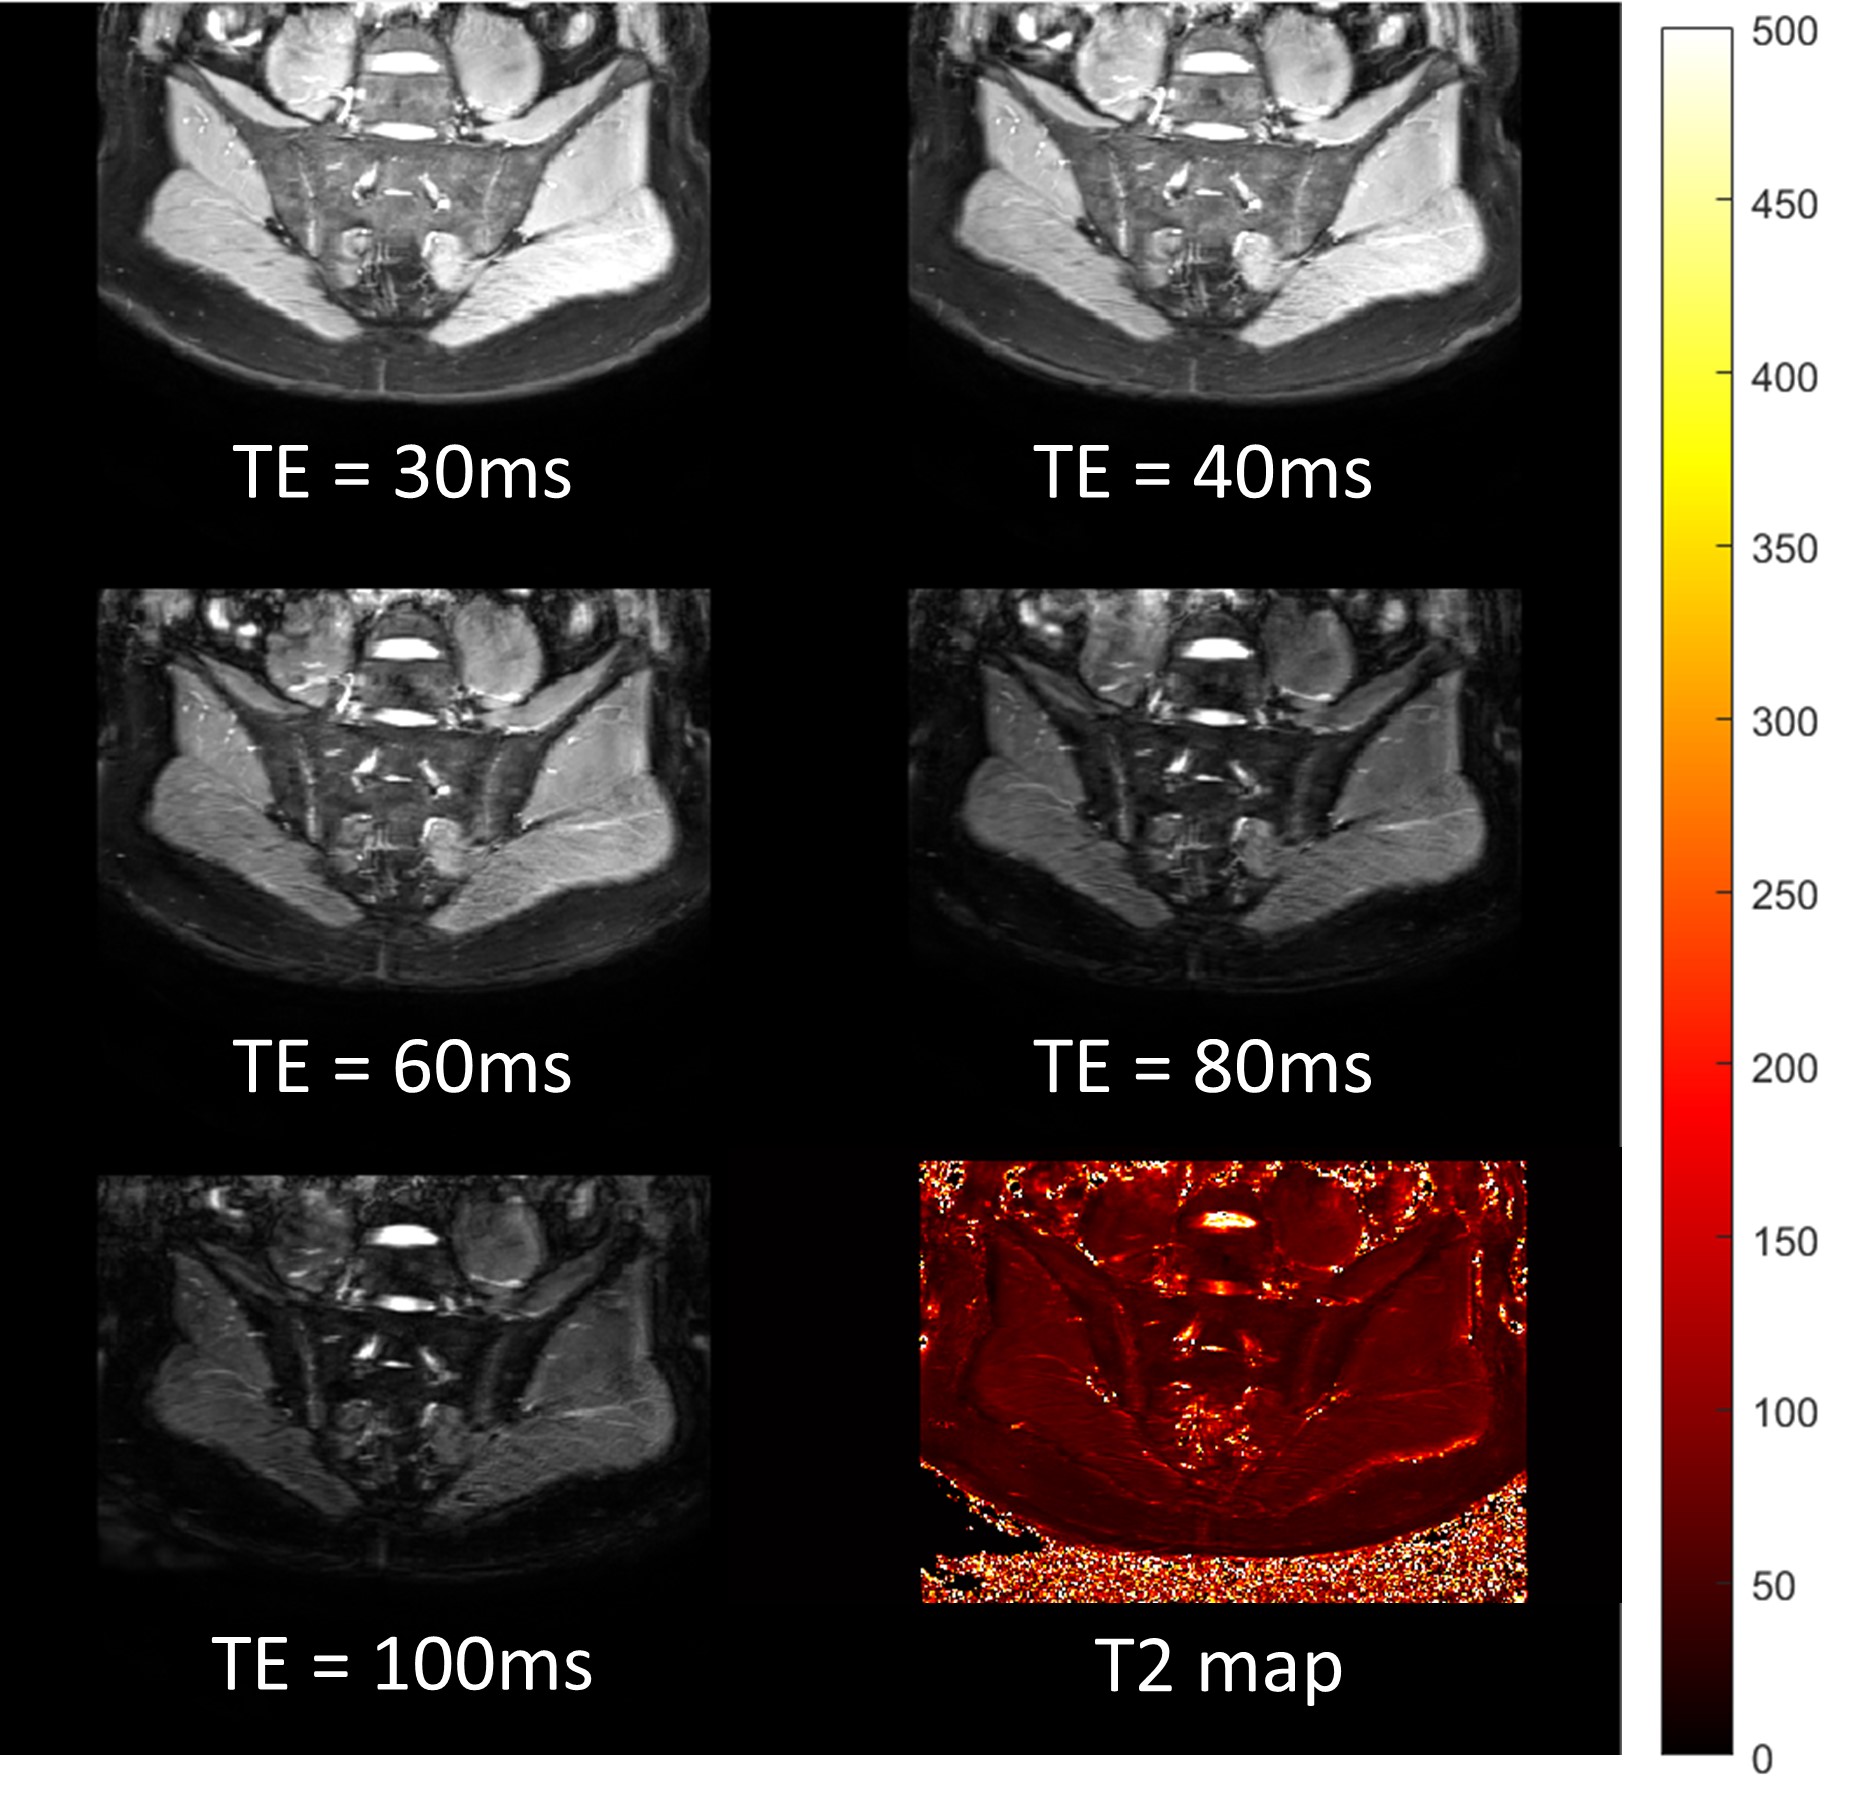
Figure 4: Healthy volunteer scan of TSE Dixon sequence for water only images with
corresponding T2 map.
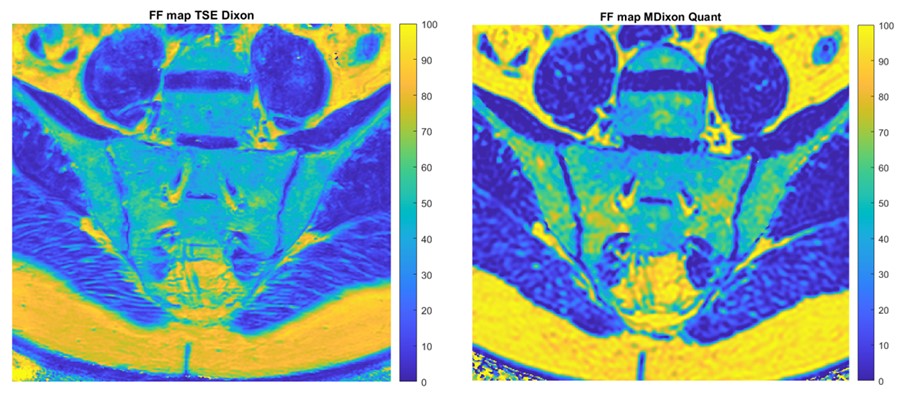
Figure 5: Healthy volunteer FF maps with a comparison between TSE Dixon (left)
and mDixon Quant (right).