3308
Super-resolution T2* mapping of the knee using UTE Spiral VIBE MRI1Siemens Healthcare NV/SA, Beersel, Belgium, 2imec-Vision Lab, Department of Physics, University of Antwerp, Wilrijk, Belgium, 3Department of Radiology, Antwerp University Hospital and University of Antwerp, Edegem, Belgium
Synopsis
T2* mapping using ultrashort echo time (UTE) MRI allows for quantitative evaluation of collagen-rich knee structures with short mean transverse relaxation times. However, acquisitions with low through-plane resolution are commonly used to obtain T2* maps within reasonable scan times, affecting the accuracy of the estimations because of partial volume effects. In this work, model-based super-resolution reconstructions based on UTE Spiral VIBE MRI were performed to obtain high-resolution T2* maps of knee structures within a reasonable scan time. The obtained T2* maps are comparable to maps generated with direct 3D UTE Spiral VIBE acquisitions while requiring approximately 25% less scan time.
Introduction
Ultrashort echo time (UTE) MRI enables the detection and monitoring of knee injuries of highly organized collagen-rich structures with short mean transverse relaxation times.1 UTE T2* mapping, in particular, can estimate ultrashort (<1.0 ms) and short (1–10 ms) T2* relaxation times based on data sampled at multiple echo times (TEs), starting at 0.5 ms or shorter.1,2 When the sampling is extended up to long TEs (>10 ms), more comprehensive knee T2* maps, including tissues with long mean T2*, can be reconstructed.3 However, this wider T2* sensitivity comes at the expense of higher acquisition times. Consequently, in vivo validation studies commonly acquire UTE T2*-weighted images with lower (>1 mm) through-plane resolution.4,5 Yet, accompanying partial volume effects may negatively affect the reliability of T2* measurements. There is thus a need for high-resolution (HR) T2* mapping methods that enable accurate and precise estimation of (ultra)short and long T2* values in a reasonable scan time.Model-based super-resolution reconstruction can provide a better trade-off between SNR, acquisition time, and resolution compared to standard 3D relaxometry, by directly estimating HR parametric maps from a set of acquisitions with low through-plane resolution.6,7 We hypothesized that this can be translated to T2* mapping of the knee.
The aim of this study was to evaluate the feasibility of using UTE Spiral VIBE MRI for super-resolution T2* mapping of knee structures within a reasonable scan time.
Methods
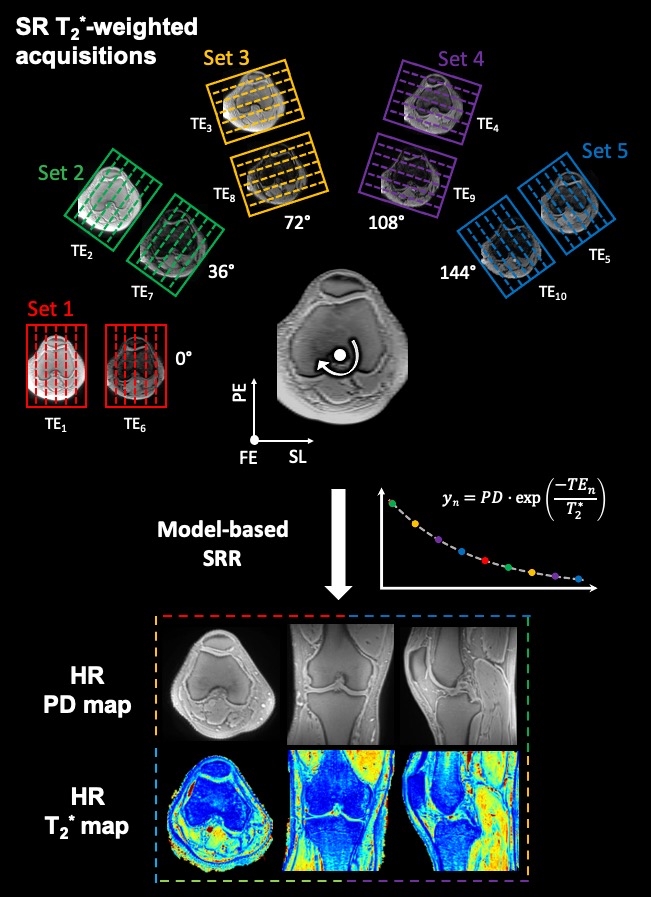
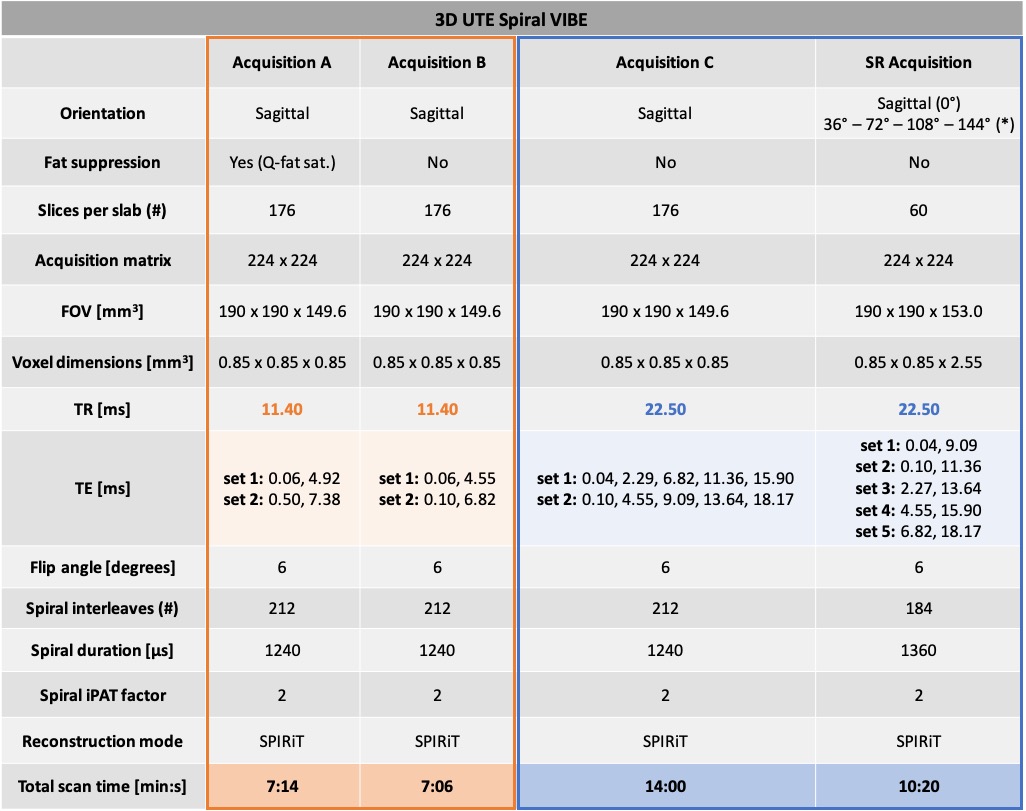
Three asymptomatic volunteers were scanned on a 3T MR scanner (Prisma Fit, Siemens Healthcare) with a 15-channel knee coil (QED). Per volunteer, four T2*-weighted datasets were acquired with an accelerated prototypical 3D UTE Spiral VIBE sequence.8,9 Acquisition parameters are listed in Table 1. As fat suppression leads to increased T2* estimates11, acquisitions B, C and super-resolution were acquired without fat saturation and TEs were chosen as close as possible to the in-phase TEs of water and fat. A TR = 11.40 ms was used for acquisitions A and B,11,12 while a TR = 22.50 ms was chosen for acquisition C and super-resolution acquisitions to accommodate more and longer TEs. The super-resolution protocol consisted of five acquisitions with low through-plane resolution rotated around the frequency-encoding direction (see Figure 1).For acquisitions A, B and C, all images were rigidly registered to their respective first T2*-weighted image (TE1) using the Advanced Mattes Mutual Information metric in Elastix.13,14 T2* relaxation times were estimated voxel-wise using constrained non-linear least-squares fitting of a mono-exponential T2* relaxation model.
Model-based super-resolution T2* mapping with joint inter-scan motion estimation was performed as a constrained and regularized non-linear least squares estimation15,16:$$\left(\widehat{\boldsymbol{PD}},\widehat{\boldsymbol{T}_2^*},\widehat{\boldsymbol{\theta}}\right)=\arg\min_{\boldsymbol{PD},\boldsymbol{T}_2^*,\boldsymbol{\theta}}\left\{\parallel\mid\boldsymbol{A}_{\boldsymbol{\theta}}\boldsymbol{f}\left(\boldsymbol{PD},\boldsymbol{T}_2^*;\boldsymbol{TEs}\right)\mid-\:\boldsymbol{y}\!\parallel_2^2+\:\lambda_{\boldsymbol{PD}}\text{TV}\left(\boldsymbol{PD}\right)+\lambda_{\boldsymbol{T}_2^*}\text{TV}\left(\boldsymbol{T}_2^*\right)\right\}$$
with $$$\boldsymbol{PD}$$$ and $$$\boldsymbol{T}_2^*$$$ vectors respectively representing the HR proton density (PD) and T2* parameter maps, and $$$\boldsymbol{\theta}$$$ the unintended motion parameters to be estimated, $$$\boldsymbol{y}$$$ a vector representing the low-resolution T2*-weighted magnitude data, $$$\boldsymbol{A}_{\boldsymbol{\theta}}$$$ the super-resolution reconstruction forward operator modelling the rotated acquisition, $$$\boldsymbol{f}$$$ a mono-exponential T2* relaxation model, and $$$\mid\cdot\mid$$$ the absolute value operator. The second and third term depict Total Variation regularization on each relaxation model parameter map, controlled by their corresponding weighting factors $$$\lambda_{\boldsymbol{PD}}$$$ and $$$\lambda_{\boldsymbol{T}_2^*}$$$ that were heuristically determined.
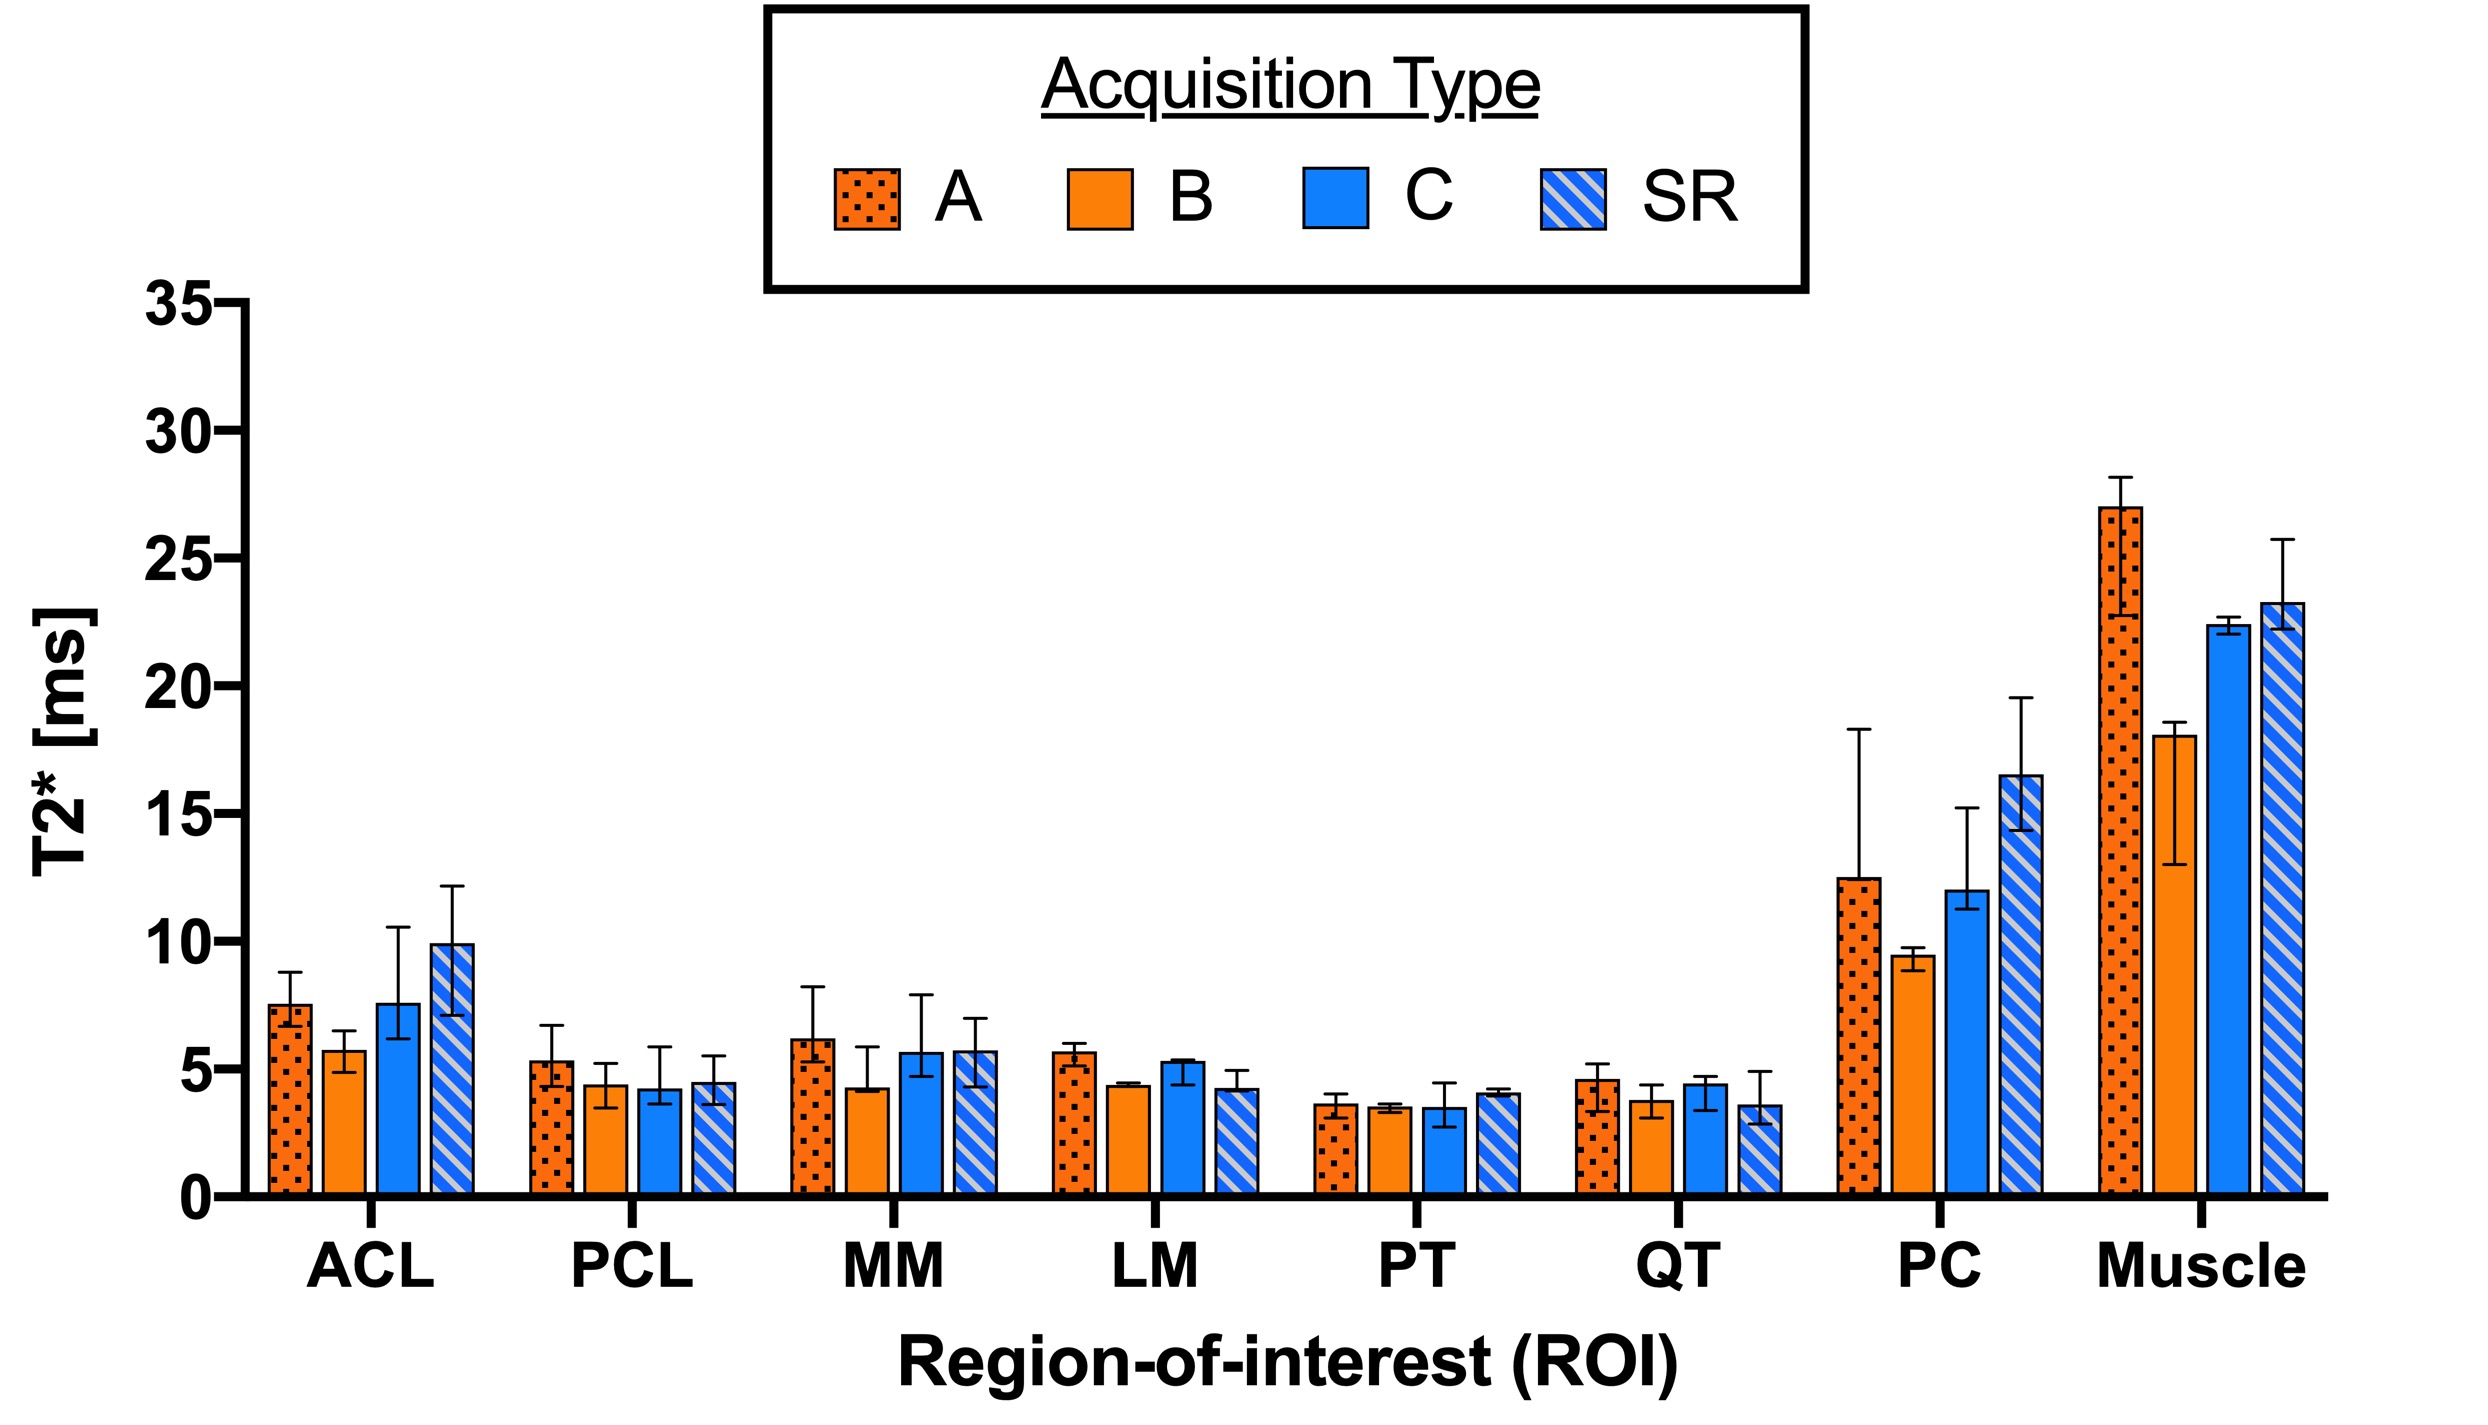
Regions-of-interest (ROIs) were obtained for each acquisition type for eight structures: anterior cruciate ligament, posterior cruciate ligament, patellar tendon, quadriceps tendon, medial and lateral menisci, patellar cartilage and medial gastrocnemius muscle. All ROIs were verified by an MSK radiologist. Medians and ranges of median ROI T2* values were computed for all acquisition types.
Results
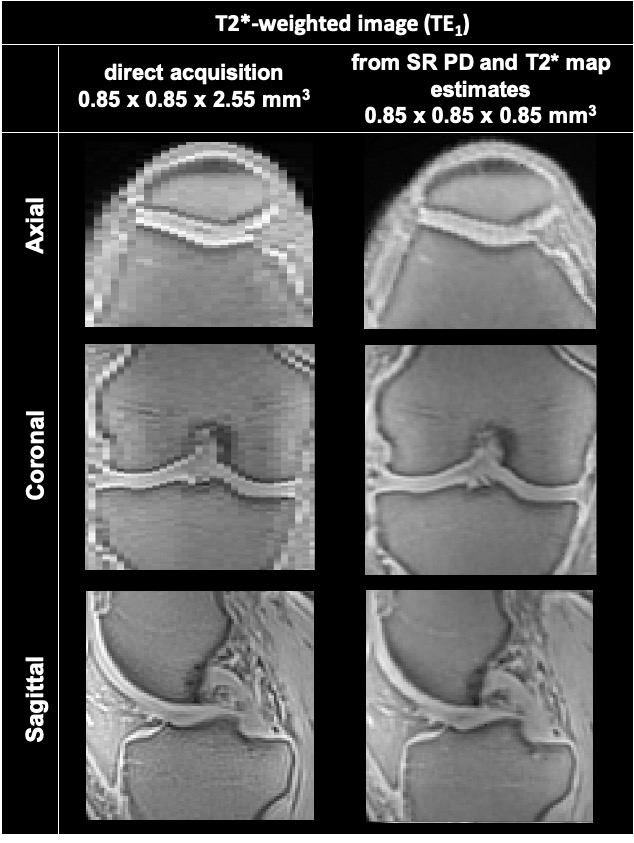
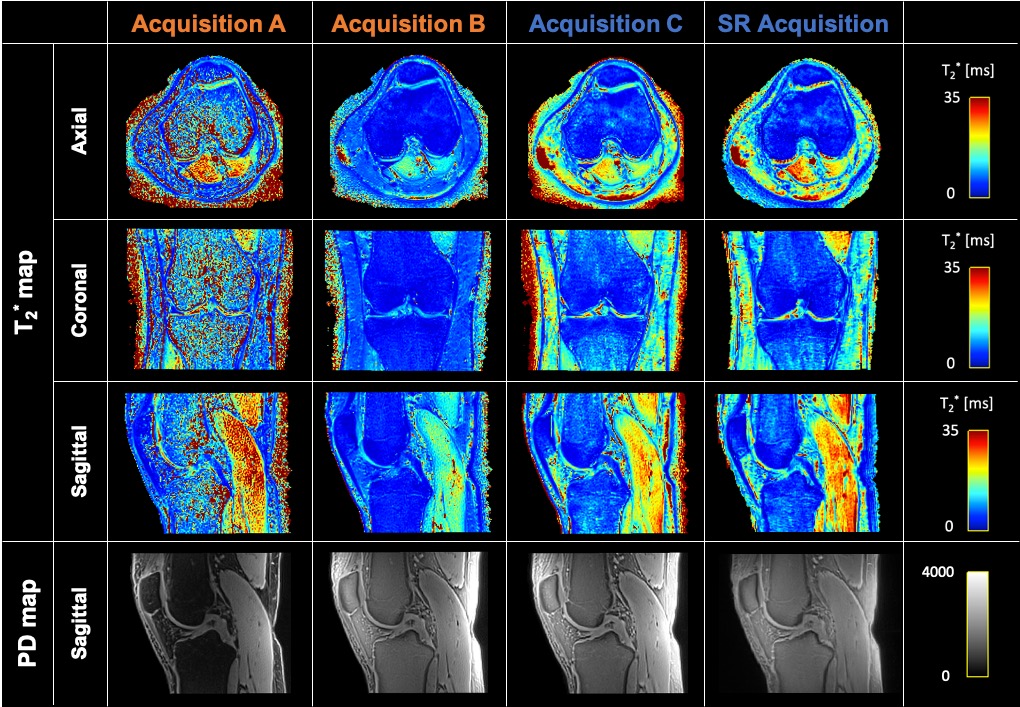
The super-resolving power of the presented model-based super-resolution technique is illustrated in Figure 2.Figure 3 displays representative T2* and PD maps from one volunteer corresponding to the 4 presented acquisitions (A, B, C and super-resolution). Acquisition A provides T2* maps with a noisy appearance and overall higher values than acquisition B, which displays the lowest T2* values overall. Acquisition C and super-resolution provide similar T2* maps.
Figure 4 represents the medians and corresponding ranges of median ROI T2* values computed for all acquisitions. Overall, median T2* values of acquisition C and super-resolution are comparable, while acquisition B seems to underestimate T2* values in long T2* structures, such as muscle. Compared to acquisition B, acquisition A shows increased T2* estimates in all structures.
Discussion and Conclusion
This study is the first to perform super-resolution reconstructions of T2*-weighted UTE MRI for HR T2* mapping of knee structures and demonstrates its comparability to direct 3D UTE T2* mapping.Super-resolution UTE T2* mapping provides T2* estimates that are comparable to results obtained with direct 3D UTE T2* mapping, while requiring approximately 25% less acquisition time. However, a higher number of volunteers is required to statistically compare both methods.
The presented model-based super-resolution method can be further optimized by including more TEs per rotated acquisition without considerably increasing scan time, allowing for increased accuracy and precision, as well as for future bi-exponential analysis.5
Super-resolution UTE T2* mapping thus shows great promise for HR T2* mapping of knee structures within reasonable scan time.
Acknowledgements
This project received funding from the EU H2020 MSCA (No 764513), and the Industrial Research Fund of the Antwerp University Association. The authors thank Thomas Benkert and Josef Pfeuffer from Siemens Healthineers for their technical support.References
1. de Mello R, Ma Y, Ji Y, et al. Quantitative MRI musculoskeletal techniques: an update. AJR. 2019;213:524-533.
2. Chang EY, Du J, Chung CB. UTE imaging in the musculoskeletal system. J. Magn. Reson. Imaging. 2015;41(4):870-883.
3. Williams A, Qian Y, Bear D, et al. Assessing degeneration of human articular cartilage with ultra-short echo time (UTE) T2* mapping. Osteoarthritis and Cartilage. 2010;18:539-546.
4. Chu C, Williams A. Quantitative MRI UTE-T2* and T2* show progressive and continued graft maturation over 2 years in human patients after anterior cruciate ligament reconstruction. OJSM. 2019;7(8).
5. Breda S, Poot D, Papp D, et al. Tissue-specific T2* biomarkers in patellar tendinopathy by subregional quantification using 3D ultrashort echo time MRI. J. Magn. Reson. Imaging. 2020;52(2):420-430.
6. Van Steenkiste G, Poot D, Jeurissen B, et al. Super-resolution T1 estimation: Quantitative high resolution T1 mapping from a set of low resolution T1-weighted images with different slice orientations. Magn. Reson. Med. 2017;77:1818-1830.
7. Bano W, Piredda G, Davies M, et al. Model-based super-resolution reconstruction of T2 maps. Magn. Reson. Med. 2020;83(3):906-919.
8. Qian Y, Boada FE. Acquisition-weighted stack of spirals for fast high-resolution three-dimensional ultra-short echo time MR imaging. Magn. Reson. Med. 2008;60:135-145.
9. Mugler JP, Fielden SW, Meyer CH, et al. Breath-hold UTE lung imaging using a stack-of-spirals acquisition. Proc. Intl. Soc. Mag. Reson. Med. 2015;23(1476).
10. Lustig M, Pauly JM. SPIRiT: iterative self-consistent parallel imaging reconstruction from arbitrary k-space. Magn. Reson. Med. 2010;64:457-471.
11. Kim J, Lartey R, Liu K, et al. Comparison of radial and spiral UTE MRI and T2* quantification of the knee joint. Proc. Intl. Soc. Mag. Reson. Med. 2019;27(1393).
12. Smekens C, Vanhevel F, Jeurissen B, et al. Short T2* quantification of knee structures based on accelerated UTE Spiral VIBE MRI with SPIRiT reconstruction. Proc. Intl. Soc. Mag. Reson. Med. 2020;28(2687).
13. Klein S, Staring M, Murphy K, et al. Elastix: a toolbox for intensity‐based medical image registration. IEEE Trans Med Imaging. 2010;29:196‐205.
14. Wu M, Zhao W, Wan L, et al. Quantitative three-dimensional ultrashort echo time cones imaging of the knee joint with motion correction. NMR in Biomed. 2020;33:e4214.
15. Beirinckx Q, Ramos-Llordén G, Jeurissen B et al., Joint Maximum Likelihood Estimation of Motion and T1 Parameters from Magnetic Resonance Images in a Super-resolution Framework: a Simulation Study. Fundamenta Informaticae 2020;172:105-128.
16. Beirinckx Q, Jeurissen B, Verhoye M et al. Super-resolution T1 mapping with integrated motion compensation in a joint maximum likelihood framework, 36th Annual Scientific Meeting of the European Society for Magnetic Resonance in Medicine & Biology (ESMRMB). Rotterdam, The Netherlands. Magn Reson Mater Phy (2019) 32 (Suppl. 1), no. S14.05
Figures
SPIRiT: Iterative parallel image reconstruction algorithm.10