3307
CUTE: Compressed Sensing UTE for Multi-Echo T2* Mapping1Siemens Healthcare, Zurich, Switzerland, 2Swiss Center for Musculoskeletal Imaging (SCMI), Balgrist Campus, Zurich, Switzerland, 3Advanced Clinical Imaging Technology (ACIT), Siemens Healthcare, Lausanne, Switzerland, 4Department of Radiology, Lausanne University Hospital (CHUV), Lausanne, Switzerland, 5LTS5, École Polytechnique Fédérale de Lausanne, Lausanne, Switzerland, 6University of Zurich, Zurich, Switzerland
Synopsis
Clinical application of UTE (ultrashort echo time) sequences in musculoskeletal studies remains limited, despite their potential to unveil quantitative short-T2* information of e.g. tendons or ligaments. The major shortcoming of quantitative mapping is the considerably longer scan time compared to conventional, anatomical imaging sequences. We investigated the feasibility and use of an isotropic 3D radial compressed sensing UTE (CUTE) prototype sequence for quantitative mapping of short-T2* components in the knee. Similar image quality and T2* values were obtained for non-accelerated and accelerated acquisitions. Thus, CUTE sequences show great promise for fast and clinically feasible UTE T2* mapping.
Introduction
Transverse water-proton magnetization in densely packed tissues, such as ligament, tendon, and cortical bone, exhibits fast T2* decay due to slow molecular re-orientation and long correlation times. Sequences with center-out sampling trajectories and ultra-short echo times (UTE) can still detect a signal from rapidly decaying T2* tissue. Acquisition of multiple echoes allows for quantification of short and ultra-short relaxation times. Thus, UTE-type sequences potentially allow for exploration and investigation of early changes in tissue structure or composition, which might be indicative of pathologies such as tendon or meniscal degeneration1 or osteoarthritis2. UTE sequences have also been used to monitor treatment progression after anterior cruciate ligament repair or replacement3.However, the validation of T2* mapping sequences that are also able to quantify short-T2* times remains limited, possibly due to the increased scan time in comparison to conventional imaging sequences and the need for gradient calibration4 if non-cartesian k-space sampling trajectories are used.
The aim of this study was to explore the potential of an isotropic 3D radial UTE prototype sequence in combination with a compressed sensing reconstruction for the quantification of short-T2* values of the knee within a clinically acceptable scan time.
Materials and Methods
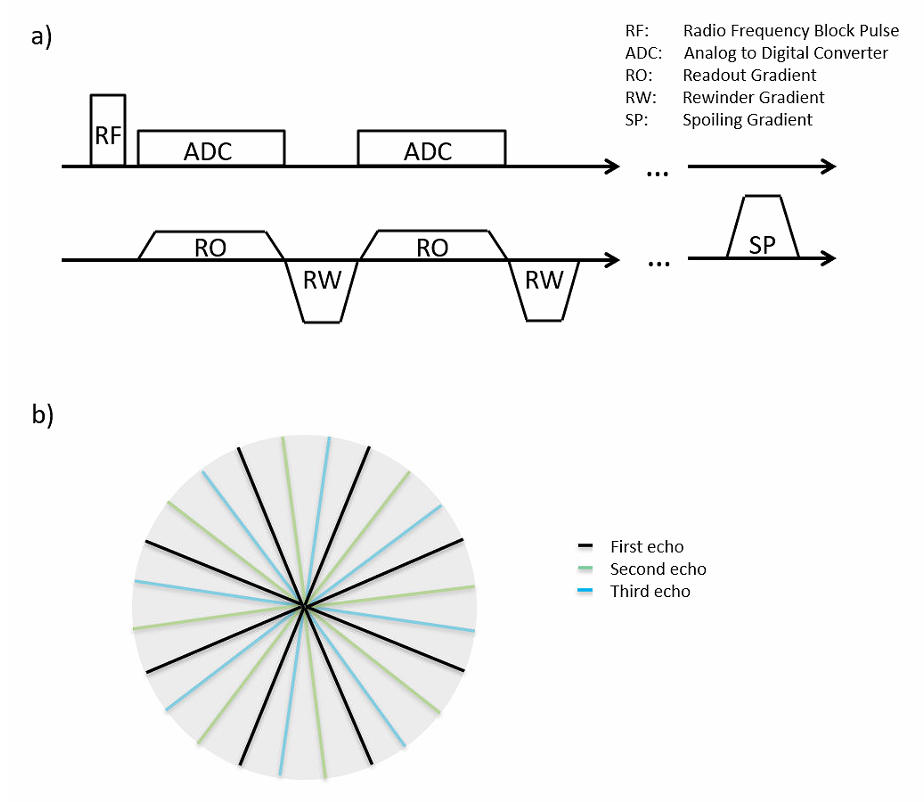
Experiments were performed on a 3T whole-body MR scanner (MAGNETOM Prisma, Siemens Healthcare, Erlangen, Germany) equipped with a 1Tx/15Rx-channel knee coil (QED, Quality Electrodynamics, Mayfield Village, OH, USA).Isotropic 3D UTE imaging was performed with a prototype sequence that acquired data in 5 consecutive radial center-out spokes (echoes), each followed by a rewinder gradient. Each spoke was acquired with a unique, slightly rotated orientation in k-space. A schematic of the sequence diagram and readout trajectory is shown in Figure 1. Multi-echo UTE data was acquired in the knee of a healthy volunteer with 3 different sets of 24’000 (R=1), 12’000 (R=2) and 6’000 (R=4) spokes and with corresponding acquisition times of 5:24, 2:42 and 1:21 [min:sec], respectively. The remaining parameters were identical for the three acquisitions: TR/TE 13.5/[0.04, 2.46, 4.91, 7.38, 9.84] ms, flip angle: 5°, matrix: 256, FoV: 160x160x160mm3, isotropic voxel size: 0.6mm, bandwidth: 1220Hz/px, RF-pulse duration: 40µs, dead time between RF and ADC: 10µs.
Prior to data gridding, the k-space trajectory was corrected for gradient imperfections using a gradient impulse response model4. The accelerated datasets (R=2, R=4) were reconstructed by an iterative compressed sensing approach5,6. The algorithm splits the problem to alternately solve data-consistency and enforce sparsity by soft-thresholding after a 3D wavelet transformation7. Regularization parameters were tuned manually.
Finally, R2* and M0 maps were estimated by a mono-exponential, nonlinear least‐squares fit for all datasets. Mean and standard deviation of T2* were calculated in ROIs (region of interest) placed in the tibial and femoral bone marrow, vastus lateralis and medialis muscle, and patellar tendon, respectively.
Results
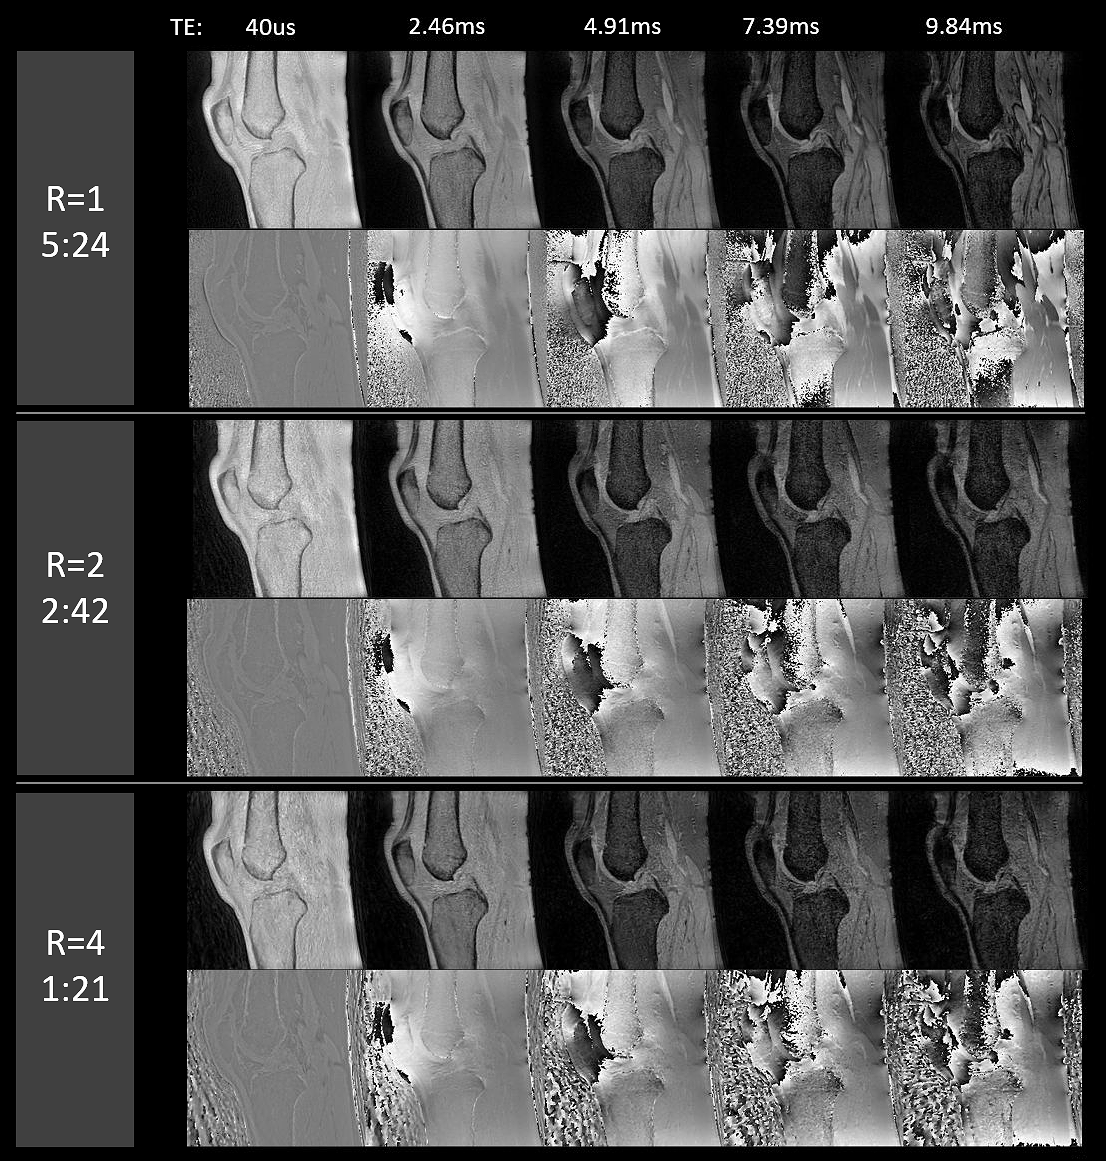
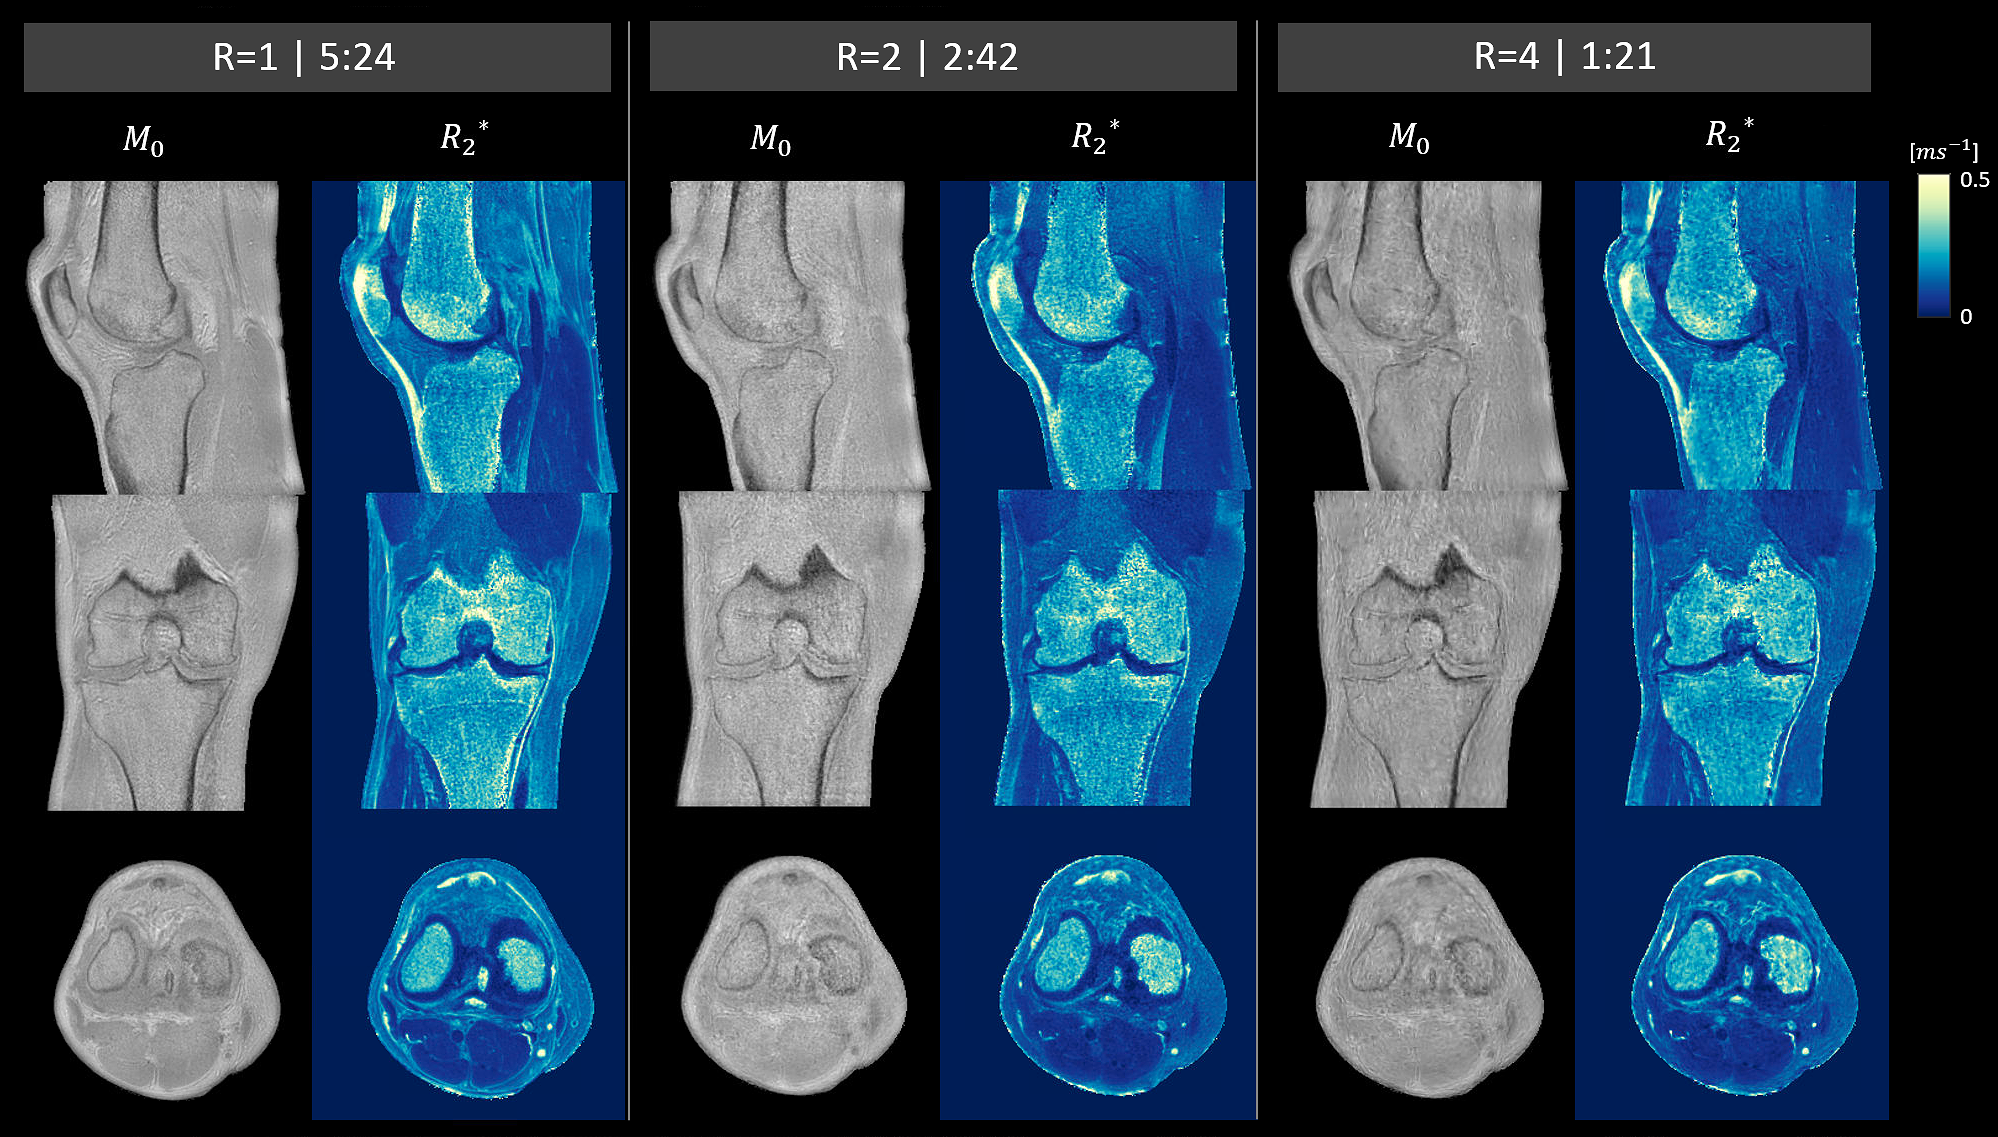
Figure 2 shows sagittal magnitude and phase images for all 5 echoes from the fully sampled (R=1), twice (R=2) and four-fold (R=4) under-sampled data sets. While the twice under-sampled datasets were visually comparable to the full reference scans a lower SNR was observed for R=4, especially in the later echoes.Figure 3 depicts the fitting results (M0 and R2*) in three orthogonal image planes for the three acquisitions (R=1, 2 and 4). All three data sets allowed for successful delineation of fine structures such as the medial collateral ligament. A prominent difference was an underestimation of cortical-bone R2* in both under-sampled datasets compared to the fully sampled dataset.
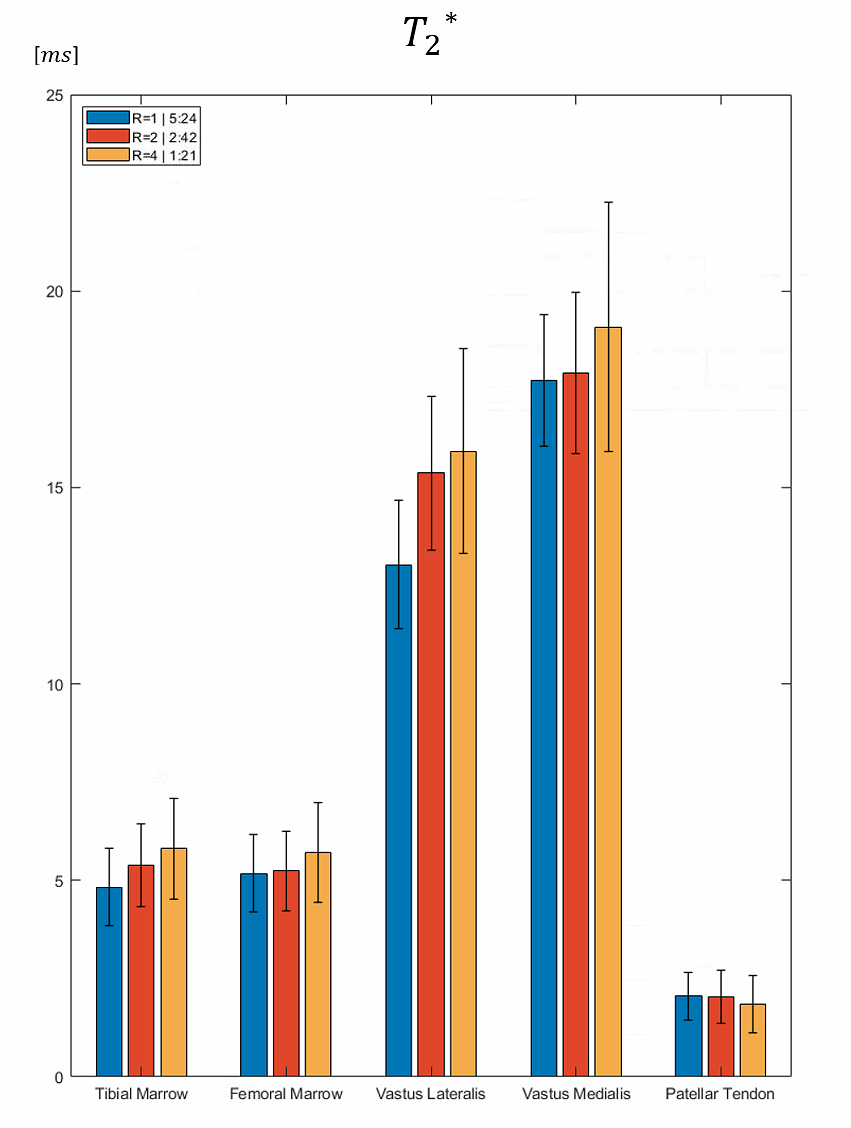
Figure 4 summarizes mean T2* value and standard deviation in different ROIs for R=1, 2 and 4. Relaxation times were in good agreement with literature and only minor discrepancies between different acquisitions were detected.
Discussion
Compressed sensing allows for under-sampling by a factor of 2-4 without detrimental loss in image quality. However, in areas with low signal intensities and very short-T2* (e.g. cortical bone), the SNR-loss introduced a bias into parts of the quantitative maps. A limitation of this study was the mono-exponential T2* decay model. Gained scan efficiency could be used to measure more echoes, which might allow for more sophisticated relaxation models such as multi-compartment fits.It is also important to keep in mind that anisotropic structures like tendons and ligaments exhibit orientation-dependent T2* values due to the magic-angle effect, as presumably apparent in Fig 2., where the R2* values of the quadriceps tendon close to the patella are decreased in comparison to the rest of the tendon.
Conclusion
CUTE has the potential to bring a quantitative assessment of short-T2* species into the realm of clinical feasibility. It allows an efficient generation of UTE images, proton-density and T2* maps, which could enable a grading and assessment of early degenerative and other pathological processes in e.g. tendons, ligaments or menisci.Acknowledgements
No acknowledgement found.References
1. Breda, S. J. et al. Tissue-Specific T2* Biomarkers in Patellar Tendinopathy by Subregional Quantification Using 3D Ultrashort Echo Time MRI. J. Magn. Reson. Imaging 52, 420–430 (2020).
2. Titchenal, M. R. et al. Cartilage Subsurface Changes to Magnetic Resonance Imaging UTE-T2* 2 Years After Anterior Cruciate Ligament Reconstruction Correlate With Walking Mechanics Associated With Knee Osteoarthritis. Am. J. Sports Med. 46, 565–572 (2018).
3. Chu, C. R. & Williams, A. A. Quantitative MRI UTE-T2* and T2* Show Progressive and Continued Graft Maturation Over 2 Years in Human Patients After Anterior Cruciate Ligament Reconstruction. Orthop. J. Sport. Med. 7, (2019).
4. Vannesjo, S. J. et al. Image reconstruction using a gradient impulse response model for trajectory prediction. Magn. Reson. Med. 76, 45–58 (2016).
5. Lustig, M., Donoho, D. & Pauly, J. M. Sparse MRI: The application of compressed sensing for rapid MR imaging. Magn. Reson. Med. 58, 1182–1195 (2007).
6. Donoho, D. L. Compressed sensing. IEEE Trans. Inf. Theory 52, 1289–1306 (2006).
7. Huang, F. et al. A rapid and robust numerical algorithm for sensitivity encoding with sparsity constraints: Self-feeding sparse SENSE. Magn. Reson. Med. 64, 1078–1088 (2010).
Figures