3306
Feasibility of high resolution quantitative magnetic resonance imaging using variable flip angle and spoiling phase angle1Diagnostic and Interventional Imaging, University of Texas Health Science Center at Houston, Houston, TX, United States, 2UIH America Inc., Houston, TX, United States
Synopsis
We developed a multi-flip multi-spoiling phase angle method for quantitative assessment of tissue parameters. Application in phantom studies and in vivo knee imaging shows promising performance for high resolution parameter mapping in clinically feasible scan time.
Introduction
Quantitative measurement of tissue parameters remains one of the most active research areas in MRI.1–3 Imaging protocols to quantify T1, T2, and other tissue parameters such as the macromolecular pool fraction and exchange rates are often time-consuming or require special pulse sequences not available on clinical scanners1. We investigated the feasibility of quantitative imaging using a simple protocol based on radiofrequency (RF)-spoiled gradient echo (SPGR) pulse sequence, commonly available on MRI scanners. The proposed protocol collects a set of gradient echo acquisitions with variable flip angle and RF spoiling phase increment. Each acquisition establishes a distinct steady state signal pathway with different weighting of tissue parameters.3 Reconstruction is achieved by signal modelling of these signal pathways. The short repetition times allows the acquisition of high-resolution data within a clinically feasible scan time. The feasibility of the proposed approach is demonstrated in phantom and human knee imaging experiments.Methods
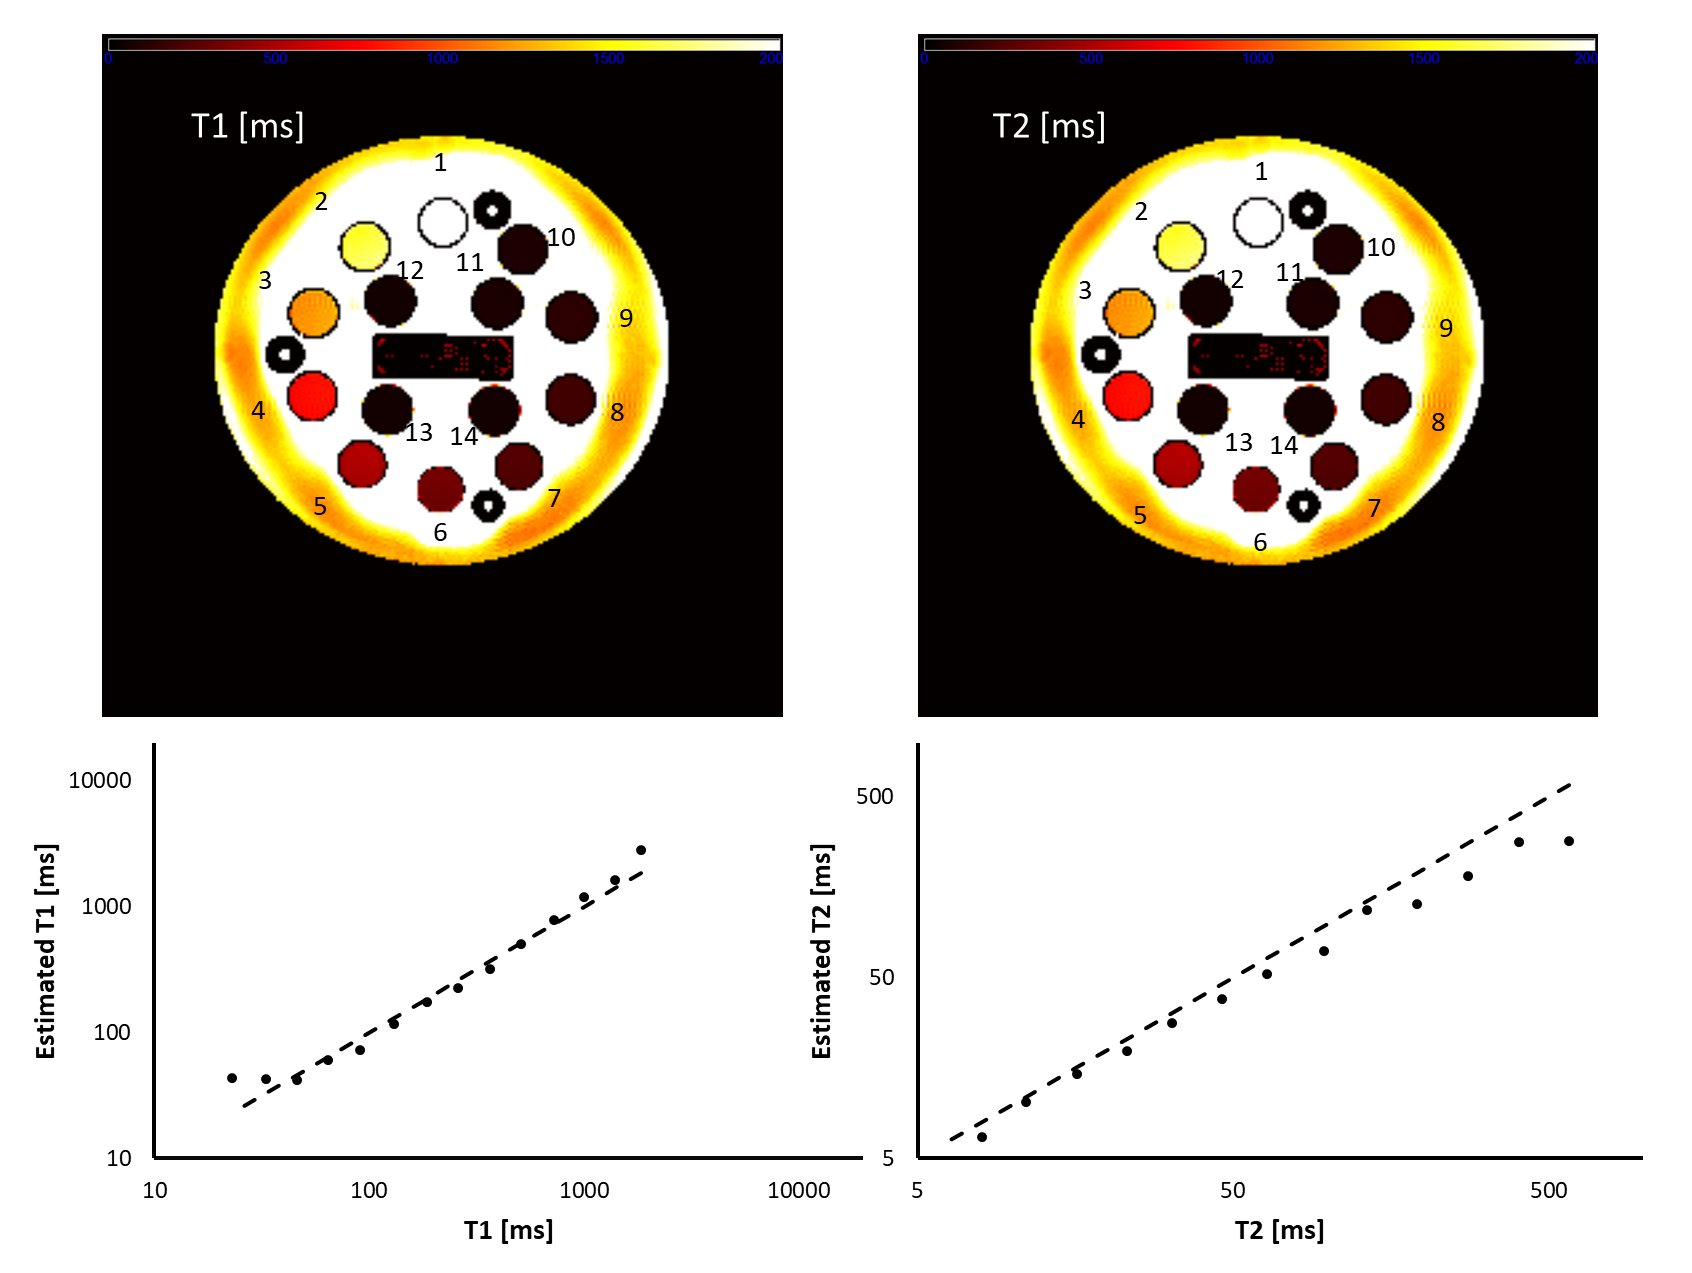
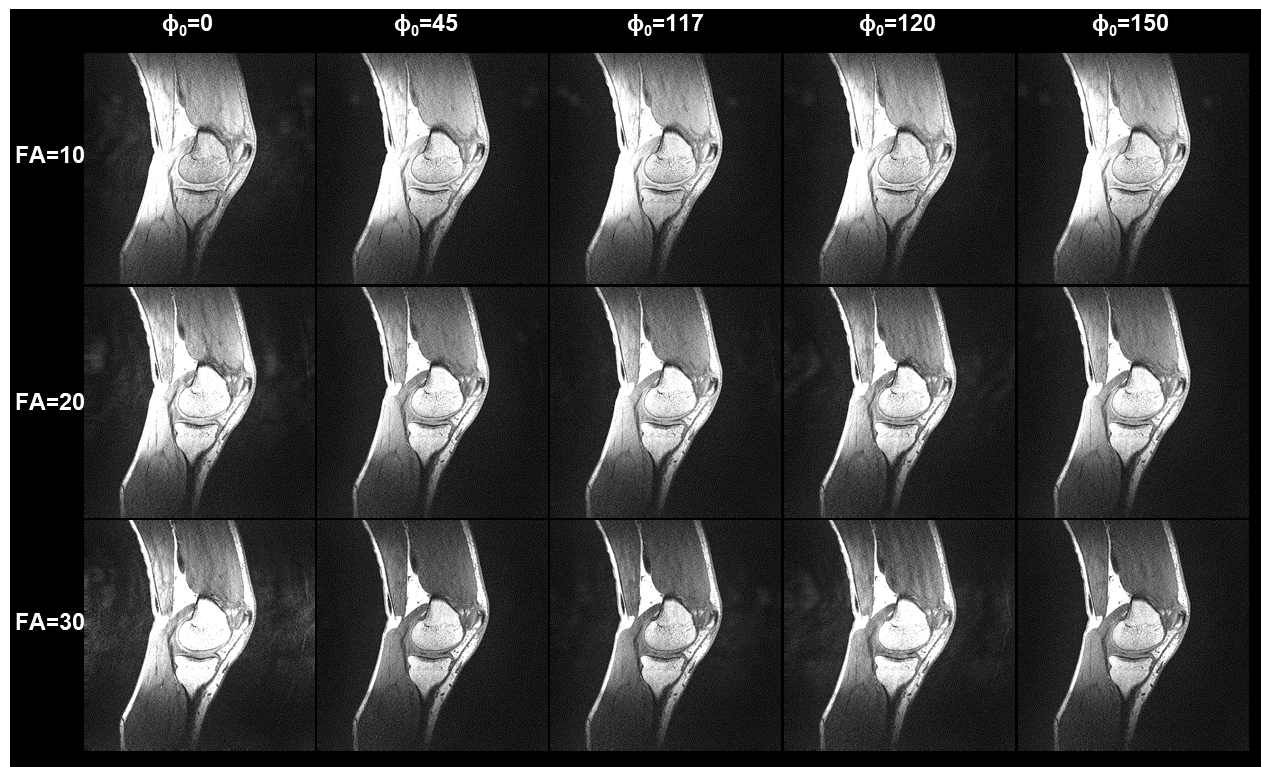
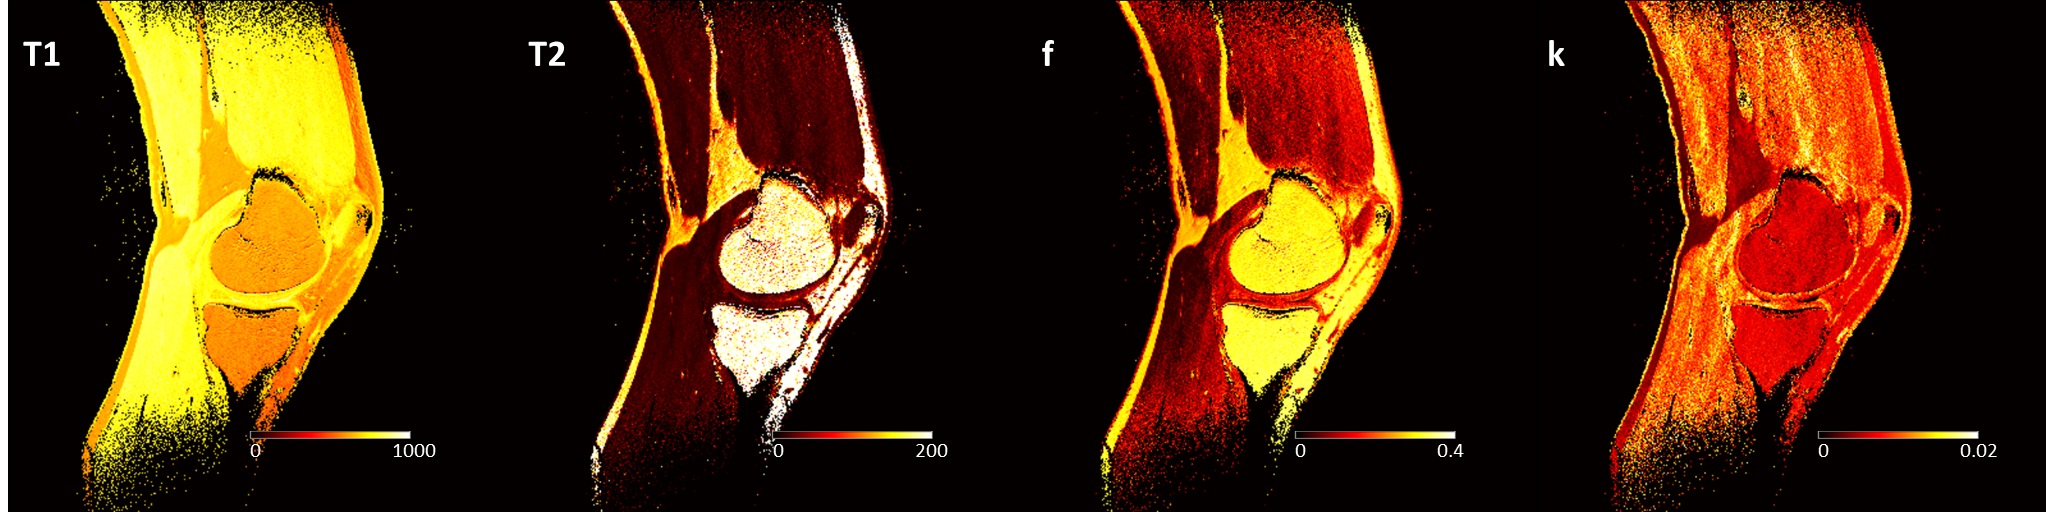
Imaging protocol. A total of 15 3D RF-spoiled gradient echo acquisitions were acquired with TR/TE = 7/3 ms and all combinations of three flip angles (10°, 20°, and 30°) and five RF spoiling phase increments (0°, 45°, 117°, 120°, and 150°). Using this protocol, the NIST phantom containing various spheres filled with solutions with a wide range of T1 and T2 values4 was scanned on a 3T scanner (uMR790, United Imaging Healthcare, Houston, TX) with FOV=256×256×180 mm3, voxel dimensions=1x1x3 mm3. A sagittal 3D knee (FOV=256×255×120 mm3, voxel dimensions=0.64x0.64x2 mm3) scan was acquired in a healthy volunteer (M, 34yo) with the same acquisition parameters on a 1.5T scanner (uMR 570, UIH). Each 3D volume was acquired in 106.8 and 91.2 seconds in the phantom and knee scans, respectively. For the knee scan, T1 and T2 maps were additionally acquired using a multi flip angle (TR/TE=9.2/4.3 ms, FA=4, 9, 15, and 25 degrees) and 5-echo CPMG (TR=1503 ms, ΔTE= 13.8 ms) sequences.Image analysis. Dictionaries for a range of tissue parameters were built using simulations based on the extended phase graph method using the EPG-X toolbox5 employing two models: (1) a single compartment model with a range of T1 and T2 values; and (2) a two-compartment model with magnetization transfer (MT) effect. The simulated parameters for the two-compartment model included different combinations of T1 and T2 values for the free water pool (T1f, T2f) and for the fraction of the semi-solid pool (f) and exchange rate constant (k). Model fitting was performed using Matlab (v2017b; MathWorks, Natick, MA). For the NIST phantom, the T1 and T2 values were compared with the standard values of the T1- and T2-spheres. Reference knee T1 and T2 maps were generated by fitting standard spoiled gradient echo and spin echo signal equations. Regions of interest were manually drawn in the cartilage and muscle regions.
Results
In the NIST phantom, the estimated T1 and T2 values for the T1- and T2-spheres show good agreement with the known values of the phantom, as shown in Fig. 1. Fig. 2 shows representative images acquired with the proposed protocol in the human knee. The reconstructed maps for T1f, T2f, f, and k are shown in Fig. 3. ROI analysis of the cartilage / muscle yielded T1f = 718±135 / 790±39 ms, T2f = 35.2±38.9 / 19.0±7.5 ms, f = 0.15±0.07 / 0.08±0.04, and k = 8.8±3.6 / 10.4±3.4 s-1. The reference T1 and T2 values for cartilage / muscle were 795±53 / 795±59 ms and 30.7±48.2 / 29.7±46.0 ms, respectively. The tissue parameters were comparable to reported values in the literature.6–9Conclusion
The proposed approach allows high-resolution quantitative mapping of the tissue parameters in a clinically acceptable scan time. A major feature of the proposed method is the easy implementation on most MRI systems without the need for programming the scanner. Our results demonstrated the feasibility of single- and two-compartment modeling of the signal behavior using this approach. Optimization of the acquisition schemes will be explored to obtain higher efficiency and signal to noise ratio in tissue parameters.Acknowledgements
We thank Jian Xu for assistance in conducting the MRI experiments.References
(1) Hilbert, T.; Xia, D.; Block, K. T.; Yu, Z.; Lattanzi, R.; Sodickson, D. K.; Kober, T.; Cloos, M. A. Magnetization Transfer in Magnetic Resonance Fingerprinting. Magn. Reson. Med. 2020, 84 (1), 128–141.
(2) Deoni, S. C. L.; Peters, T. M.; Rutt, B. K. High-Resolution T1 and T2 Mapping of the Brain in a Clinically Acceptable Time with DESPOT1 and DESPOT2. Magn. Reson. Med. An Off. J. Int. Soc. Magn. Reson. Med. 2005, 53 (1), 237–241.
(3) Bieri, O.; Scheffler, K.; Welsch, G. H.; Trattnig, S.; Mamisch, T. C.; Ganter, C. Quantitative Mapping of T2 Using Partial Spoiling. Magn. Reson. Med. 2011, 66 (2), 410–418.
(4) Russek, S. E.; Boss, M.; Jackson, E. F.; Jennings, D. L.; Evelhoch, J. L.; Gunter, J. L.; Sorensen, A. G. Characterization of NIST/ISMRM MRI System Phantom. In Proceedings of the 20th Annual Meeting of ISMRM, Melbourne, Australia; 2012; p 2456.
(5) Malik, S. J.; Teixeira, R. P. A. G.; Hajnal, J. V. Extended Phase Graph Formalism for Systems with Magnetization Transfer and Exchange. Magn. Reson. Med. 2018, 80 (2), 767–779.
(6) Stanisz, G. J.; Odrobina, E. E.; Pun, J.; Escaravage, M.; Graham, S. J.; Bronskill, M. J.; Henkelman, R. M. T1, T2 Relaxation and Magnetization Transfer in Tissue at 3T. Magn. Reson. Med. 2005, 54 (3), 507–512. https://doi.org/10.1002/mrm.20605.
(7) Louie, E. A.; Gochberg, D. F.; Does, M. D.; Damon, B. M. Transverse Relaxation and Magnetization Transfer in Skeletal Muscle: Effect of PH. Magn. Reson. Med. An Off. J. Int. Soc. Magn. Reson. Med. 2009, 61 (3), 560–569.
(8) Gold, G. E.; Han, E.; Stainsby, J.; Wright, G.; Brittain, J.; Beaulieu, C. Musculoskeletal MRI at 3.0 T: Relaxation Times and Image Contrast. Am. J. Roentgenol. 2004, 183 (2), 343–351.
(9) Gloor, M.; Scheffler, K.; Bieri, O. Nonbalanced SSFP-Based Quantitative Magnetization Transfer Imaging. Magn. Reson. Med. 2010, 64 (1), 149–156.
Figures