3305
Accelerated 3D-UTE-AFI B1 mapping to correct VFA-based T1 estimations in short T2* tissues1Medical Physics Group, Institute of Diagnostic and Interventional Radiology, Jena University Hospital - Friedrich Schiller University, Jena, Germany, 2Institute of Diagnostic and Interventional Radiology, Jena University Hospital - Friedrich Schiller University, Jena, Germany, 3Michael Stifel Center for Data-driven and Simulation Science Jena, Friedrich Schiller University, Jena, Germany, 4Abbe School of Photonics, Friedrich Schiller University, Jena, Germany, 5Center of Medical Optics and Photonics, Friedrich Schiller University, Jena, Germany
Synopsis
B1 mapping is a considerable challenge for T1 quantification, and it is especially difficult for short T2* species because only ultrashort echo-time (UTE) imaging sequences are able to retrieve signal in such tissues. Recently a method called Actual Flip Angle Imaging (AFI) has shown promising results because of its potential to be combined with UTE acquisition. However the AFI method is characterized by long acquisition times. In this work we propose to use undersampling to reduce the acquisition times of AFI-based B1 mapping.
Introduction
B1 inhomogeneities are one of the major causes of uncertainty in the quantification of the longitudinal relaxation parameter T1, because they affect the estimation of the flip angle value, which, in turn, results in erroneous T1 quantification results 1,2. For this reason, several different methods have been proposed to obtain a map of the B1 field. The B1 map is subsequently used to correct the values of the flip angle, thereby generating correct T1 estimations.However, most of the methods proposed in literature so far, are not applicable for a correction in tissues with short T2* (such as tendons or ligaments), because the signal from these species decays very rapidly. Only Ultrashort Echo-Time (UTE) sequences are able to retrieve signal in these areas 3. Recently, the so called Actual Flip Angle Imaging (AFI) 4,5,6 technique has been proposed as a promising method to generate B1 maps in such tissues 7, as it can be combined with an UTE acquisition. A major disadvantage of the AFI method is its prohibitively long acquisition times (TAs) due to the long TRs needed for the stability of the method.
This work uses AFI in combination with a Variable Flip Angle (VFA) T1 mapping approach and investigates the possibility of reducing TA by undersampling the 3D-radial-UTE k-space 8.
Methods
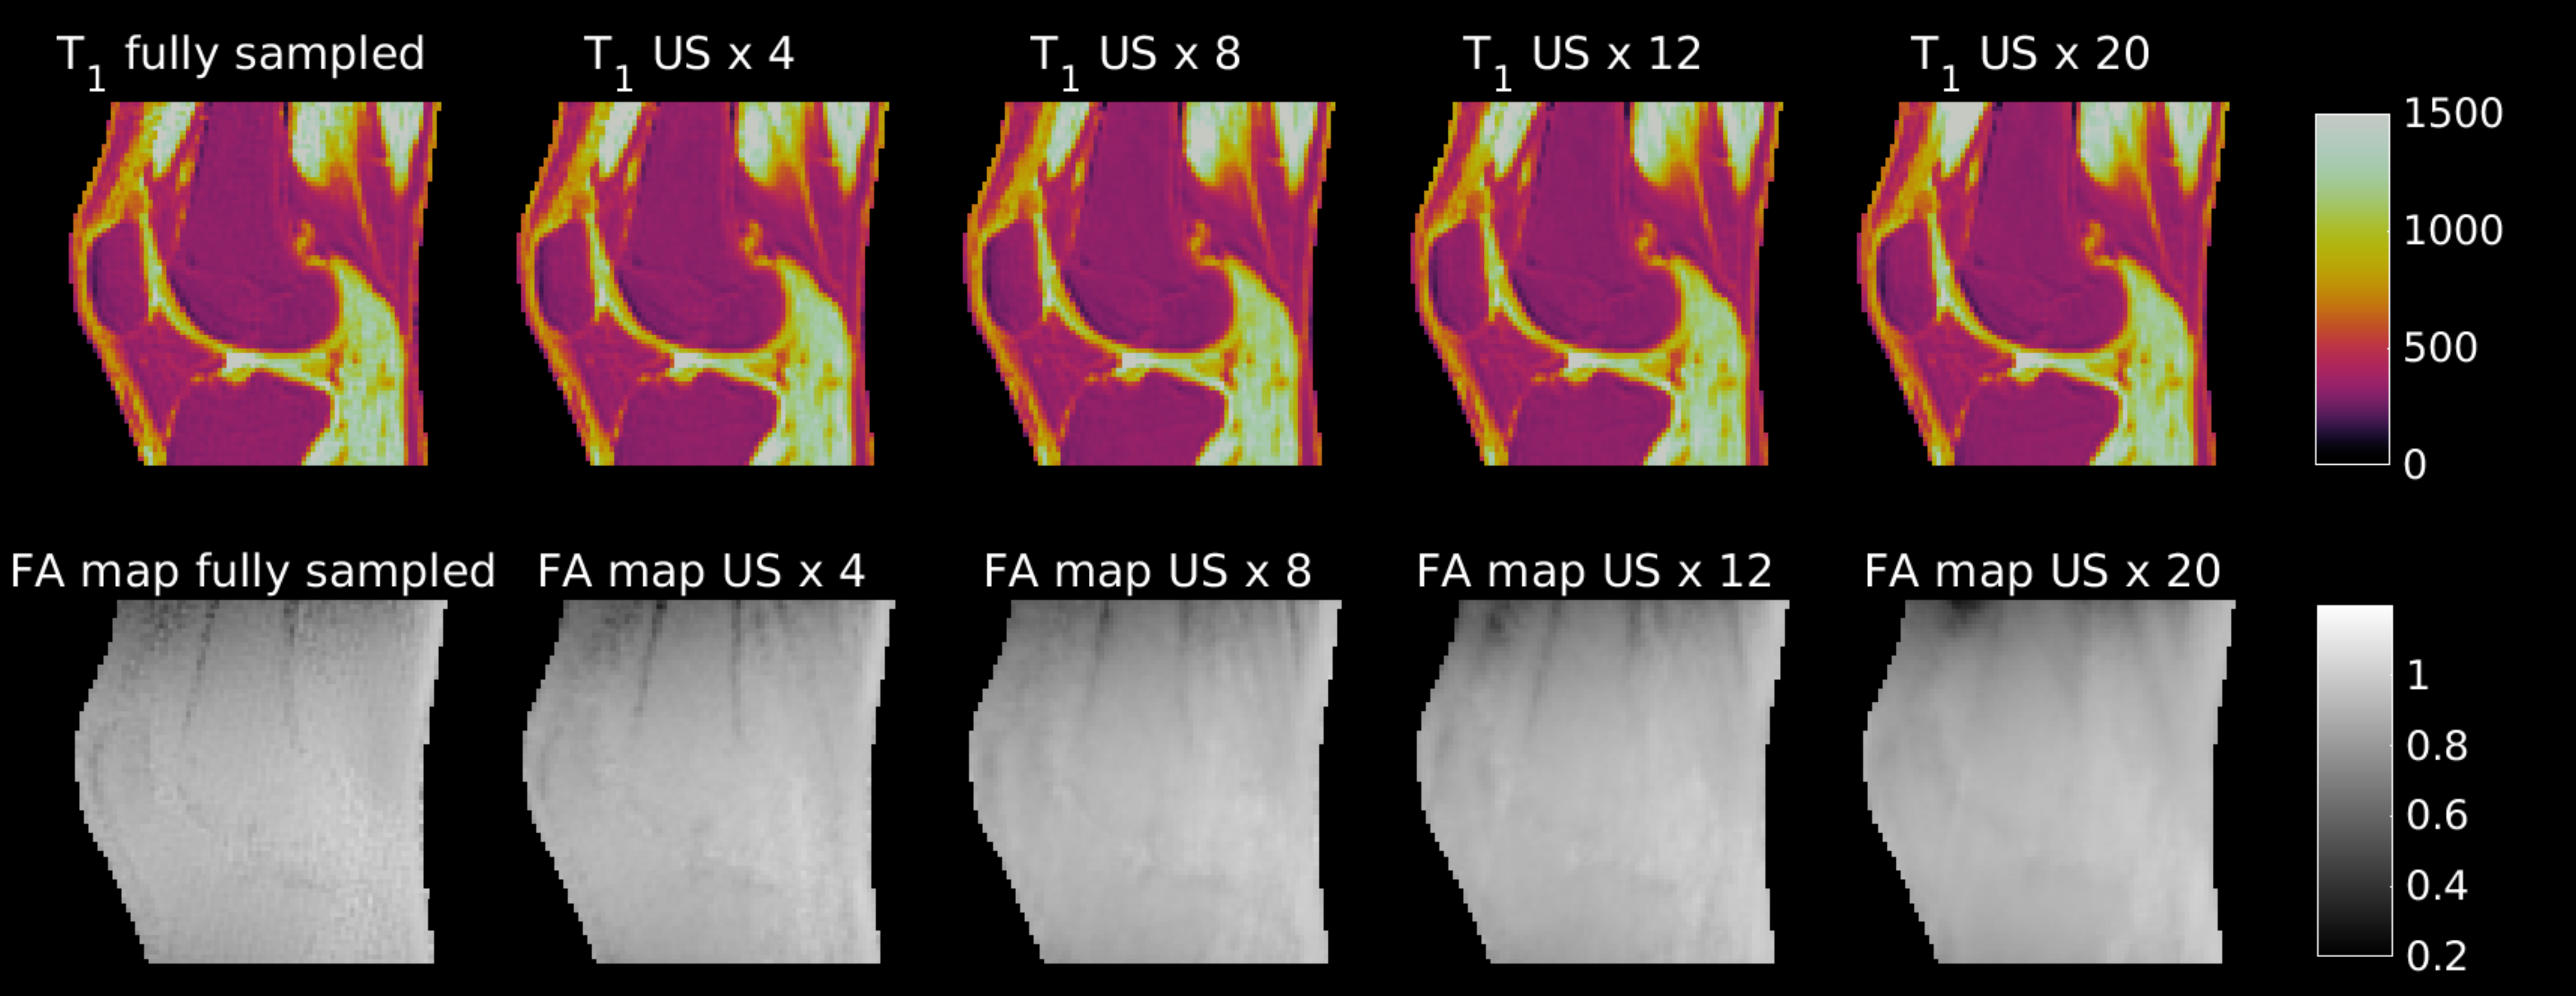
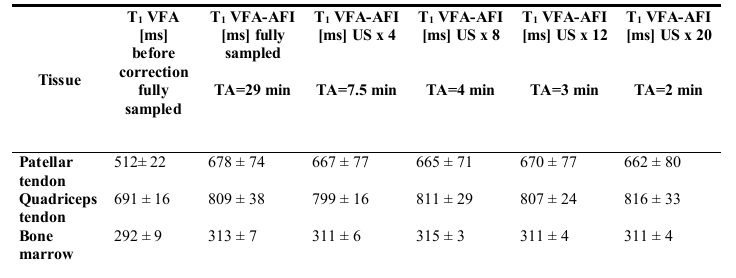
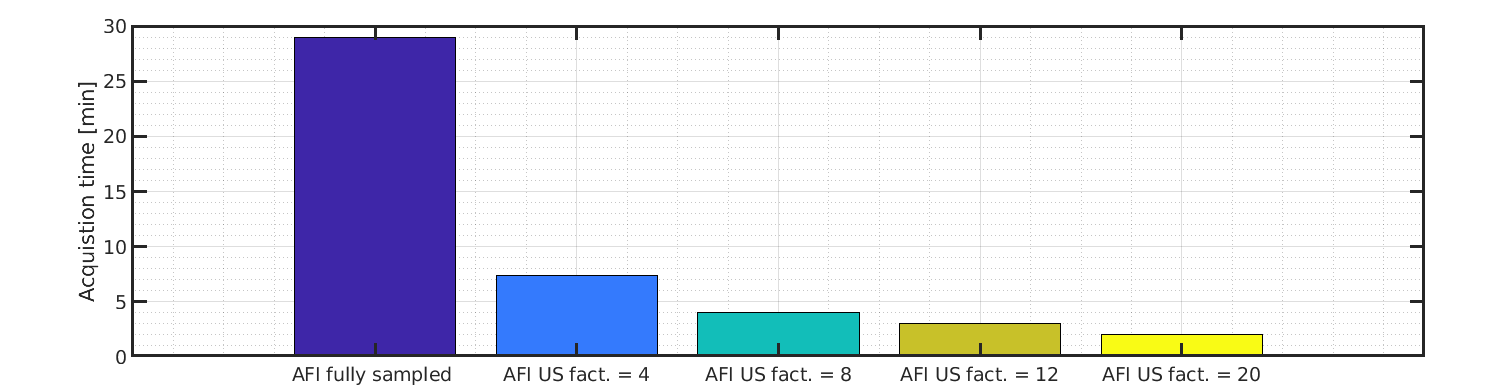
A 3D radial, center out UTE sequence with hard excitation pulse and TE 0.07 ms was used to acquire three 3D-UTE-VFA-AFI datasets (m. 24, 26 and 33 years old) of human knees in vivo on a clinical 3T whole-body MRI scanner (Magnetom PRISMA, Siemens Healthineers, Erlangen, Germany) using the vendor supplied single-channel transmit and receive knee coil. Other sequence parameters were: voxel size = (1.0 x 1.0 x 2.6) mm3, TAs = 13 min (VFA) and 30 min (fully sampled AFI). The two measurements used the same acquisition parameters apart from an AFI TR combination of TR1/TR2=15ms/75ms. The 3D-UTE-AFI measurement was repeated several times with increasing undersampling factors (4, 8, 12, 20) by acquiring only the fourth, eighth, twelfth and twentieth spoke of the 3D-radial-k-space. The datasets were regridded as part of the reconstruction algorithm. B1 maps obtained from the differently undersampled AFI acquisitions were used to correct a fully sampled VFA-based T1 map.Results
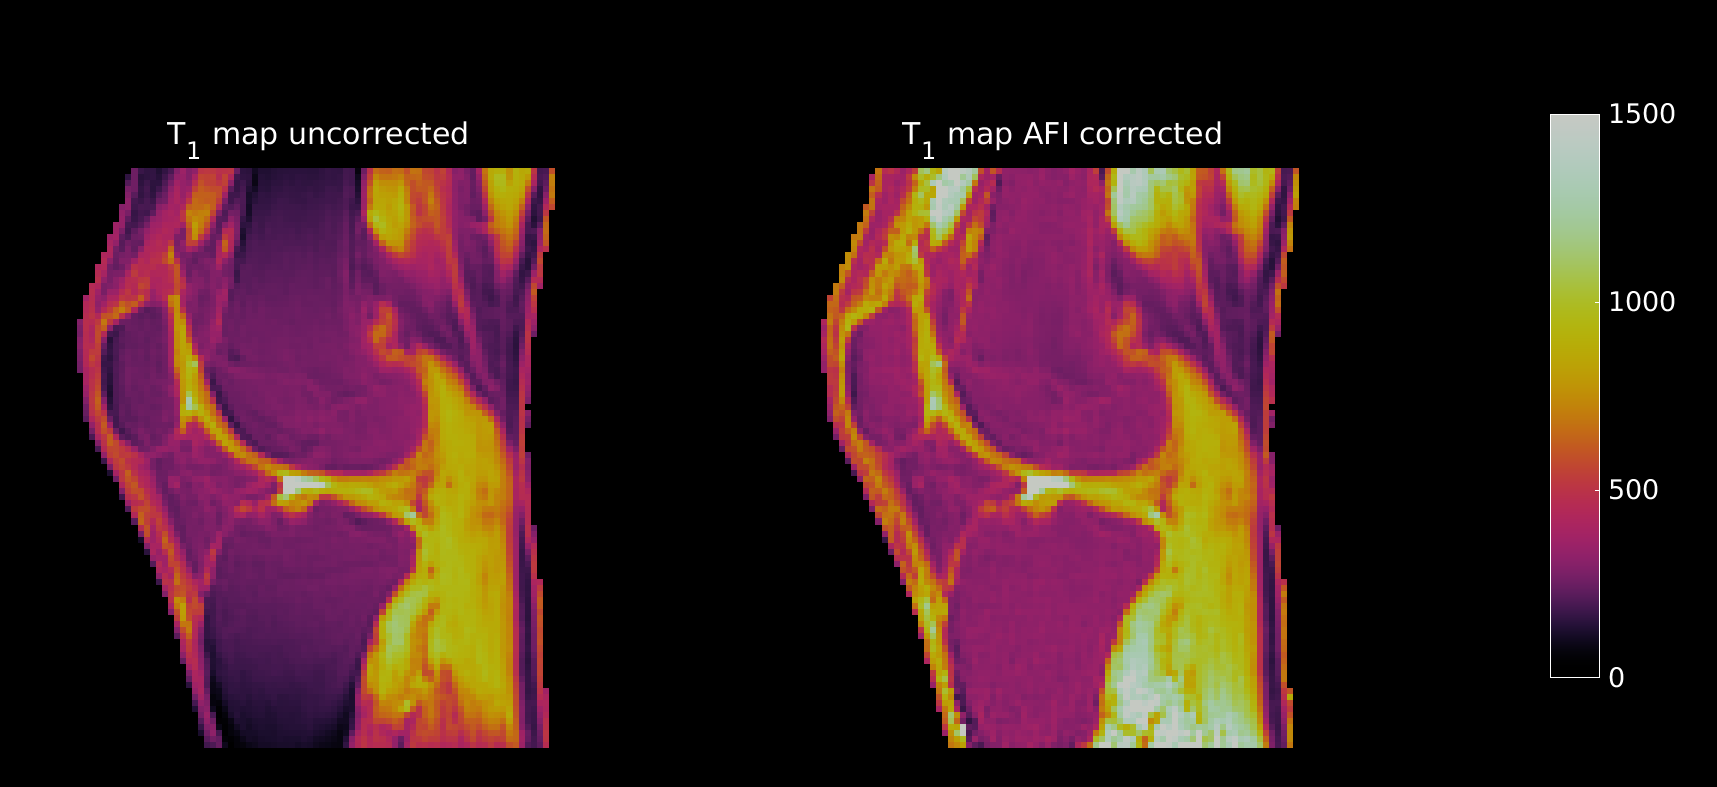
Fig. 1 shows the effect of the B1 correction for one exemplary T1 map. The uncorrected T1 map presents an unusual drop of signal towards the edges of the FoV, which is corrected by the use of the AFI-based B1 correction map. The differently undersampled B1 maps (Fig 2 bottom row) were used to correct the VFA dataset to generate T1 maps (Fig. 2 top row). All T1 maps derived from differently undersampled B1 maps (Fig. 2 top row) show consistent quantitative results for the longitudinal relaxation parameter. With all undersampling factors, including the largest US=20, the T1 values that were achieved (see Table 1), were consistent with literature 7,9,10 and within only a 3% error margin from the original (fully sampled) VFA-AFI map.Discussion and Conclusion
The proposed undersampled AFI method reduces the acquisition time of a UTE compatible B1 map from 30 min to 2 min as shown in Fig.3 and Table 1, thus allowing the acquisition of a complete AFI-corrected VFA-based T1 map in around 15 min. It can be speculated that the 3D radial acquisition scheme used in this work, combined with the generally smooth nature of B1 maps allowed for the use of the large undersampling factors. Furthermore, the proposed method is not limited to imaging applications of the knee or musculoskeletal system, but could be extended to other short T2* tissues as well (such as the cortical bone or skull), for which a method able to provide robust and fast B1 corrections for T1 estimation in combination with UTE acquisitions could be relevant.Acknowledgements
No acknowledgement found.References
1. Robson MD, Gatehouse PD, Bydder M, Bydder GM. Magnetic resonance: an introduction to ultrashort TE (UTE) imaging. J Comput Assist Tomogr. 2003;27(6):825-46. doi: 10.1097/00004728-200311000-00001. PMID: 14600447.
2. Boudreau M, Tardif CL, Stikov N, Sled JG, Lee W, Pike GB. B1mapping for bias-correction in quantitative T1 imaging of the brain at 3T using standard pulse sequences. J Magn Reson Imaging 2017;46:1673–82. https://doi.org/10.1002/jmri.25692.
3. Stikov N, Boudreau M, Levesque IR, Tardif CL, Barral JK, Pike GB. On the accuracy of T1mapping: Searching for common ground. Magn Reson Med 2015;73:514–22. https://doi.org/10.1002/mrm.25135.
4. Yarnykh VL. Actual flip-angle imaging in the pulsed steady state: A method for rapid three-dimensional mapping of the transmitted radiofrequency field. Magn Reson Med 2007;57:192–200. https://doi.org/10.1002/mrm.21120.
5. Nehrke K. On the steady-state properties of actual flip angle imaging (AFI). Magn Reson Med 2009;61:84–92. https://doi.org/10.1002/mrm.21592.
6. Yarnykh VL. Optimal radiofrequency and gradient spoiling for improved accuracy of T1 and B1 measurements using fast steady-state techniques. Magn Reson Med 2010;63:1610–26. https://doi.org/10.1002/mrm.22394.
7. Ma Y-J, Zhao W, Wan L, Guo T, Searleman A, Jang H, et al. Whole knee joint T1 values measured in vivo at 3T by combined 3D ultrashort echo time cones actual flip angle and variable flip angle methods. Magn Reson Med 2019;81:1634–44. https://doi.org/10.1002/mrm.27510.
8. Krämer M, Maggioni MB, Brisson NM et al. T1 and T2* mapping of the human quadriceps and patellar tendons using ultra-short echo-time (UTE) imaging and bivariate relaxation parameter-based volumetric visualization. Magn Reson Imaging 2019:29–36. https://doi.org/10.1016/j.mri.2019.07.015.
9. Wang G, El-Sharkawy AM, Edelstein WA, Schär M, Bottomley PA. Measuring T2 and T1 and Imaging T2 without Spin Echoes. J Magn Reson 2012;214:273–80. https://doi.org/10.1016/j.jmr.2011.11.016.
10. Jordan CD, Saranathan M, Bangerter NK, Hargreaves BA, Gold GE. Musculoskeletal MRI at 3.0T and 7.0T: A Comparison of Relaxation Times and Image Contrast. Eur J Radiol 2013;82:734–9. https://doi.org/10.1016/j.ejrad.2011.09.021.
Figures