3304
Accelerating 2D Chemical Shift Encoded MRI with Simultaneous Multislice Imaging1Radiology, University of Wisconsin - Madison, Madison, WI, United States, 2Electrical and Computer Engineering, University of Wisconsin - Madison, Madison, WI, United States, 3Medical Physics, University of Wisconsin - Madison, Madison, WI, United States, 4Biomedical Engineering, University of Wisconsin - Madison, Madison, WI, United States, 5Medicine, University of Wisconsin - Madison, Madison, WI, United States, 6Emergency Medicine, University of Wisconsin - Madison, Madison, WI, United States
Synopsis
Chemical shift-encoded (CSE) MRI allows for measurement of important tissue parameters with established and emerging quantitative MRI applications, including proton density fat fraction (PDFF) and R2*. Respiratory and bulk patient movement can affect the accuracy and precision of CSE-MRI measurements, which makes rapid and motion robust imaging of high clinical value. This work demonstrates the combination of simultaneous multislice (SMS) imaging to accelerate 2D motion robust CSE-MRI acquisitions. Results with computer simulations and in vivo experiments confirm the feasibility of combining these two techniques to achieve rapid, whole-liver, motion robust quantitative tissue characterization.
Introduction
Multi-echo chemical shift-encoded (CSE) acquisitions enable measurement of several important parameters with established and emerging quantitative MRI applications. In clinical practice, CSE-MRI can be used to quantify proton density fat fraction (PDFF), a fundamental property reflecting tissue triglyceride concentration1 and R2*, an emerging biomarker of liver iron concentration2-4.Among several confounders5-9, the accuracy of CSE-MRI derived measurements are affected by respiratory and bulk patient motion. Sequentially acquired 2D spoiled gradient echo (SGRE) slices offer increased robustness to motion10. To reduce bulk patient motion, increase patient comfort, and allow higher throughput of clinical patients, overall scan time should be reduced. Parallel imaging methods (eg. SENSE or GRAPPA) can shorten acquisition times, however, both methods reduce the signal-to-noise ratio (SNR), an undesirable consequence exacerbating the already low SNR performance of CSE-MRI, which is further reduced with sequential 2D acquisitions6.
Conversely, simultaneous multislice (SMS) imaging11 is an established 2D imaging method that allows for a reduction in acquisition time without a decrease in SNR12, aside from g-factor effects at very high SMS acceleration factors.
Therefore, the purpose of this work is to demonstrate the feasibility of a fast, motion robust, multi-echo SMS 2D SGRE acquisition for use with CSE-MRI. We demonstrate this through computer simulations and in vivo experiments.
Methods
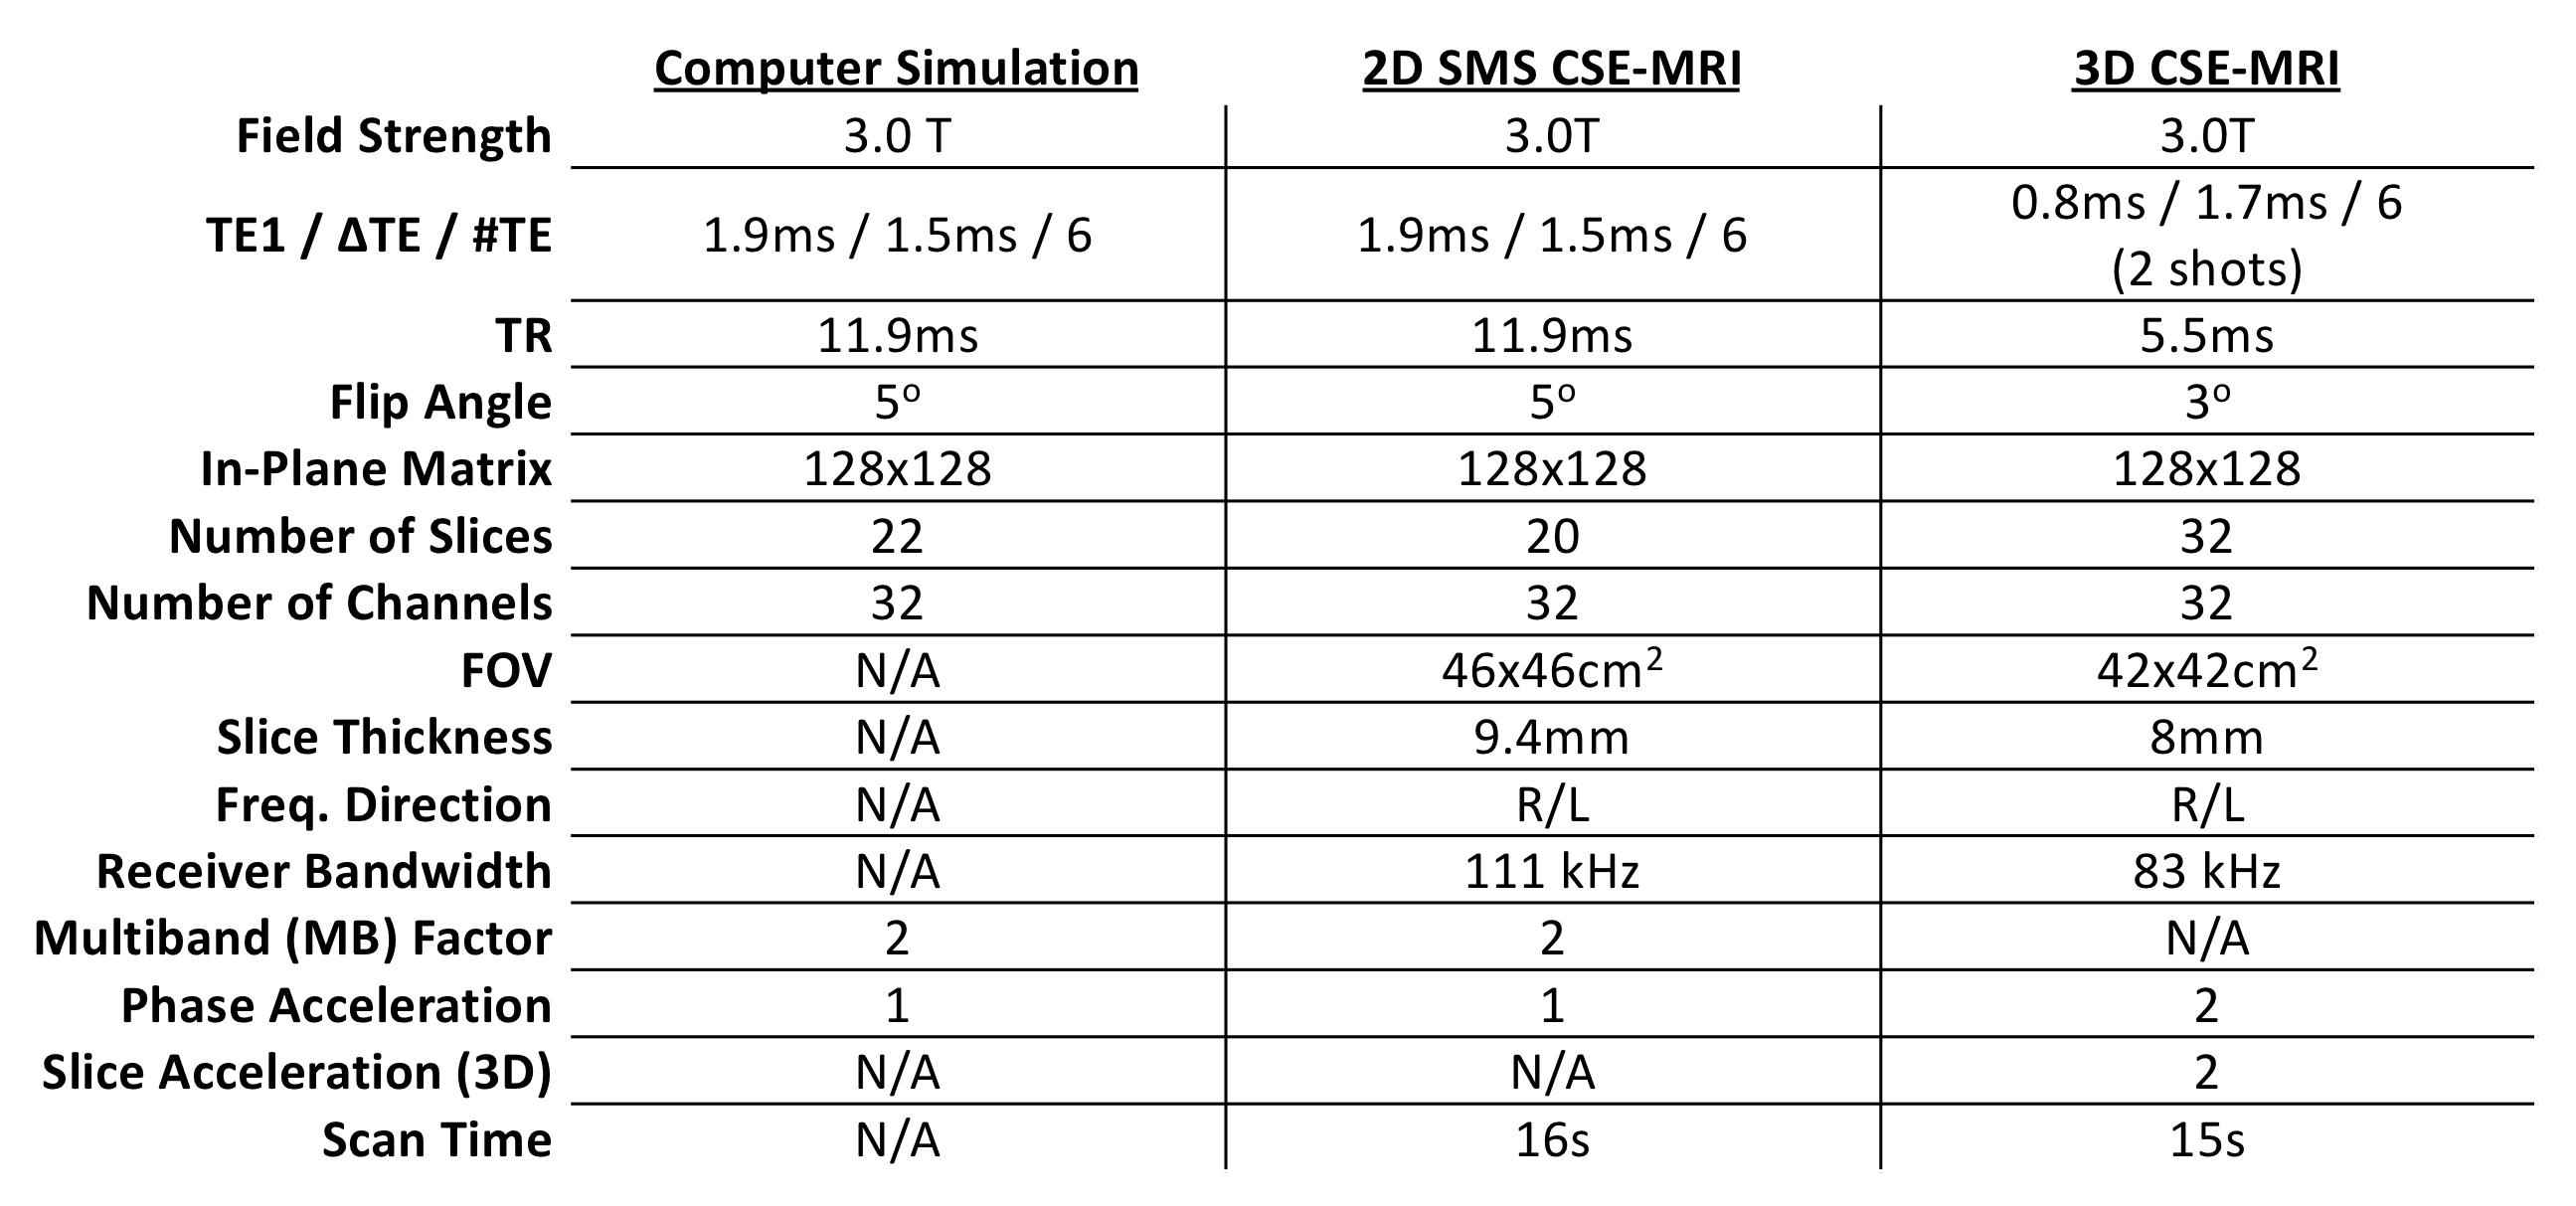
Computer SimulationsA fully sampled multi-echo 2D SGRE digital phantom was simulated using Extended Phase Graphs13 with the acquisition parameters given in Table 1 and tissue parameters similar to those expected in the liver ($$$T1_{WATER}$$$=800ms, $$$T1_{FAT}$$$=300ms, R2*=45s-1, PDFF=0-20%, with no B0 field map and no initial phase). From this noiseless dataset, an SMS acquisition was simulated by summing 2D slices in k-space, including zero mean complex Gaussian noise with SNR approximating the subsequent in vivo experiments (see Results). Afterwards, multi-echo, separated slices were reconstructed using prior knowledge of channel sensitivities and a SENSE-based SMS reconstruction algorithm14. After reconstruction, a non-linear least squares algorithm was used to estimate PDFF ($$$\eta$$$) and R2* using the following signal model:
$$S_n=M_{\circ}e^{i\phi_{\circ}}(1-\eta+\eta \sum_{p=1}^{6}{\alpha_pe^{i 2 \pi f_p t_n}})e^{-R_2^* t_n}e^{i 2 \pi \psi t_n}\quad\quad[1]$$
where $$$t_n$$$ is the echo time, $$$M_{\circ}e^{i\phi_{\circ}}$$$ is the complex signal amplitude, $$$\psi$$$ is the B0 field map (Hz), and $$$\sum_{p=1}^{6}{\alpha_pe^{i 2 \pi f_p t_n}}$$$ is the sum of weighted exponentials used to account for a 6-peak spectral model of fat8. Estimated PDFF and R2* were compared to a reference noiseless fitting.
In Vivo Experiments
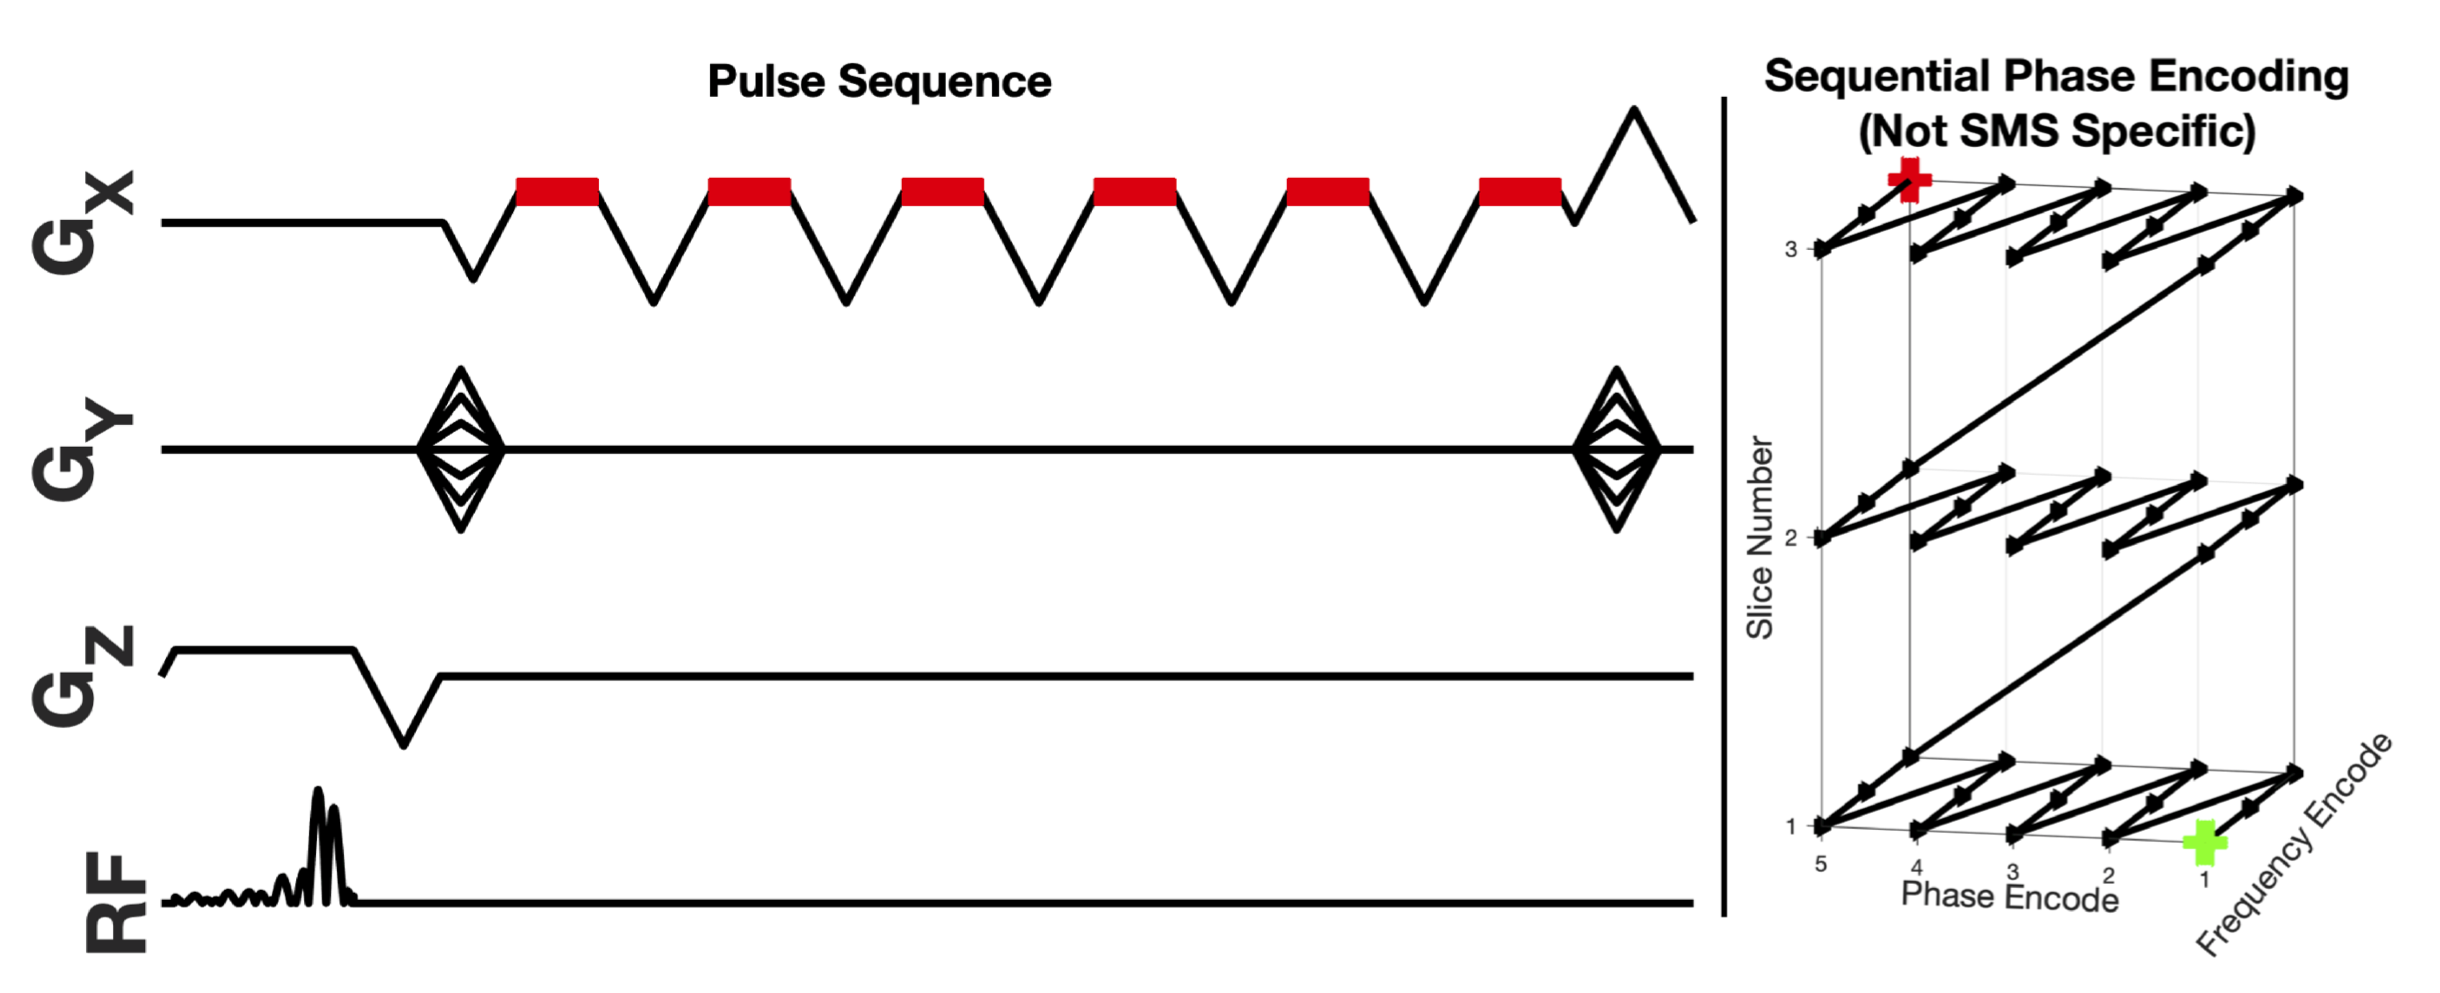
A multi-echo 2D SMS, multiband (MB) factor = 2, SGRE dataset was acquired during end expiration breath-hold (16 seconds) in 3 healthy volunteers on a 3.0T MRI System (GE Healthcare Discovery MR750, Waukesha, WI) using the parameters shown in Table 1 and the pulse sequence shown in Figure 1. Slices were acquired sequentially10 as opposed to the more traditional interleaved scheme, in order to freeze respiratory motion. Channel sensitivities were estimated using the ESPIRiT algorithm14,15 from a separate breath-hold calibration acquisition. Afterwards, a SENSE-based SMS reconstruction algorithm14 was used to separate the simultaneously acquired slices of the SMS acquisition using the calculated channel sensitivities. After reconstruction, a non-linear least squares algorithm was used to estimate tissue parameters using the signal model given in Eq. 1. A 3D CSE-MRI acquisition (IDEAL-IQ, GE Healthcare, Waukesha, WI)16 (parameters given in Table 1) was used as reference for estimated PDFF and R2*.
Results
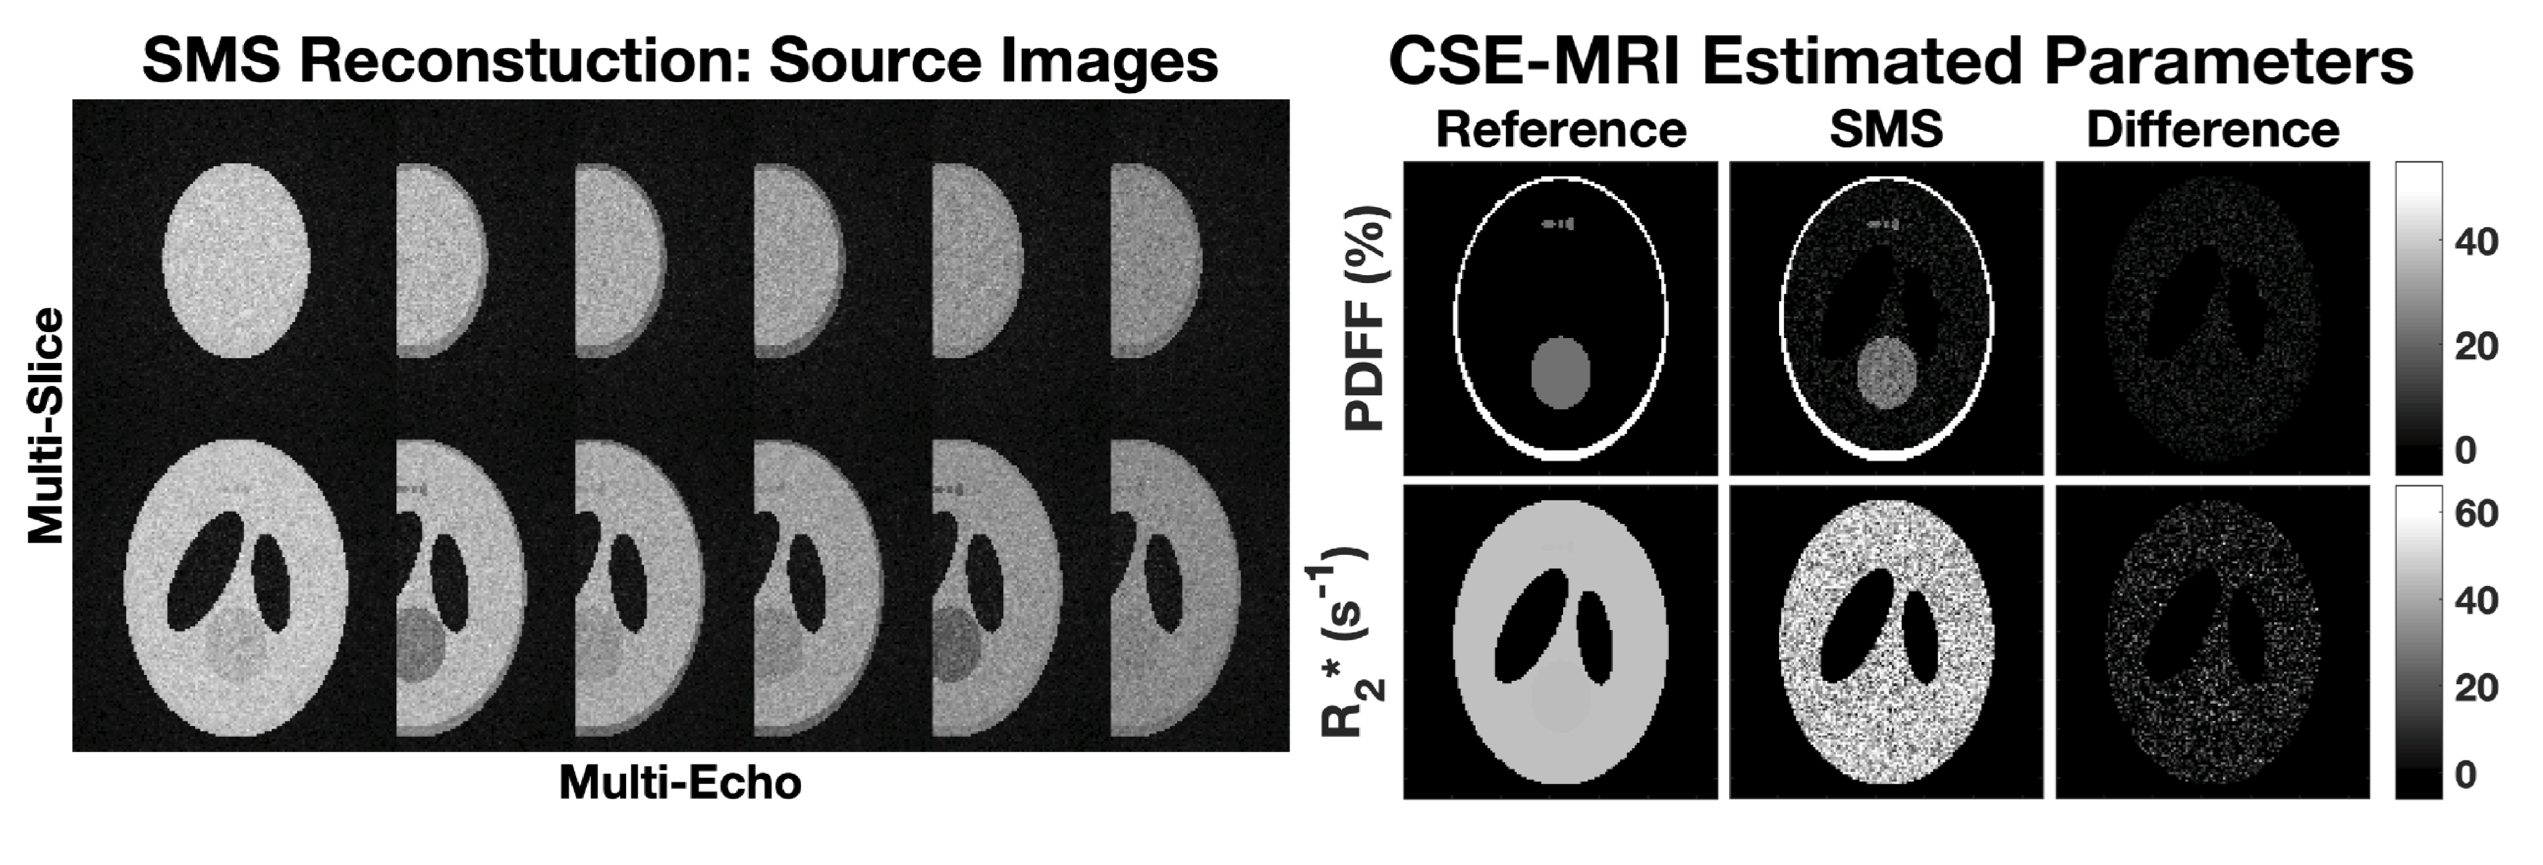
Computer SimulationsA computer simulation study examined the performance of PDFF and R2* estimation after a multi-echo 2D SGRE SMS acquisition and reconstruction. Figure 2 shows the source image slices separated during the SMS reconstruction in addition to the CSE-MRI estimated parameters. Region of interest (ROI) measurements in the difference maps show near 0% PDFF bias and less than 1s-1 R2* bias. SNR, calculated in the magnitude of the first echo of SMS-reconstructed images, was approximately 10.
In Vivo Experiments
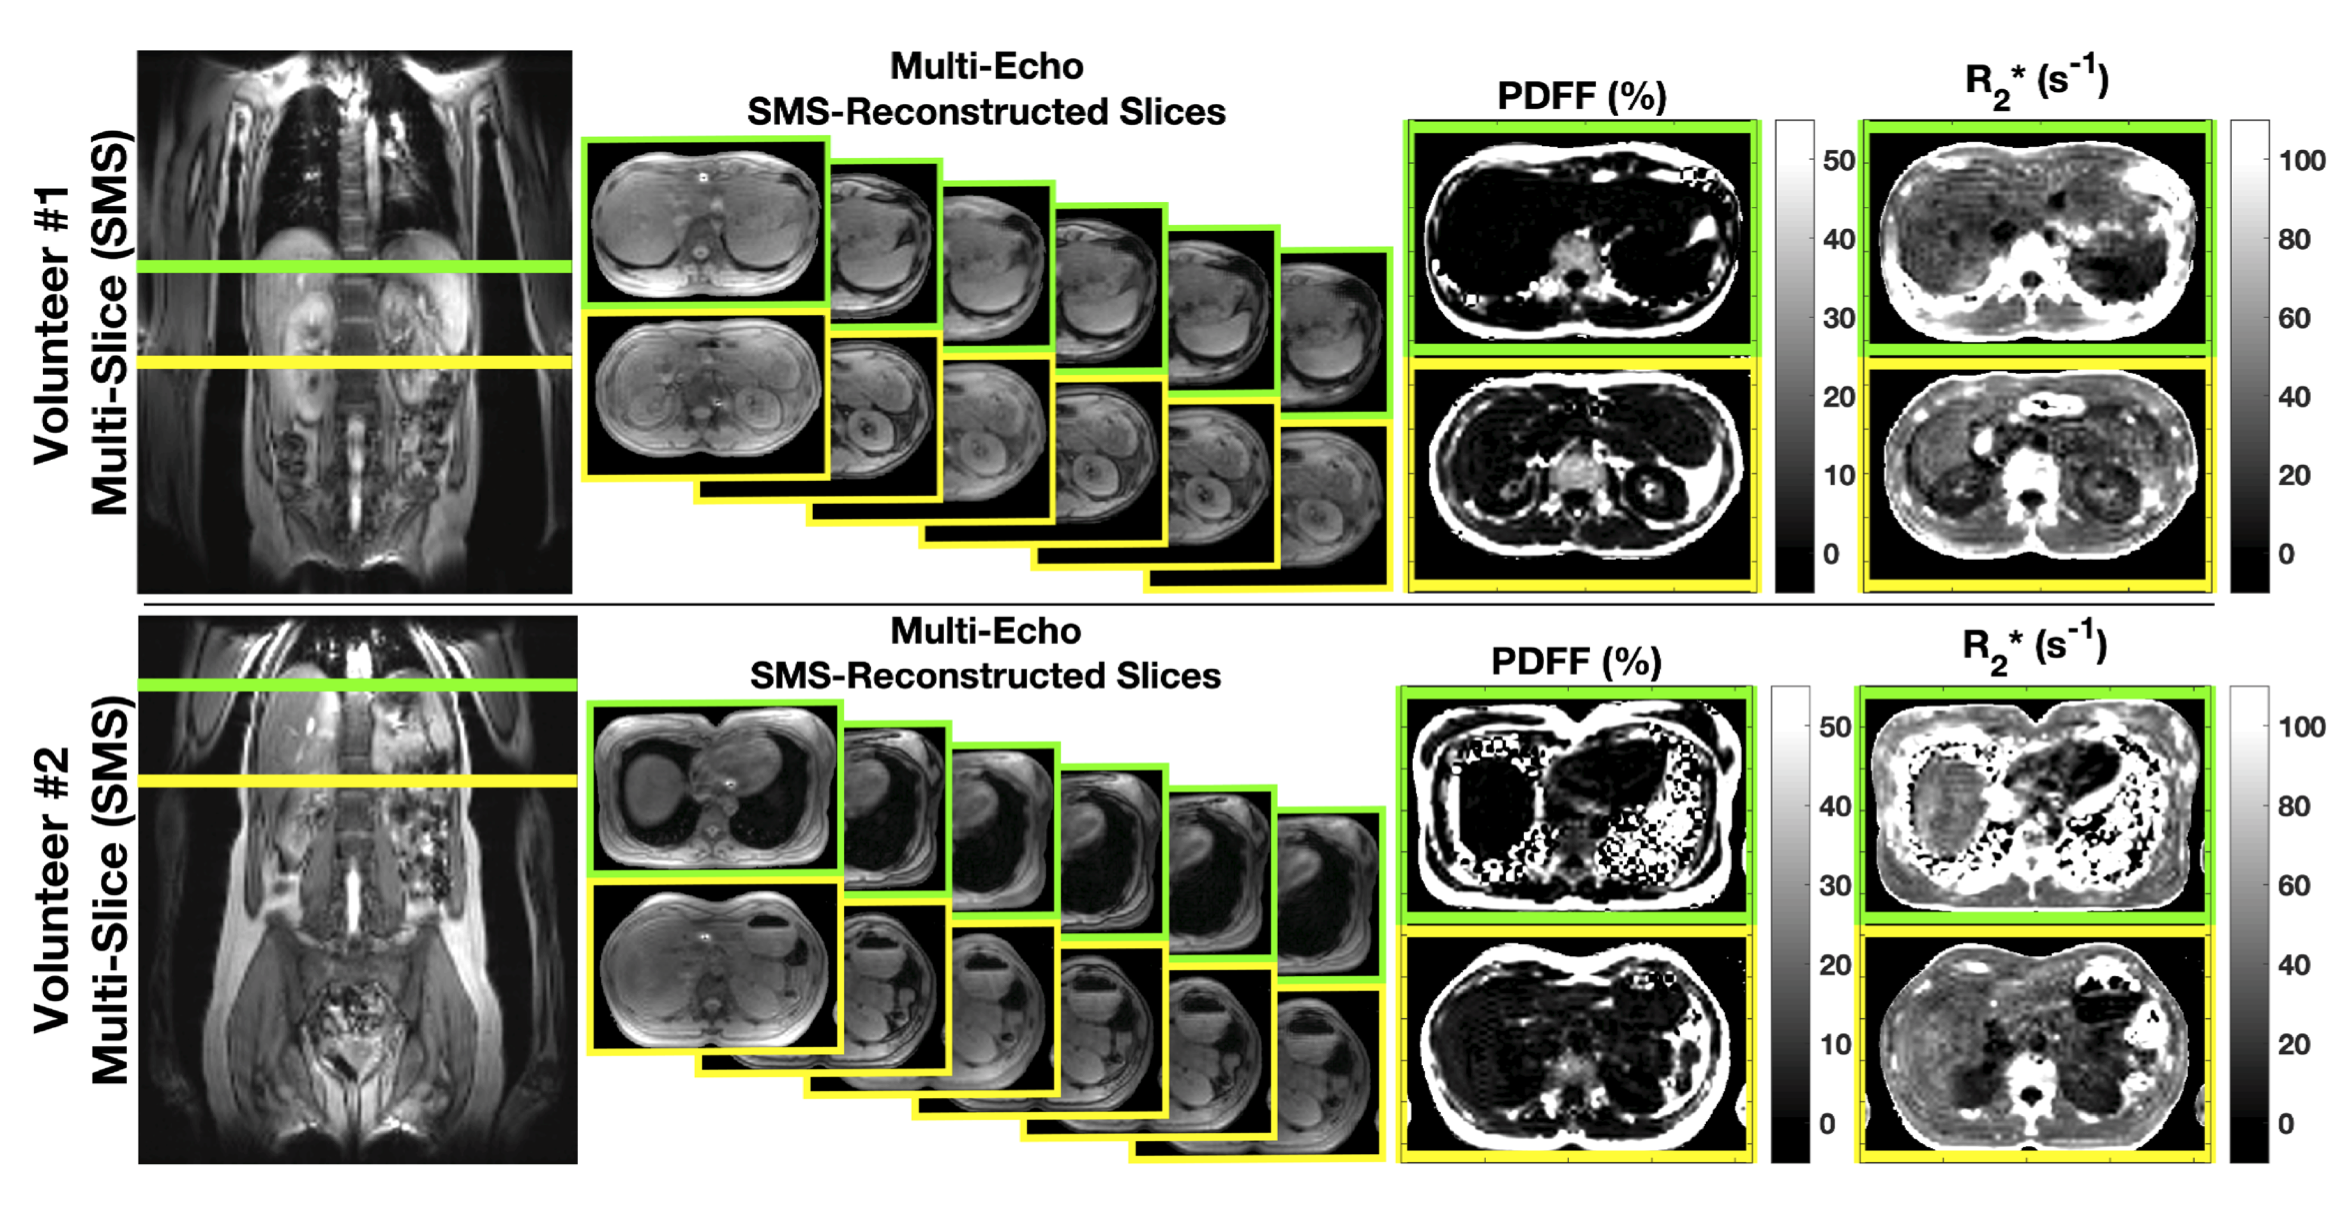
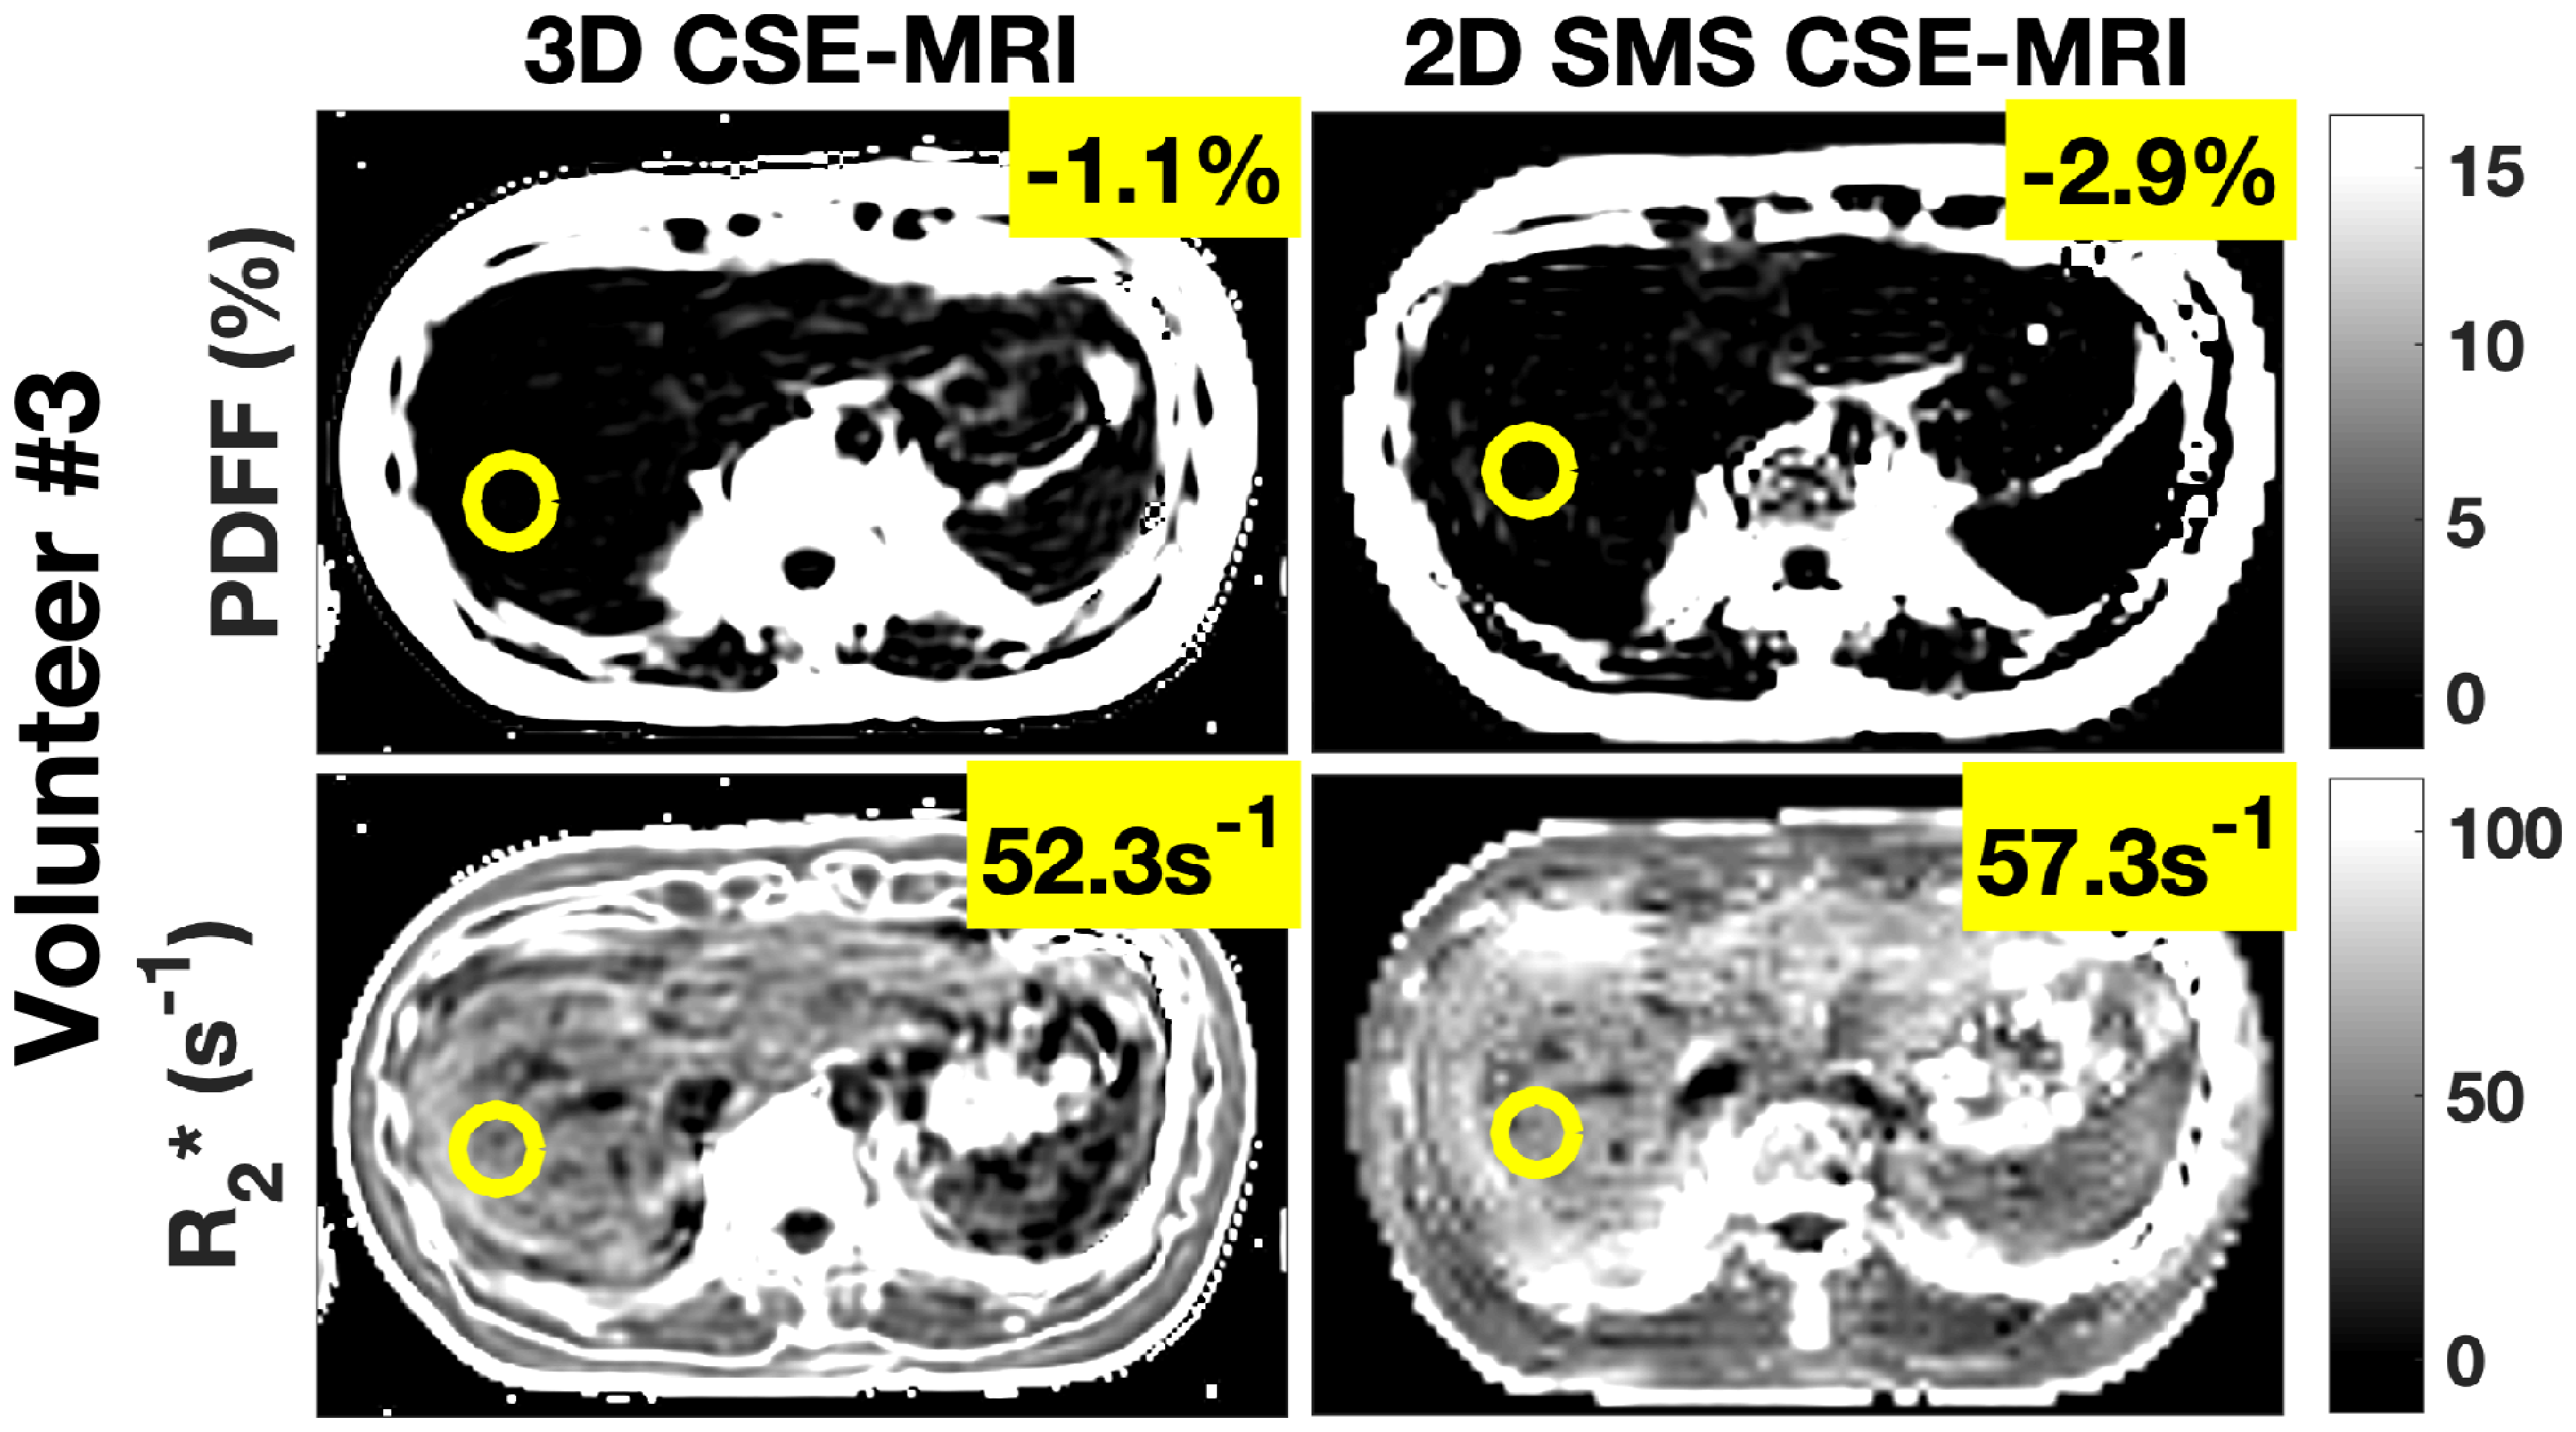
An in vivo study demonstrated the proposed SMS acquisition and reconstruction in the livers of 3 healthy volunteers. Figure 3 shows the multi-echo, simultaneously acquired slices and estimated PDFF and R2* after SMS reconstruction and CSE estimation in two volunteers. The SMS-reconstructed images are largely artifact free and the estimated parameter maps yield values within the expected ranges for liver imaging. Figure 4 shows a comparison of estimated PDFF and R2* between the proposed 2D SMS CSE-MRI and the reference 3D CSE-MRI protocols. The comparison shows good quantitative agreement between the two protocols. Measured SNR ranged between 8-12.
Discussion
This work demonstrates the feasibility of a fast, motion robust, multi-echo SMS 2D SGRE acquisition for use with 2D CSE-MRI. We demonstrated the use of SMS with CSE-MRI through computer simulations and in vivo experiments. The preliminary results presented here represent a promising application of SMS to accelerate CSE-MRI.This study was limited to a MB factor of 2. Future work aims to increase the possible acceleration by incorporating blipped-CAIPI17 to reduce g-factor noise amplification and increase the SMS acceleration factor. Overall, this work demonstrates the feasibility of combining SMS with CSE-MRI to achieve rapid, whole-liver, motion robust tissue quantification without an effective SNR penalty.
Acknowledgements
We wish to acknowledge support from the NIH (R01 DK088925, UL1TR002373), UW Institute for Clinical and Translational Research, and the Clinical and Translational Science Award of the NCATS/NIH. Further, we wish to acknowledge GE Healthcare who provides research support to the University of Wisconsin. Finally, Dr. Reeder is a Romnes Faculty Fellow, and has received an award provided by the University of Wisconsin-Madison Office of the Vice Chancellor for Research and Graduate Education with funding from the Wisconsin Alumni Research Foundation.References
1. Reeder SB, Hu HH, Sirlin CB. Proton density fat-fraction: a standardized MR-based biomarker of tissue fat concentration. J Magn Reson Imaging 2012;36:1011–4 doi: 10.1002/jmri.23741.
2. Hernando D, Levin YS, Sirlin CB, Reeder SB. Quantification of liver iron with MRI: state of the art and remaining challenges. J Magn Reson Imaging 2014;40:1003–21 doi: 10.1002/jmri.24584.
3. Wood JC, Enriquez C, Ghugre N, et al. MRI R2 and R2* mapping accurately estimates hepatic iron concentration in transfusion-dependent thalassemia and sickle cell disease patients. Blood 2005;106:1460–1465 doi: 10.1182/blood-2004-10-3982.
4. Hernando D, Cook RJ, Qazi N, Longhurst CA, Diamond CA, Reeder SB. Complex confounder-corrected R2* mapping for liver iron quantification with MRI. Eur. Radiol. 2020 doi: 10.1007/s00330-020-07123-x.
5. Liu CY, McKenzie CA, Yu H, Brittain JH, Reeder SB. Fat quantification with IDEAL gradient echo imaging: correction of bias from T(1) and noise. Magn Reson Med 2007;58:354–64 doi: 10.1002/mrm.21301.
6. Roberts NT, Hernando D, Holmes JH, Wiens CN, Reeder SB. Noise properties of proton density fat fraction estimated using chemical shift-encoded MRI. Magn. Reson. Med. 2018;80:685–695 doi: 10.1002/mrm.27065.
7. Bydder M, Yokoo T, Hamilton G, et al. Relaxation effects in the quantification of fat using gradient echo imaging. Magn Reson Imaging 2008;26:347–59 doi: 10.1016/j.mri.2007.08.012.
8. Yu H, Shimakawa A, McKenzie CA, Brodsky E, Brittain JH, Reeder SB. Multiecho water-fat separation and simultaneous R2* estimation with multifrequency fat spectrum modeling. Magn Reson Med 2008;60:1122–34 doi: 10.1002/mrm.21737.
9. Hernando D, Hines CD, Yu H, Reeder SB. Addressing phase errors in fat-water imaging using a mixed magnitude/complex fitting method. Magn Reson Med 2012;67:638–44 doi: 10.1002/mrm.23044.
10. Luo H, Zhu A, Wiens CN, et al. Free-breathing liver fat and quantification using motion-corrected averaging based on a nonlocal means algorithm. Magn. Reson. Med. 2021;85:653–666 doi: https://doi.org/10.1002/mrm.28439.
11. Larkman DJ, Hajnal JV, Herlihy AH, Coutts GA, Young IR, Ehnholm G. Use of multicoil arrays for separation of signal from multiple slices simultaneously excited. J. Magn. Reson. Imaging 2001;13:313–317 doi: 10.1002/1522-2586(200102)13:2<313::AID-JMRI1045>3.0.CO;2-W.
12. Barth M, Breuer F, Koopmans PJ, Norris DG, Poser BA. Simultaneous multislice (SMS) imaging techniques. Magn. Reson. Med. 2016;75:63–81 doi: 10.1002/mrm.25897.
13. Weigel M. Extended phase graphs: Dephasing, RF pulses, and echoes - pure and simple. J. Magn. Reson. Imaging 2015;41:266–295 doi: 10.1002/jmri.24619.
14. Uecker M. BART Toolbox for Computational Magnetic Resonance Imaging.
15. Uecker M, Lai P, Murphy MJ, et al. ESPIRiT--an eigenvalue approach to autocalibrating parallel MRI: where SENSE meets GRAPPA. Magn Reson Med 2014;71:990–1001 doi: 10.1002/mrm.24751.
16. Reeder SB, Pineda AR, Wen Z, et al. Iterative decomposition of water and fat with echo asymmetry and least-squares estimation (IDEAL): application with fast spin-echo imaging. Magn. Reson. Med. 2005;54:636–644 doi: 10.1002/mrm.20624.
17. Price AN, Cordero-Grande L, Malik SJ, Hajnal JV. Simultaneous multislice imaging of the heart using multiband balanced SSFP with blipped-CAIPI. Magn. Reson. Med. 2020;83:2185–2196 doi: 10.1002/mrm.28086.
Figures