3303
Multi-component T2 Modeling for Improved Characterization of Abdominal Neoplasms1Siemens Medical Solutions USA Inc, New York, NY, United States, 2Medical Imaging, University of Arizona, Tucson, AZ, United States, 3Biomedical Engineering, University of Arizona, Tucson, AZ, United States, 4Electrical and Computer Engineering, University of Arizona, Tucson, AZ, United States
Synopsis
Turbo spin-echo based T2 quantification of neoplasms is affected by partial volume effects resulting in underestimation of T2 values leading to lesion misclassification. Bi-exponential models proposed for two-component T2 estimation do not account for flip angle variations across the excited slice due to RF imperfections. This work presents a two-component model for accurate T2 estimation in the presence of partial volume which considers the slice profile of the excitation and refocusing pulses. The proposed model has <4% relative error in slices affected by partial volume and allows good separation between benign and malignant lesions in the abdomen.
Introduction
Quantitative T2 mapping has been proposed for the classification of focal liver lesions1-3 with radial turbo spin echo (RADTSE) based methods providing an efficient quantitative tool for T2 mapping of the abdomen4-6. RADTSE allows generation of co-registered images at different TEs from a single acquisition which can be used to generate a T2 map.Partial volume (PV) effects arising from the presence of two tissue types in a voxel affect T2 estimation. In the case of focal liver lesions, PV causes underestimation of lesion T2 due to presence of liver tissue leading to misclassification of benign lesions (hemangioma or bile-hamartoma) as a malignancy. A previously proposed multi-component abdominal T2 estimation technique7 assumed a bi-exponential signal model to describe signal evolution. This model does not account for slice profile variations that affect the flip angle distribution across a slice when using selective 2D excitation.
In this work, we present a two-component model for accurate T2 estimation in the presence of slice profile imperfections. This technique is evaluated in a variable flip angle RADTSE sequence8 (RADTSE-VFA) where the refocusing flip angles are modulated during the echo train. Estimation performance is validated using simulations, phantoms and in vivo imaging.
Slice Profile Corrected 2-Component Signal Model
The proposed two-component signal model uses separate scaling factors to account for differences in slice profiles experienced by lesion and background tissues. The model, referred to as component-specific slice Profile Correction(csProCo), is expressed as:$$s(TE)=I_{bg} f(T1_{bg},T2_{bg},B1,λ_{bg},θ_0 (z),θ_1 (z)…,θ_i (z),TE)\\+I_{les} f(T1_{les},T2_{les},B1,λ_{les},θ_0 (z),θ_1 (z)…,θ_i (z),TE)[1]$$
where the subscripts $$$bg$$$ and $$$les$$$ denote background liver and lesion, respectively. $$$I_{bg}$$$ and $$$I_{les}$$$ are the corresponding signal intensities at TE=0. $$$\theta_0(z)$$$ is the excitation RF profile, $$$\theta_i(z)$$$ are the refocusing RF profiles, $$$\lambda_{bg}$$$ and $$$\lambda_{les}$$$ are component specific slice profile scaling factors, $$$B1$$$ is a scaling factor for the excitation and refocusing flip angles, and $$$f(.)$$$ is the slice-resolved EPG model. Estimation performance was also evaluated using a global slice Profile Correction (gProCo) model that assumes the same slice profile for lesion and background components in Eq1($$$ \lambda_{les}=\lambda_{bg}=1 $$$).
T2 estimation was performed by adapting the previously proposed joint fitting framework7 to work with the proposed model.
Simulations
Simulations were performed using a numerical phantom to represent a spherical lesion embedded within background liver tissue. Signal at each voxel was simulated using the SEPG model while accounting for the slice profiles experienced by the two different species (Lesion T2=1805ms, Liver T2=405ms). T2 values were estimated using the joint estimation algorithm with the csProCo and gProCo models.Phantom and In vivo Imaging
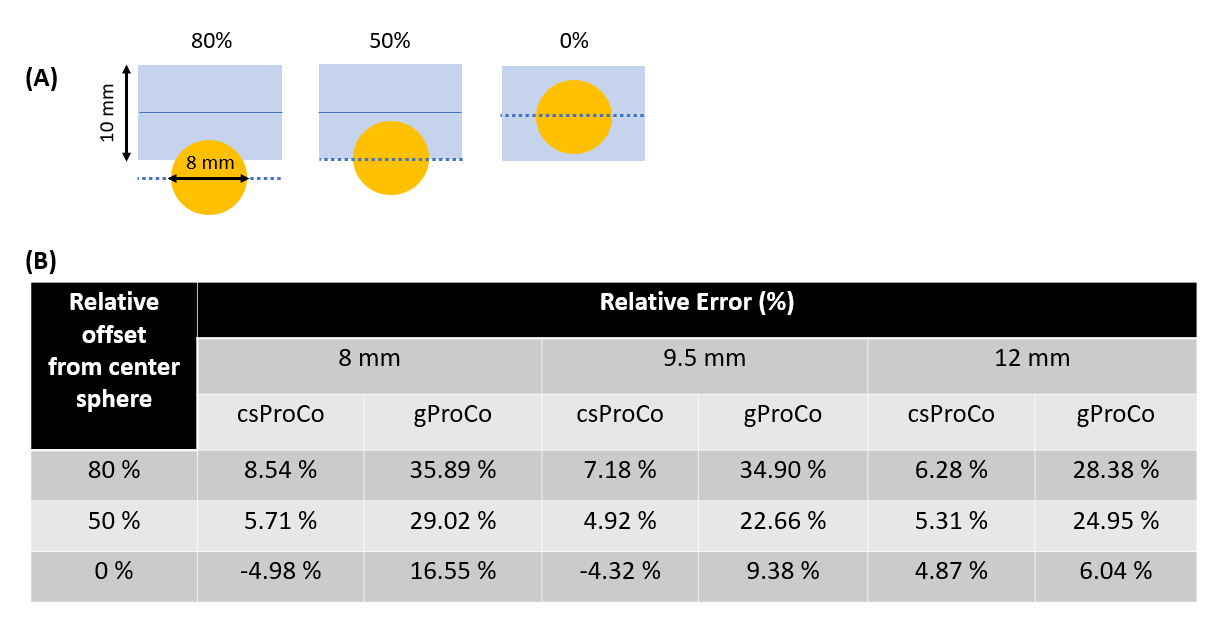
Phantom experiments were performed at 3T (MAGNETOM Skyra, Siemens Healthcare, Erlangen, Germany). Three spherical bulbs with varying diameter and T2=160ms were immersed in a container filled with a T2=44ms to represent (benign) spherical lesions embedded in background tissue. RADTSE-VFA data were acquired with: FOV=14cm, views=256, ETL=64, and slice-thickness=10mm. Slices prescribed with 80%, 50% and 0% relative offsets from the center of the spherical bulb to introduce varying levels of PV. Reference T2 estimates were obtained using a single-echo spin-echo pulse sequence.Subjects were imaged after obtaining informed consent in agreement with the institutional review board requirements. Breath-held data were acquired using RADTSE-VFA with the following parameters: FOV=34-38 cm, ETL=64, views=192, slice-thickness=8mm.
Results and Discussion
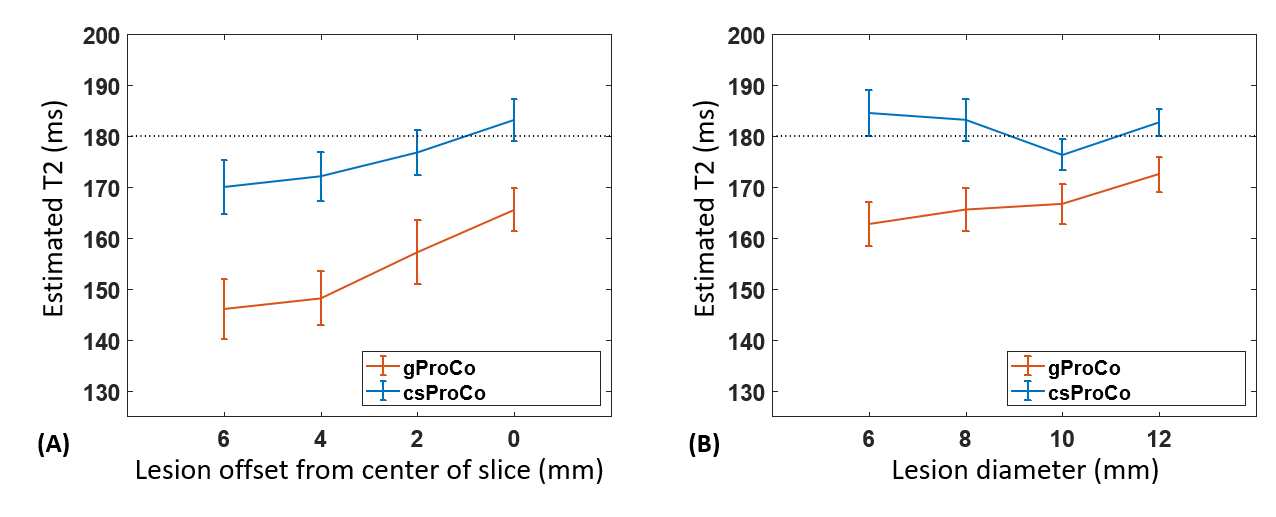
Results of the Monte-Carlo simulations evaluating the effect of (i) changing the position of lesion relative to the center of the imaging slice and (ii) lesion size on T2 estimation are shown in Figure 1. T2 accuracy for the csProCo model improves as the lesion moves towards the center of the slice (Figure 1A) where the slice profile is more uniform and as lesion size increases (Figure 1B) since more of the lesion component experiences the true refocusing flip angle.Figure 2 shows the relative T2 error for the spherical bulbs for three different relative slice positions. Note that the error is significantly diminished for all spherical bulbs when using csProCo, with relative T2 error <6% when the lesion at the center of the slice (0%offset) or <50% of the lesion is within the slice (50%offset). When the lesion is at the edge of the slice (80%offset), the error is 8-9%.
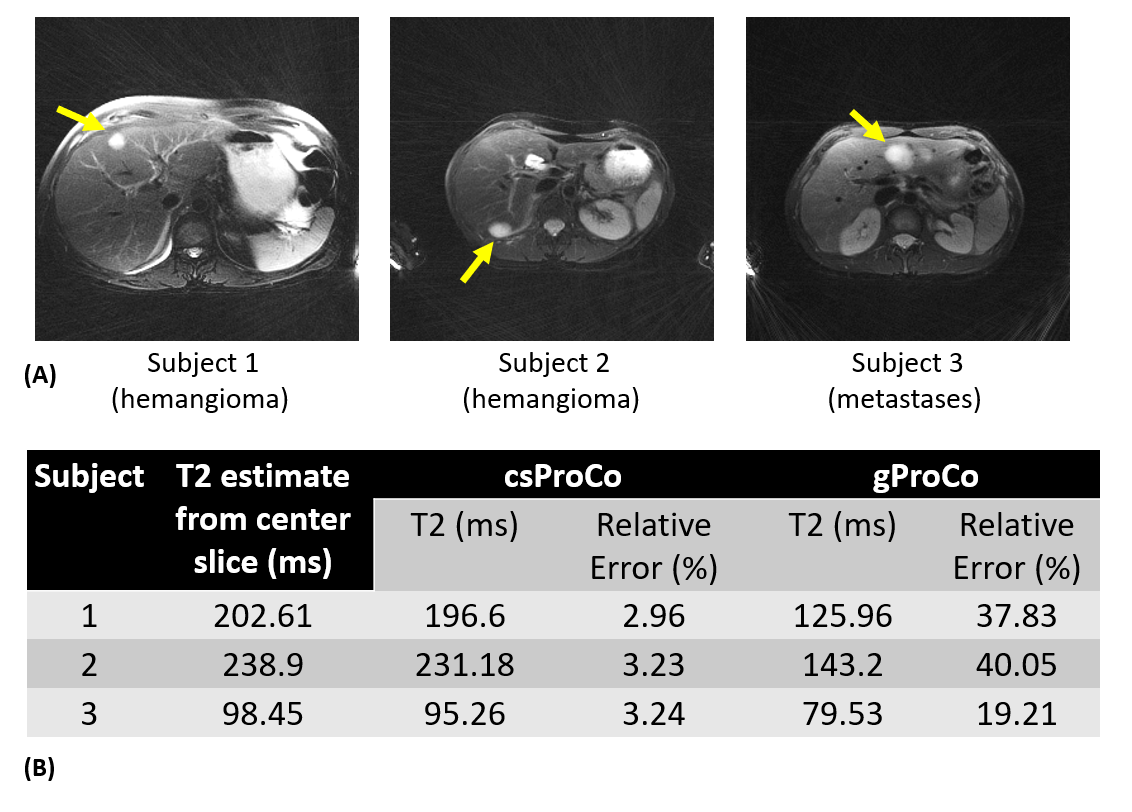
The effects of PV on T2 estimation is illustrated in Figure 3 for three different subjects where the slice was chosen to be at the edge of the lesion, thus affected by PV. To validate the proposed csProCo model in vivo, T2 values were also estimated from a slice going through the center of the lesion (i.e., no PV). Note that the gProCo model under-estimates the T2 of the hemangiomas by up to 40%. T2 estimates from csProCo are closer to the center slice T2 values with the estimation error being only 3.2%.
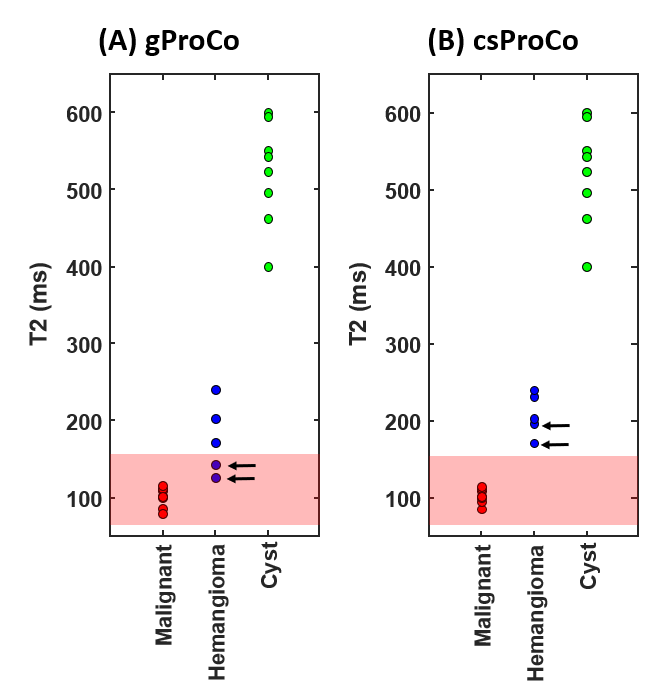
Figure 4 shows scatter plots of 21 abdominal neoplasms as a function of their T2 value. Note that gProCo underestimates the T2 for the two hemangiomas from the subjects in Figure 3 thus falling within the range of malignancies (red box) determined from malignancies without PV. csProCo corrects this effect yielding good separation between the hemangiomas and malignant lesions.
Conclusion
A two-component model that accounts for slice profile variations for individual components improves T2 estimation when partial volume is present. The method should improve characterization of small focal liver lesions.Acknowledgements
We would like to acknowledge grant support from NIH (CA245920), the Arizona Biomedical Research Commission (ADHS14-082996), and the Technology and Research Initiative Fund Technology and Research Initiative Fund (TRIF).References
1 Cieszanowski A, Anysz-Grodzicka A, Szeszkowski W, Kaczynski B, Maj E, Gornicka B, Grodzicki M, Grudzinski I, Stadnik A, Krawczyk M, Rowinski O. Characterization of focal liver lesions using quantitative techniques: comparison of apparent diffusion coefficient values and T2 relaxation times. Eur Radiol 2012;22:2514–2524.
2 Farraher SW, Jara H, Chang KJ, Ozonoff A, Soto JA. Differentiation of hepatocellular carcinoma and hepatic metastasis from cysts and hemangiomas with calculated T2 relaxation times and the T1, 2006
3 Fenlon, H. M., Tello, R., Victor, L. S., & Yucel, E. K. (2000). Signal characteristics of focal liver lesions on double echo T2-weighted conventional spin echo MRI: observer performance versus quantitative measurements of T2 relaxation times. Journal of computer assisted tomography, 24(2), 204-211.
4 M. Altbach, A. Bilgin, Z. Li, E. Clarkson, Theodore P. Trouard, and A. Gmitro. Processing of radial fast-spin echo data for obtaining t2 estimates from a single k-space data set. Magn Reson Med, 54:549–559, 2005.
5 Huang C, Graff CG, Clarkson EW, Bilgin A, Altbach MI , T2 mapping from highly undersampled data by reconstruction of principal component coefficient maps using compressed sensing. Magn Reson Med. 2012 May; 67(5):1355-66.
6 C. Huang, A. Bilgin, T. Barr, and M. I. Altbach. T2 relaxometry with indirect echo compensation from highly undersampled data. Magn Reson Med, 70(4):1026–37, 2013.
7 Huang, Chuan, et al. "Correcting partial volume effects in biexponential T2 estimation of small lesions." Magnetic resonance in medicine 73.4 (2015): 1632-1642.
8 Keerthivasan, Mahesh Bharath, et al. "Variable Flip Angle Radial Turbo Spin Echo Technique for Abdominal T2 Mapping." ISMRM, 0072, 2017
Figures