3302
Comparison of T1ρ imaging between rapid acquisition with relaxation enhancement (RARE) and ultrashort TE (UTE) sequence of rat liver at 11.7T MRI1Institute of Science and Technology for Brain-Inspired Intelligence, Fudan University, Shanghai, China, 2Department of Radiology, Ruijin Hospital, Shanghai Jiao Tong University School of Medicine, Shanghai, China, 3Human Phenome Institute, Fudan University, Shanghai, China, Shanghai, China
Synopsis
In this study, T1ρ images of 24 rat liver samples were acquired with two types of pulse sequences: RARE and UTE. The mean T1ρ value of the rat liver with RARE was significantly higher compared to UTE (p<0.001). This study shows that the quantitative UTE-R1ρ has a better correlation with LIC than RARE-R1ρ.
Introduction
It has been reported that changes of T1ρ were highly linear with iron concentration and more sensitive than T2 [1]. Our recent study suggested that the R1ρ (=1/T1ρ) values were significantly associated with liver iron concentration (LIC) at the high spin-lock frequency (FSL) [2]. Since the most prominent effect of iron is decrease in the T2/T2* relaxation time of tissues, the iron-overload liver shows little signal with conventional T1ρ sequences like RARE, which typically have echo times of several milliseconds or longer. Whereas, with UTE MR imaging sequences, the signal can be detected from structures with predominantly short T2/T2*. This study aims to evaluate the difference in T1ρ profiles and compare the correlations between RARE-based and UTE-based sequences with LIC in the assessment of rat liver iron overload.Method
Twenty-four male Sprague-Dawley rats were administered 0, 25, 50, and 100 mg/kg body weight iron dextran (Sigma, 100 mg Fe/ml). After one week, all rats were euthanized with isoflurane. A portion of the largest hepatic lobe was extracted to quantify the LIC by inductively coupled plasma (ICP), and the remaining liver tissue was stored in 4% buffered paraformaldehyde for 24 h before MRI.MRI was performed on an 11.7T Bruker Biospec with a Tx/Rx quadrature coil. spin-lock preparation with RARE readout and 2D UTE readout pulses were developed to quantify R1ρ. Both RARE-based and UTE-based sequences were acquired with the following parameters: FOV=45×45 mm2, matrix=128×128, slice thickness=1 mm on a single slice (the largest liver slice). Six different spin lock times (TSL=1, 10,20,30,40,50 ms), spin lock frequency (FSL) = 2000 Hz. For RARE-based sequence, TR/TE=5000/4.5 ms, rarefactor=2. The parameters used for the acquisition of UTE-based R1ρ weighted images were as follows: TR=300 ms, TE=0.37 ms, FA=900.
Pixel-by-pixel mono-exponential fitting of the signal intensities algorithm at different TSL was performed using Matlab (MathWorks, Natick, MA). All statistical evaluations were performed using SPSS Statistics software (20.0, Chicago, IL, USA). A P< 0.05 was considered statistically significant.
Results and discussions
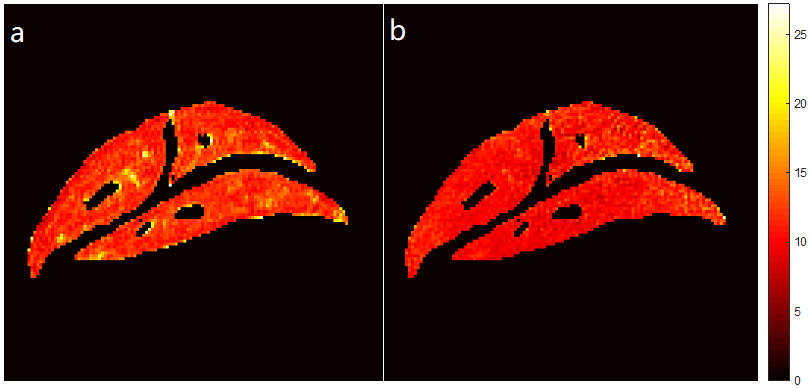
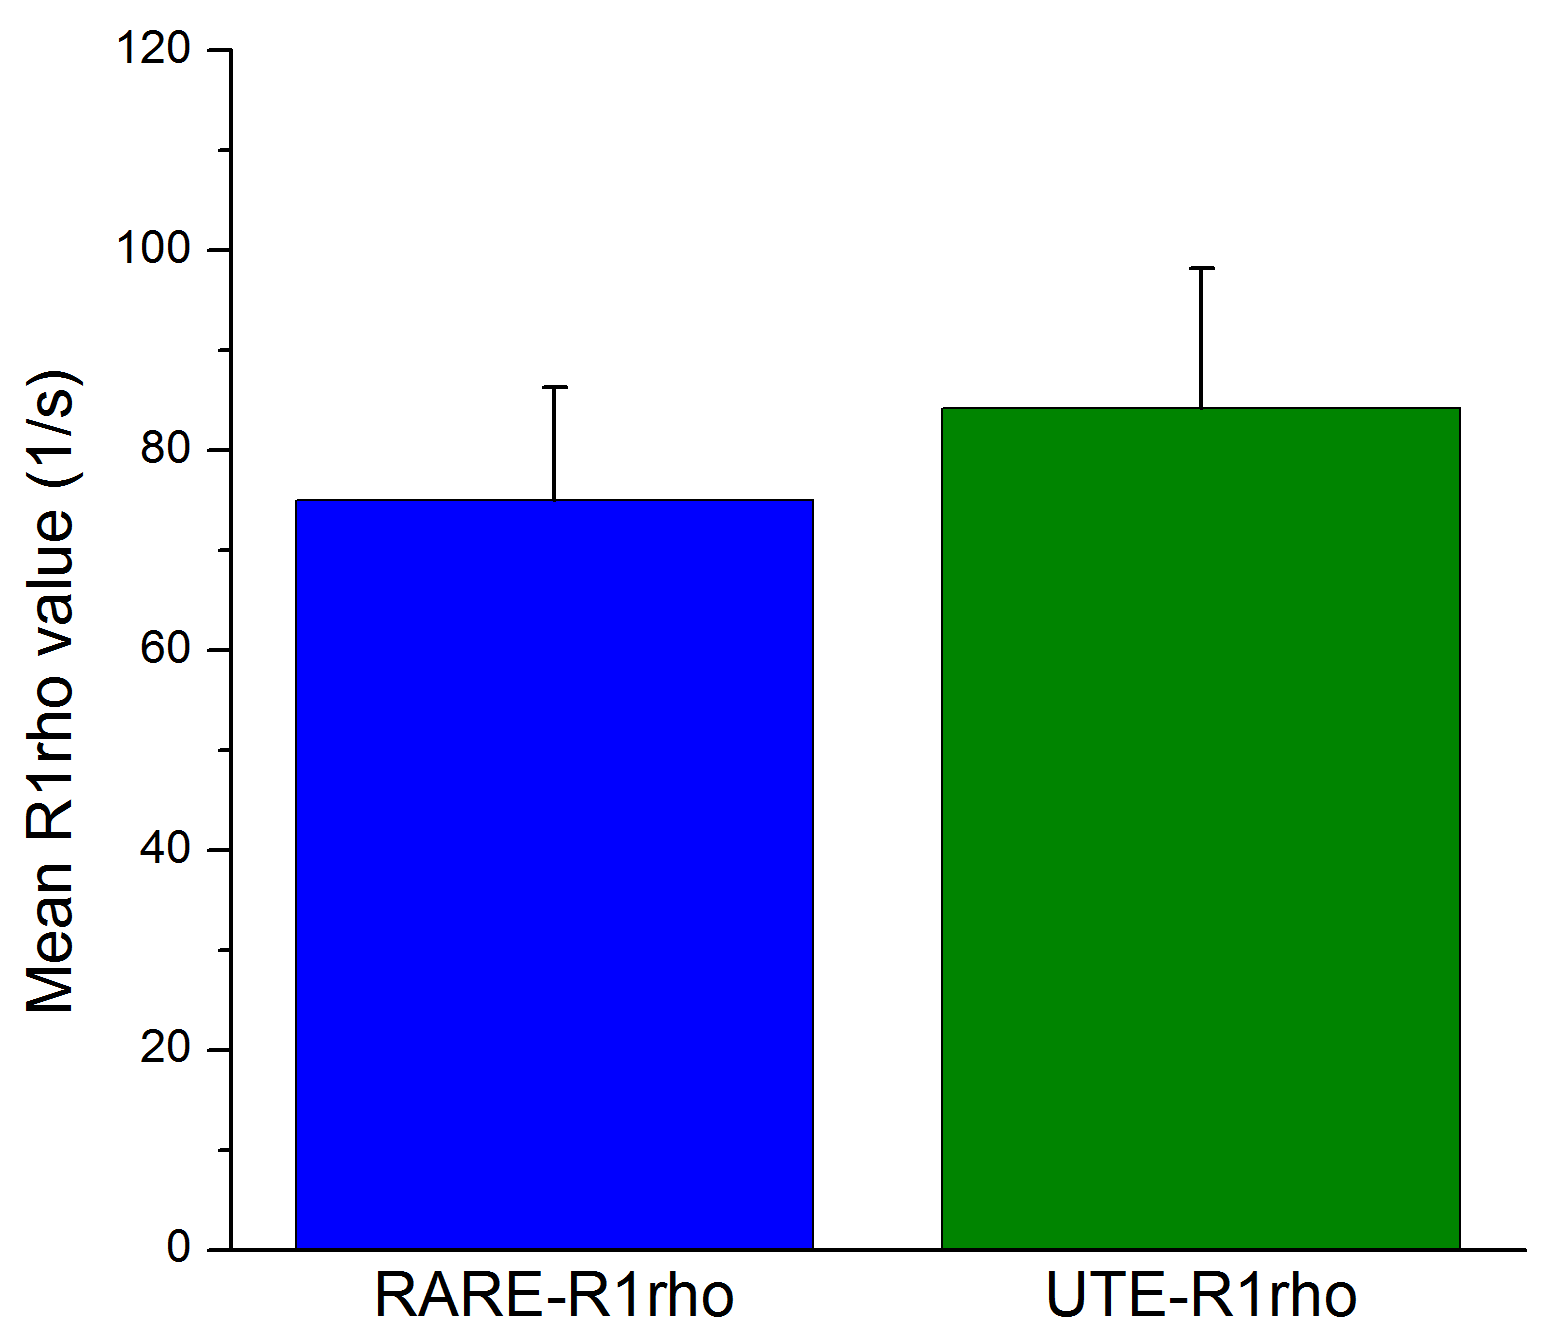
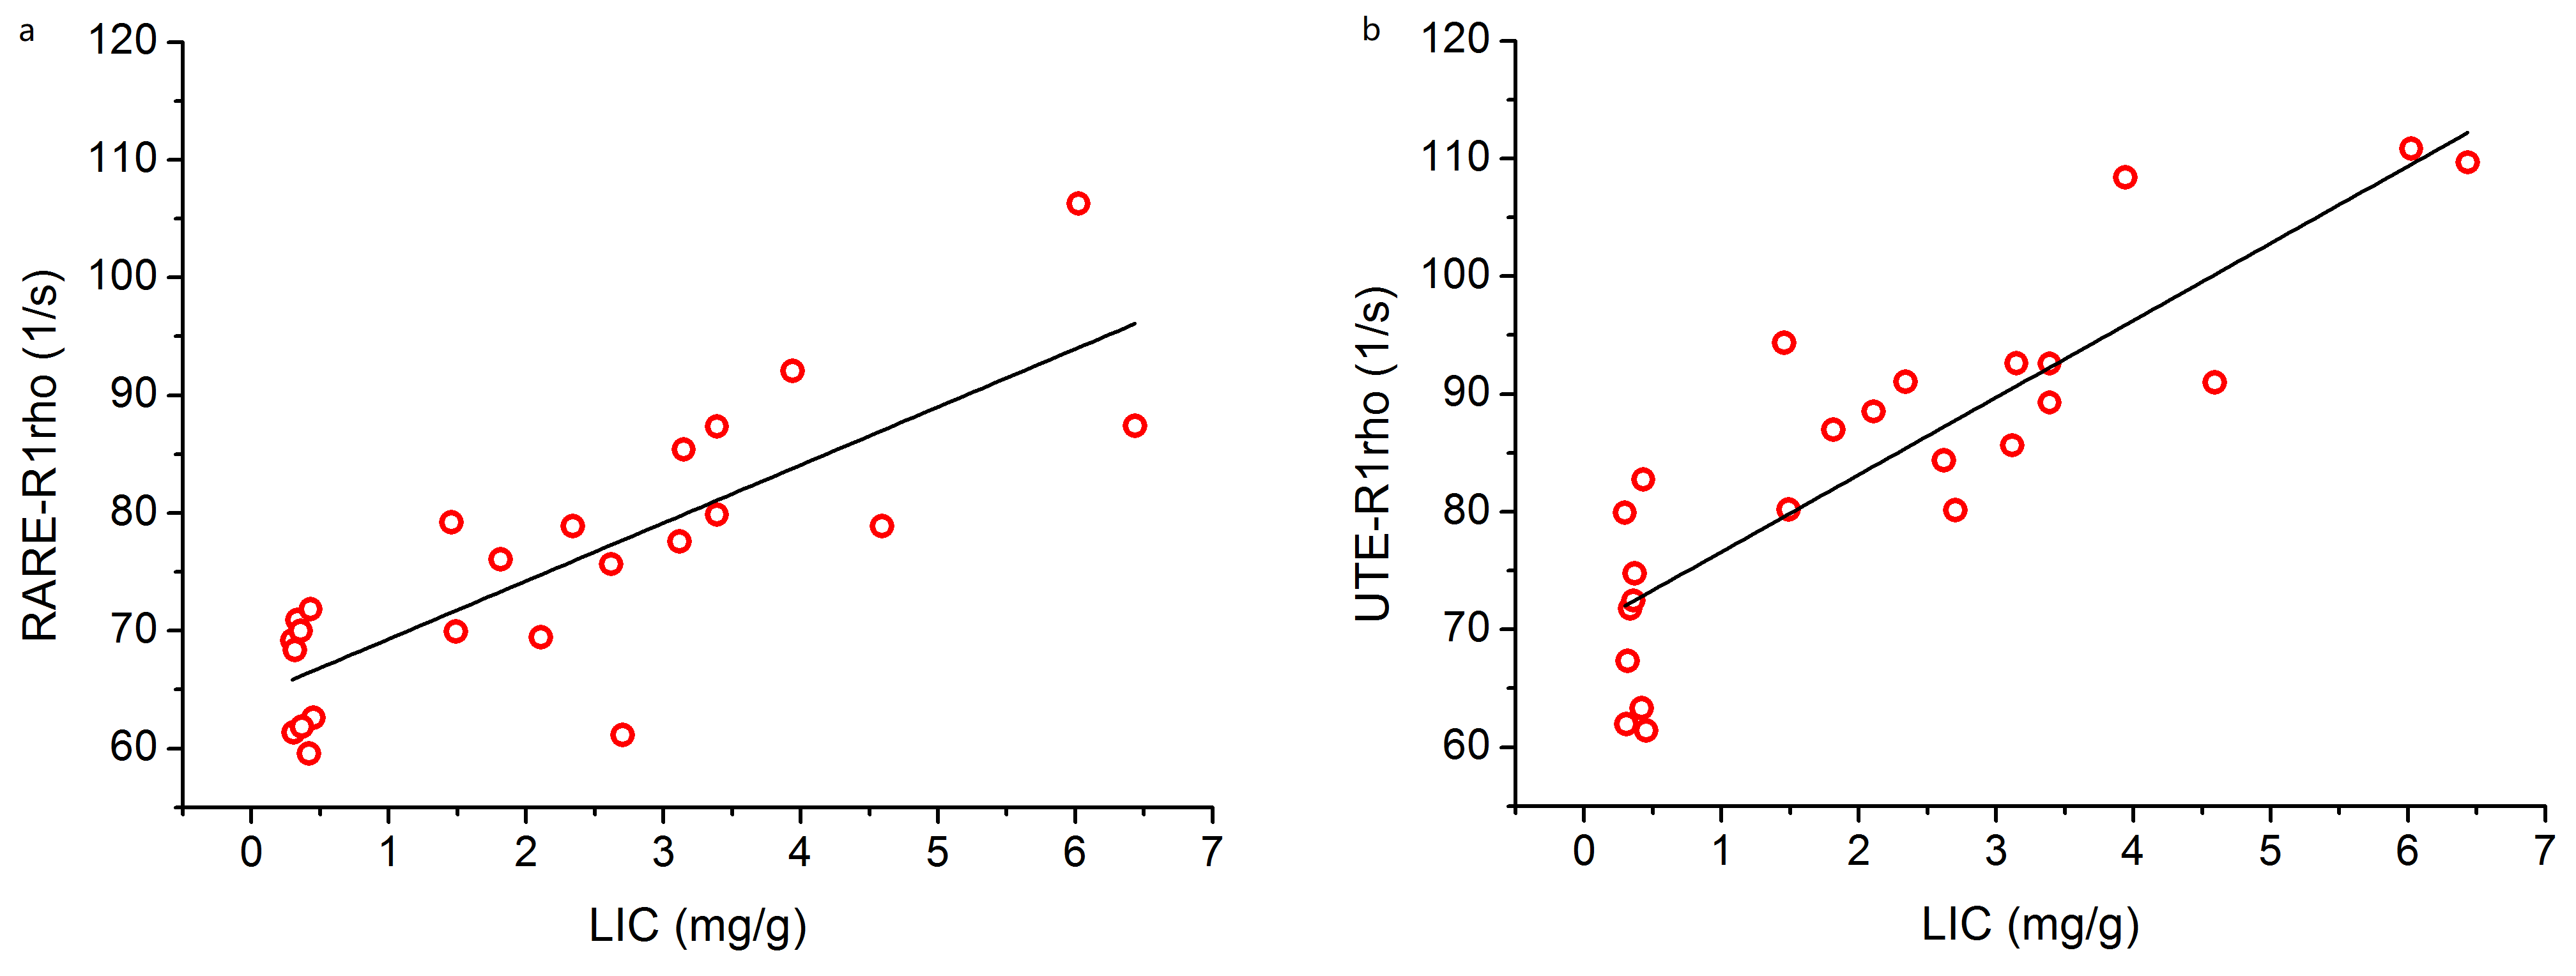
Figure 1 showed an example quantitative T1ρ maps by RARE (a) and UTE (b). The mean value of R1ρ was 75.03±11.22 (mean±SD) on RARE-based sequence and 84.22±13.99 on UTE-based sequence (Figure 2). The mean R1ρ value of the rat liver with UTE was significantly higher compared to RARE (p<0.005). Spearman’s correlation analysis (two-tailed) indicated that the R1ρ values were significantly correlated with LIC for both RARE and UTE (r = 0.759, P < 0.001, and r = 0.823, P < 0.001, respectively, Figure 3).Iron overload caused by physiological or pathological factors can cause damage to the hepatocytes, an accurate assessment of liver iron levels is necessary for detection and quantitative staging of iron overload, and monitoring of iron-reducing treatments. Previous studies demonstrated that spin-lock MR is a promising technique for the sensitive detection of iron [1]. In our recent study, RARE-based R1ρ imaging sequence was used to quantify R1ρ relaxation rates of iron-overload liver, and a significant association was found for high spin-lock frequencies between R1ρ and LIC. UTE-based R1ρ sequence has been used successfully to image short-T2 tissue such as cartilage, menisci, and myocardium. This study shows that quantitative UTE-R1ρ has a better correlation with LIC than RARE-R1ρ. Due to the incomplete recovery of the longitudinal magnetization, the quantitative T1ρ values with UTE may be contaminated by T1 [3], future study should consider T1 compensation for accurate measurement of T1ρ.
Conclusions
The current study represents a strong association between UTE-R1ρ and LIC further confirming previous findings. The results indicated that UTE-R1ρ may more sensitive than RARE-R1ρ to liver iron overload quantification.Acknowledgements
The authors thank Yinghua Chu for the helpful discussion. This work was supported by the National Natural Science Foundation of China (No. 81971583, No. 81671649), Shanghai Municipal Science and Technology Major Project (No.2017SHZDZX01, No.2018SHZDZX01, VBH2306002).References
[1] Moonen RP, van der Tol P, Hectors SJ et al. Spin-lock MR enhances the detection sensitivity of superparamagnetic iron oxide particles. Magn Reson Med 2015;74(6):1740–1749.
[2] Wang QF, Xiao H, Yu XC et al. R1ρ at high spin-lock frequency could be a complementary imaging biomarker for liver iron overload quantification. Magn Reson Imaging 2021;75:141–148.
[3] MaYJ, Carl M, Searleman A et al. Three dimensional adiabatic T1ρ prepared ultrashort echo time cones (3D AdiabT1ρ UTE-Cones) sequence for whole knee imaging. Magn Reson Med 2018; 80(4):1429–1439.
Figures