3301
Ultrashort echo time R1ρ for detection of rat liver iron overload at 11.7T MRI1Institute of Science and Technology for Brain-Inspired Intelligence, Fudan University, Shanghai, China, 2Department of Radiology, Ruijin Hospital, Shanghai Jiao Tong University School of Medicine, Shanghai, China, 3Human Phenome Institute, Fudan University, Shanghai, China, Shanghai, China
Synopsis
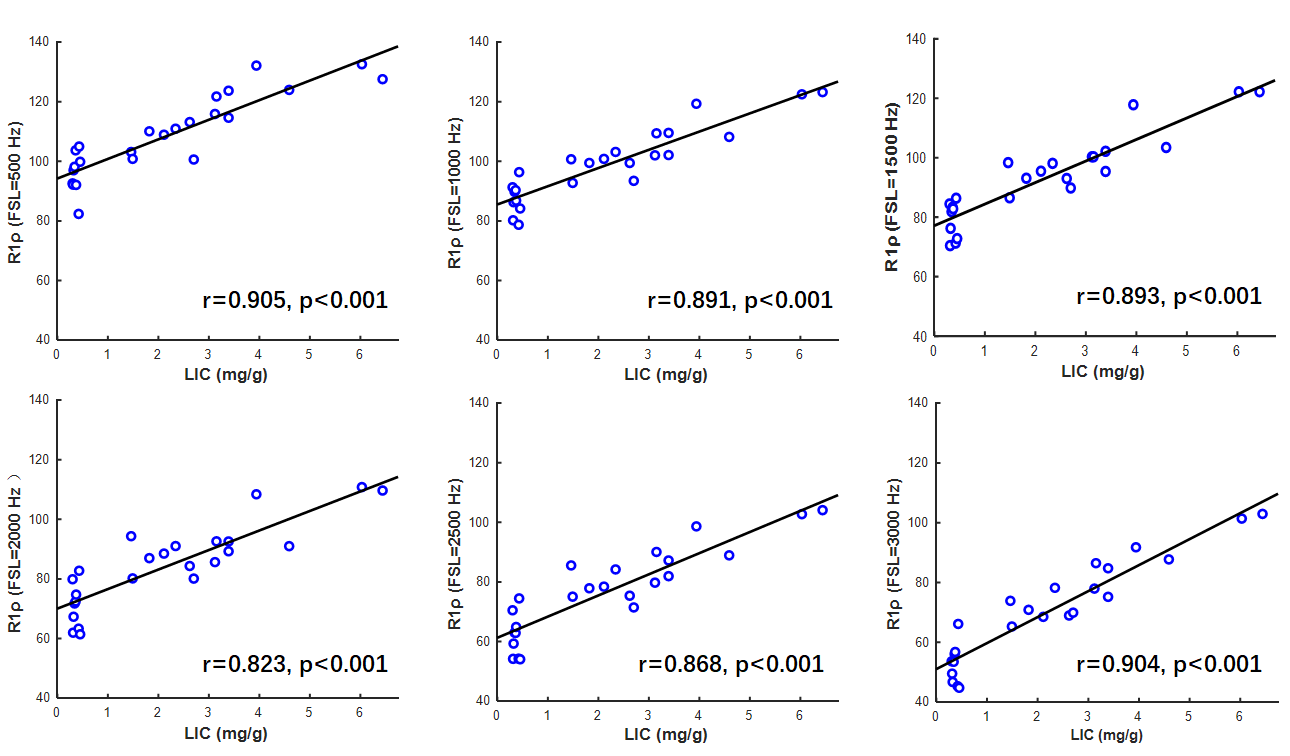
In this study, R1ρ images of 24 rat liver samples were acquired with 2D UTE-R1ρ pulse sequences. The results showed that mean R1ρ values displayed dispersion, with decrease in R1ρ at higher FSLs. Spearman’s correlation analysis (two-tailed) indicated that the R1ρ values were significantly associated with liver iron concentration at all 6 spin-lock frequencies (all r > 0.8 and all P < 0.001).
Introduction
It has been reported that changes of R1ρ were highly linear with iron concentration and more sensitive than R2 [1]. Our recent study suggested that the R1ρ (=1/T1ρ) values were significantly associated with liver iron concentration (LIC) at high spin-lock frequency (FSL) [2]. The most prominent effect of iron is decrease in the T2/T2* relaxation time of tissues, thus, the iron-overload liver shows little signal with conventional R1ρ sequences, which typically have echo times of several milliseconds or longer. Whereas, with Ultrashort echo time R1ρ (UTE-R1ρ) imaging sequences, signal can be detected from structures with predominantly short T2/T2*. However, it is unclear whether the UTE-R1ρ technique can be used to estimate iron deposition at ultra-high fields. In this study, we investigate the feasibility of using UTE-R1ρ to characterize liver iron deposition with different spin-lock frequencies at 11.7T.Method
Twenty-four male Sprague-Dawley rats were administered 0, 25, 50, and 100 mg/kg body weight iron dextran (Sigma, 100 mg Fe/ml). After one week, all rats were euthanized with isoflurane. A portion of the largest hepatic lobe was extracted to quantify the LIC by inductively coupled plasma (ICP), and the remaining liver tissue was stored in 4% buffered paraformaldehyde for 24 h before MRI.MRI was performed on an 11.7T Bruker Biospec with a Tx/Rx quadrature coil. Spin-lock preparation with 2D UTE readout pulse was developed to quantify R1ρ. The UTE-R1ρ sequence was acquired with the following parameters: FOV=45×45 mm2, matrix=128×128, slice thickness=1 mm on a single slice (the largest liver slice). TR=300 ms, TE=0.37 ms, FA=900. Six different spin lock times (TSL=1, 10, 20, 30, 40, 50 ms), and 6 different spin-lock frequencies (FSL=500, 1000, 1500, 2000, 2500, 3000 Hz).
Pixel-by-pixel mono-exponential fitting of the signal intensities algorithm at different TSL was performed using Matlab (MathWorks, Natick, MA). All statistical evaluations were performed using SPSS Statistics software (20.0, Chicago, IL, USA). A P< 0.05 was considered statistically significant.
Results and discussions
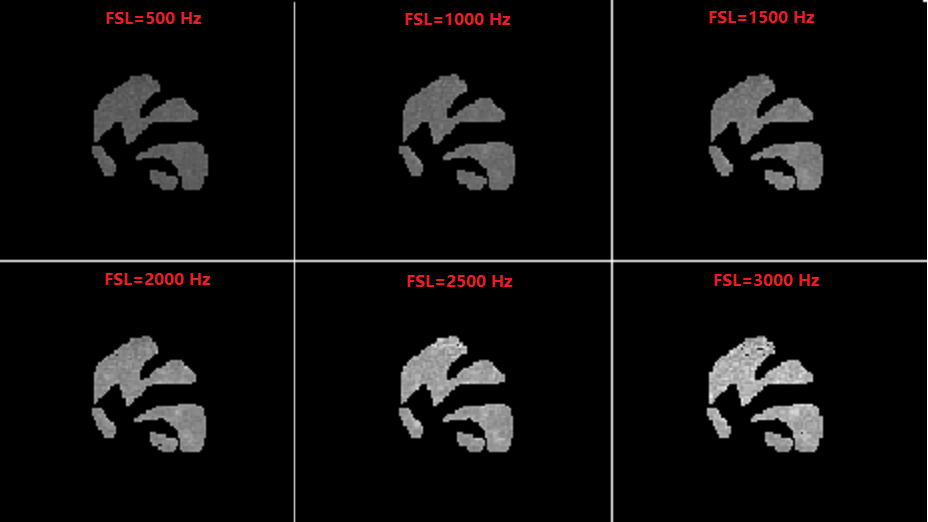
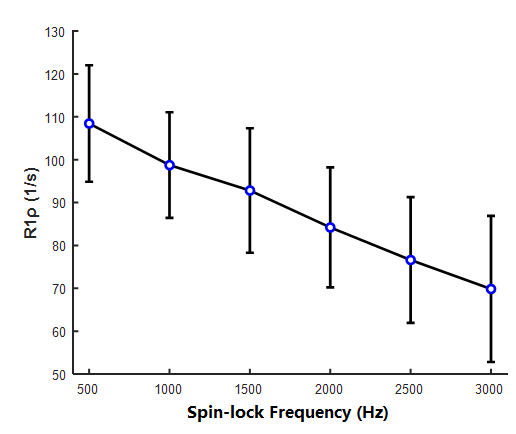
Figure 1 showed an example of quantitative T1ρ maps with UTE-T1ρ sequence at different FSLs. The mean R1ρ value displayed dispersion, with decreasing R1ρ observed toward higher FSLs (Figure 2), which is consistent with previous reports [1,2]. Spearman’s correlation analysis (two-tailed) indicated that the R1ρ values were significantly correlated with LIC at all FSLs (all r > 0.8 and all P < 0.001, Figure 3).Because T2/T2* shortens as iron concentration increases, conventional T1ρ sequences are limited in the detection range for T1ρ in tissues. Ultrashort echo time sequence with echo times 10 times shorter than echo time of conventional sequence can detect signal from the short T2/T2* tissues. UTE T1ρ imaging has been reported for achilles tendon, meniscus, and knee [3-5], but for liver iron deposition has not yet been reported. In our recent study, a strong association was observed between R1ρ and LIC at high FSLs with RARE-R1ρ sequence, but no significant correlation was found between R1ρ and LIC at FSL = 500, 1000, 1250, and 1500 Hz. The current study found that R1ρ values were associated with LIC for relatively low spin-lock fields (e.g. FSL=500 Hz), indicating UTE-R1ρ may more sensitive than RARE-R1ρ to liver iron quantification.
Conclusions
The current study represents a strong association between UTE-R1ρ and LIC further confirming our previous findings. The results indicated that the UTE-R1ρ technique can detect iron deposition in the liver, and provides a potential sensitive biomarker for the diagnosis and prognosis of liver iron overload.Acknowledgements
This work was supported by the National Natural Science Foundation of China (No. 81971583, No. 81671649), Shanghai MunicipalScience and Technology Major Project (No.2017SHZDZX01, No.2018SHZDZX01, VBH2306002).References
[1] Moonen RP, van der Tol P, Hectors SJ et al. Spin-lock MR enhances the detection sensitivity of superparamagnetic iron oxide particles. Magn Reson Med 2015;74(6):1740-1749.
[2] Wang QF, Xiao H, Yu XC et al. R1ρ at high spin-lock frequency could be a complementary imaging biomarker for liver iron overload quantification. Magn Reson Imaging 2021;75:141-148.
[3] Ma YJ, Carl M, Searleman A et al. Three dimensional adiabatic T1ρ prepared ultrashort echo time cones (3D AdiabT1ρ UTE-Cones) sequence for whole knee imaging. Magn Reson Med 2018; 80(4):1429-1439.
[4] Ma YJ, Carl M, Shao H, et al. Three-dimensional Ultrashort Echo Time Cones T1ρ (3D UTE-Cones-T1ρ) Imaging. NMR Biomed 2017;30(6).
[5] Du J, Carl M, Diaz E, et al. Ultrashort TE T1rho (UTE T1rho) imaging of the Achilles tendon and meniscus. Magn Reson Med 2010; 64(3):834-842.
Figures