3299
A comparison of two B1+ mapping methods for 3D VFA T1 mapping in the liver at 3T1Oxford Centre for Clinical Magnetic Resonance Research, Radcliffe Department of Medicine, University of Oxford, Oxford, United Kingdom, 2Perspectum, Oxford, United Kingdom
Synopsis
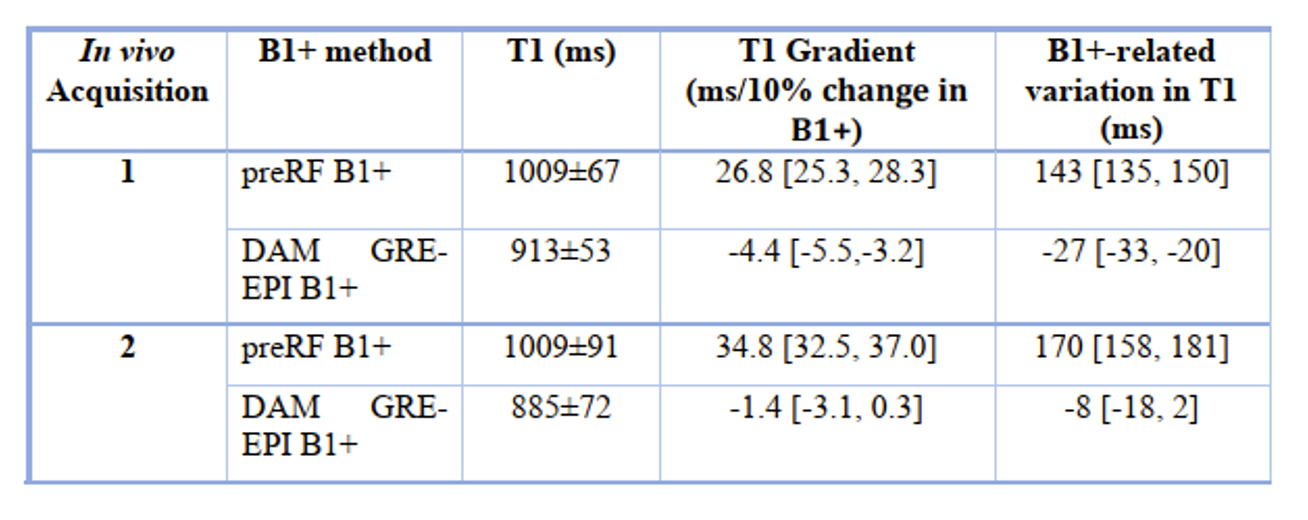
Correcting B1+ inhomogeneities is imperative in T1 mapping using a VFA 3D SPGR sequence. We compared B1+ mapping using a preconditioning RF (preRF) pulse and TurboFLASH readout against B1+ mapping using a 2D double angle method (DAM) with EPI readout. The preRF method had a residual B1+-related variation in the T1 maps of 143ms, 95% CI [135, 150] and 170ms, 95% CI [158, 181] for 2 healthy volunteers while the DAM reduced these, with B1+-related variations of -27ms, 95% CI [-33, -20] and -8ms, 95% CI [-18, 2].
INTRODUCTION
Several methods exist to measure the spatial transmit radio-frequency (RF) field (B1+) inhomogeneities, responsible for variations in the excitation flip angle (FA). Some have been adopted by vendors and exist as customer product sequences. B1+ mapping methods are required for mapping the longitudinal relaxation (T1) in the liver at 3T when using a 3D variable flip angle (VFA) spoiled gradient recalled echo (SPGR) pulse sequence1,2. Errors in B1+ mapping will result in roughly twice the fractional error in T13. Siemens offers a B1+ mapping method based on a preconditioning RF pulse (preRF) with a TurboFLASH readout4. We compared T1 maps obtained in vivo using the preRF B1+ map against a double angle method (DAM)5 B1+ map with EPI readout.METHODS
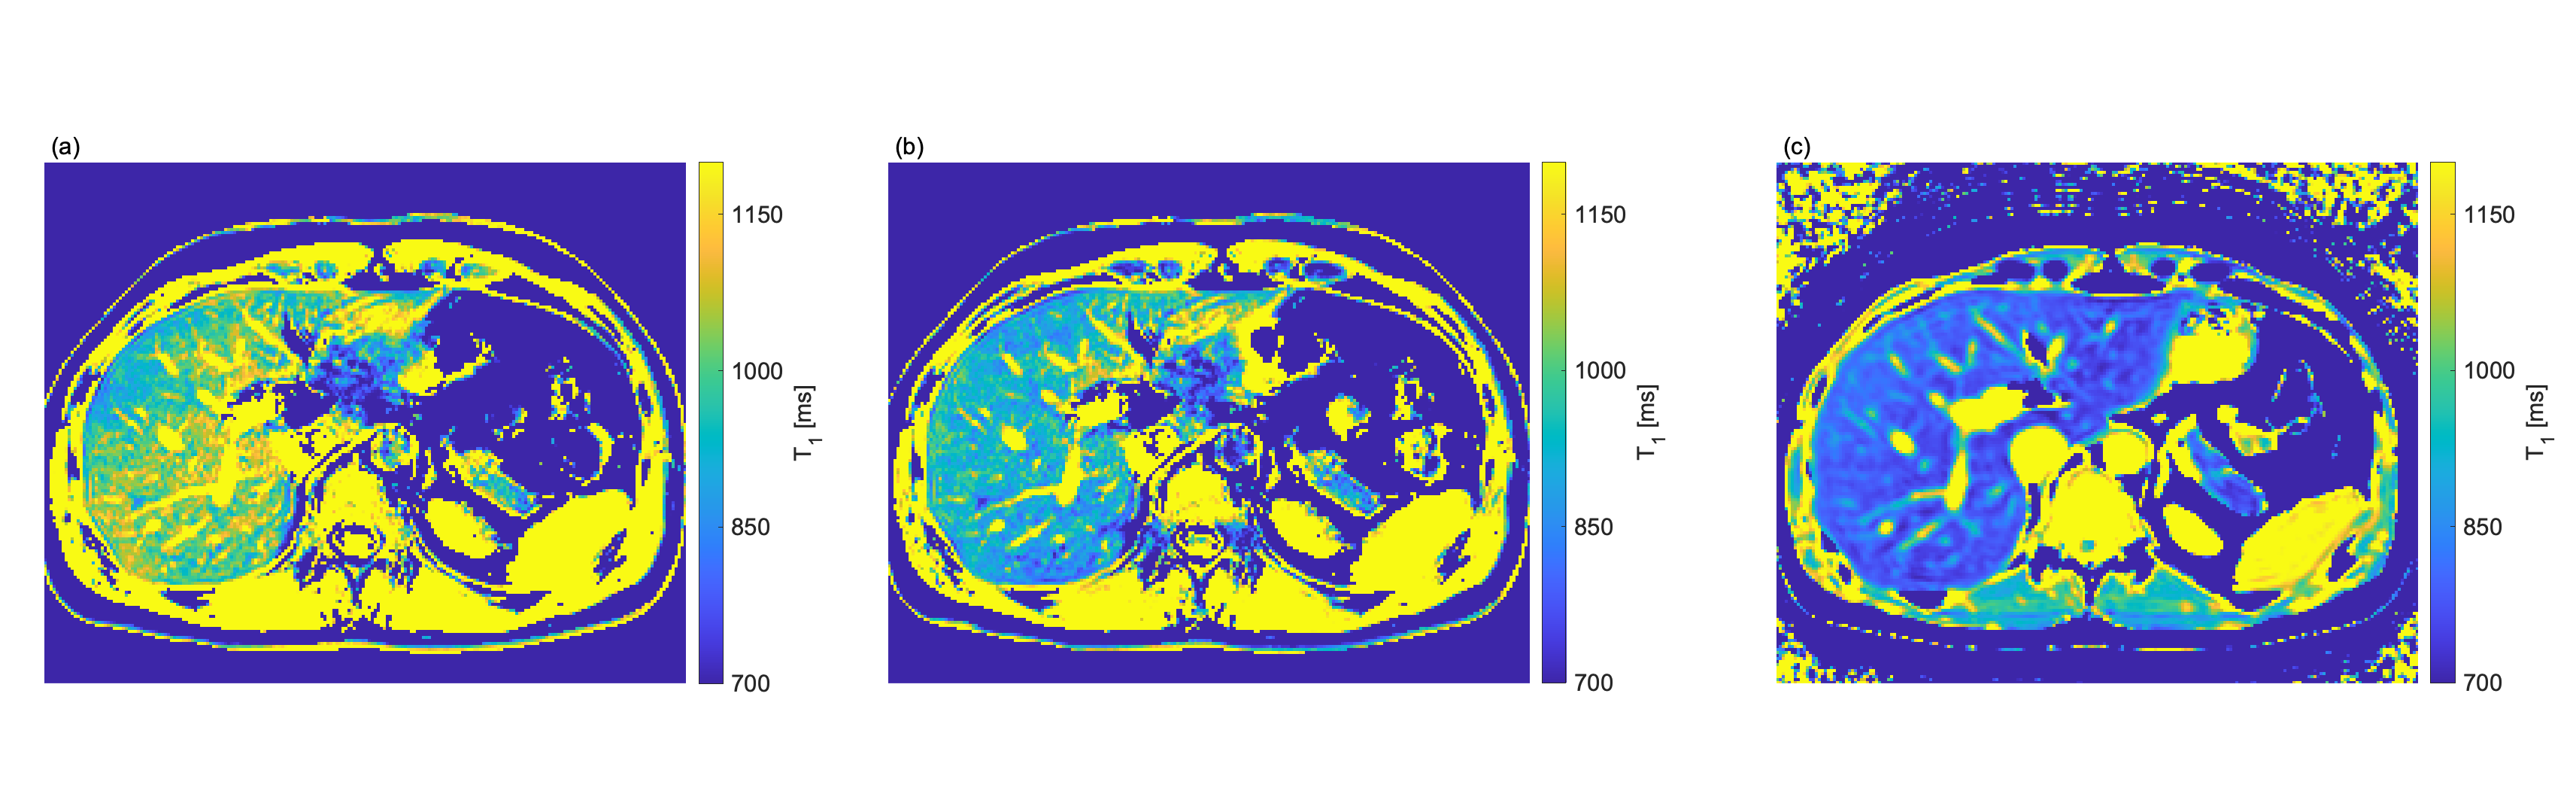
Two healthy volunteers were scanned on a 3T Prisma Siemens (Siemens Healthineers, Erlangen, Germany) scanner, using a spinal coil and an 18-channel body coil. The preRF B1+ map imaging parameters were: FOV=450×450 mm2, matrix=64×64, slice thickness of 8 mm, 1 slice, TR/TE=10000/1.41 ms, with fat saturation. The preconditioning RF pulse has a nominal flip angle of 80° and a readout flip angle of 8˚. The DAM B1+ map used a 2D multi-slice gradient-echo (GRE) echo-planar-imaging (EPI) readout with a nominal FA pair of 65°/130°. Acquisition parameters were: FOV=450×366 mm2, matrix=64×52×15, slice thickness/gap of 8/2 mm, TR/TE=10000/11 ms, with fat saturation. A B0 map was calculated from a 2D multislice double echo sequence. The echo times were 4.78/7.17 ms, TR=20 ms, FA=15°, FOV=450×380mm2, matrix=64×54×15 with a slice thickness/gap of 8/2 mm. EPI distortions were corrected through fsl fugue toolbox6,7. Multiple 3D VFA SPGR volumes with Dixon fat/water separation were acquired with: FOV=450×366×3mm3, matrix=320×260×48, TR/TEs=4.1/[1.23,2.46] ms, FAs 2˚,2°, 3°, 15°, 15°, Caipirinha with 3 times acceleration in the slice direction.A MOLLI T1 was acquired to demonstrate the homogeneity of liver T1s expected in healthy volunteers. The imaging parameters were: FOV=440×330mm2, matrix=384×288, slice thickness of 8 mm, TR/TE=2.6/1.07 ms, nominal readout FA of 35˚, inversion times of [100, 180, 260, 1100, 2100, 3100, 4100, 5100] ms.
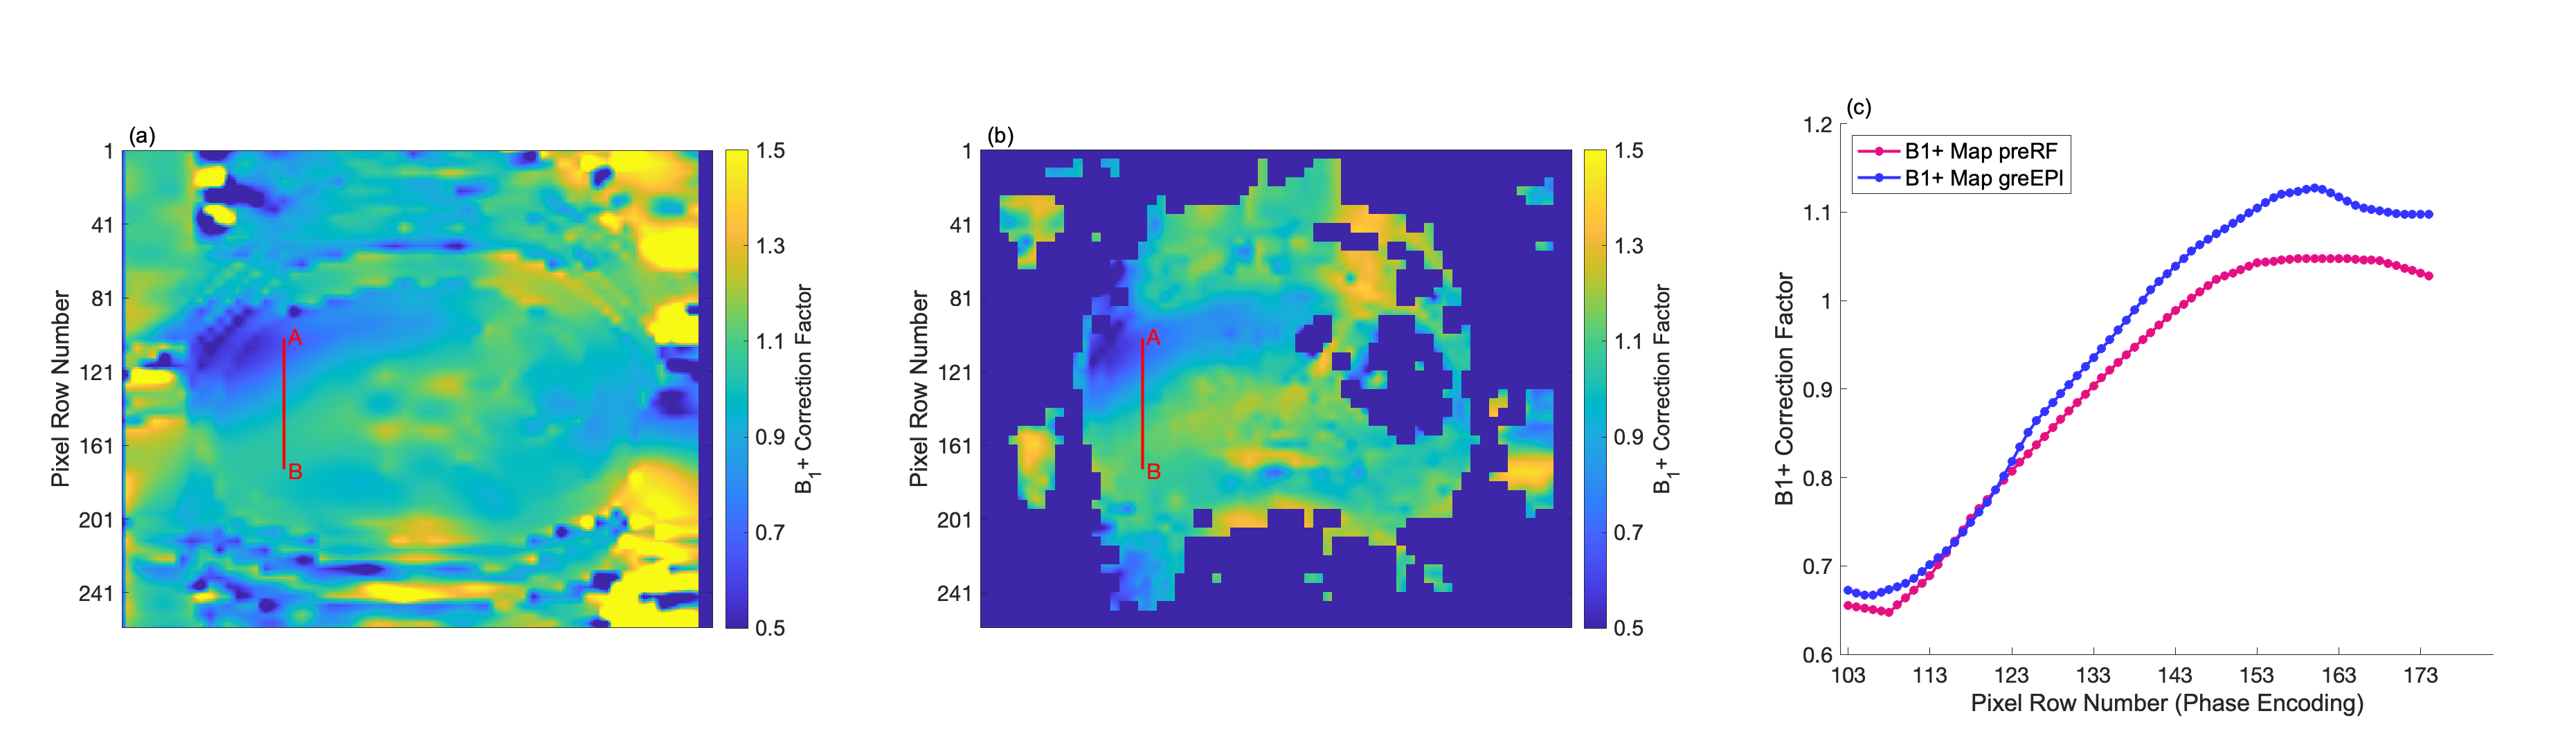
The preRF B1+ map is directly output by the scanner. The DAM B1+ correction factor was calculated from the ratio between the distortion corrected GRE-EPI FA 130˚ and FA 65˚ images, accounting for slice profile effects from the excitation pulse used8. This correction factor was then applied to the nominal FAs acquired in the 3D SPGR sequence. The T1 maps were calculated by fitting the signal acquired at each FA to the steady state SPGR function through a non-linear least-squares regression using MATLAB.
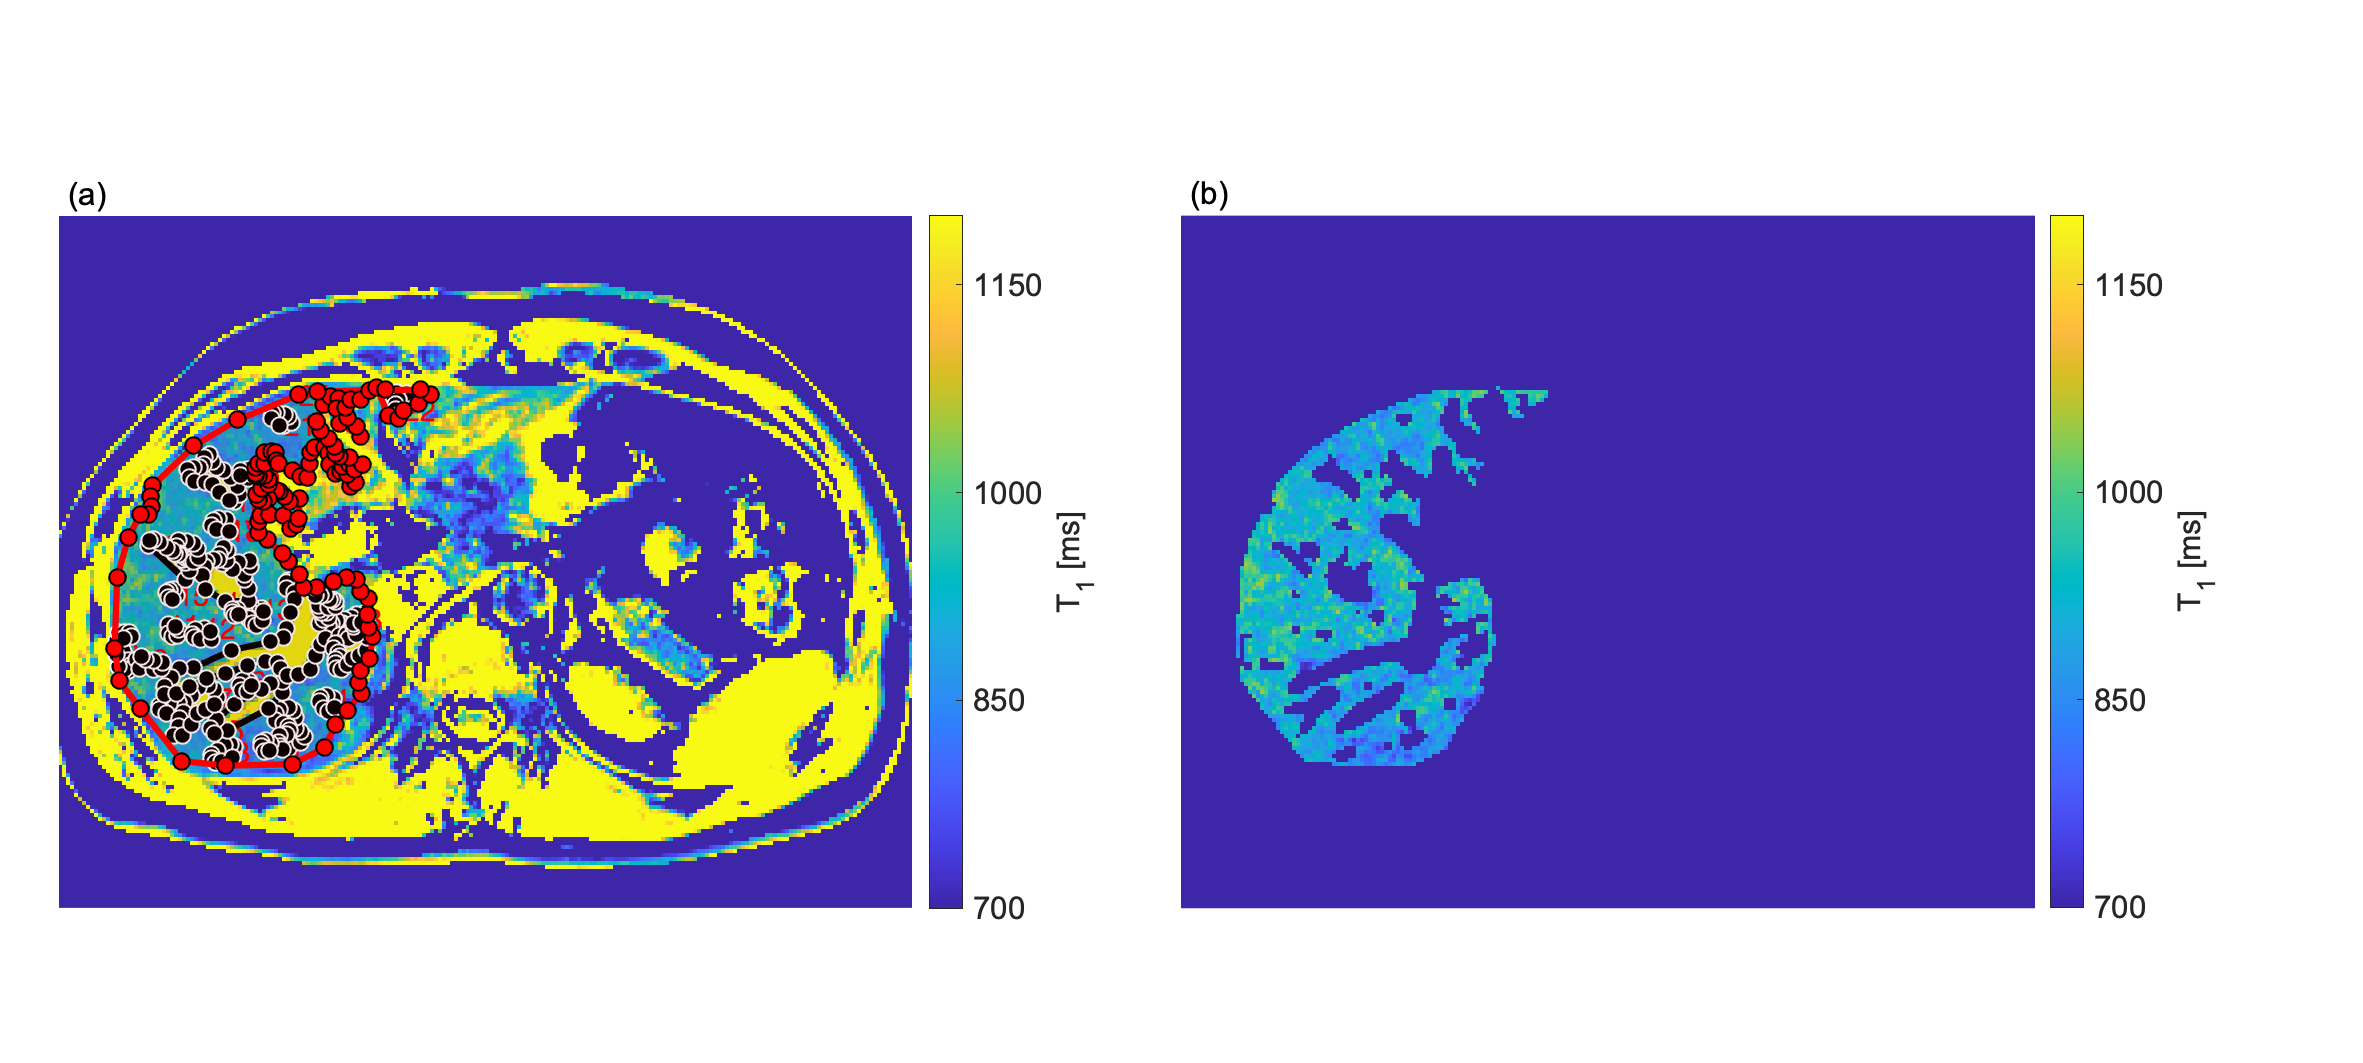
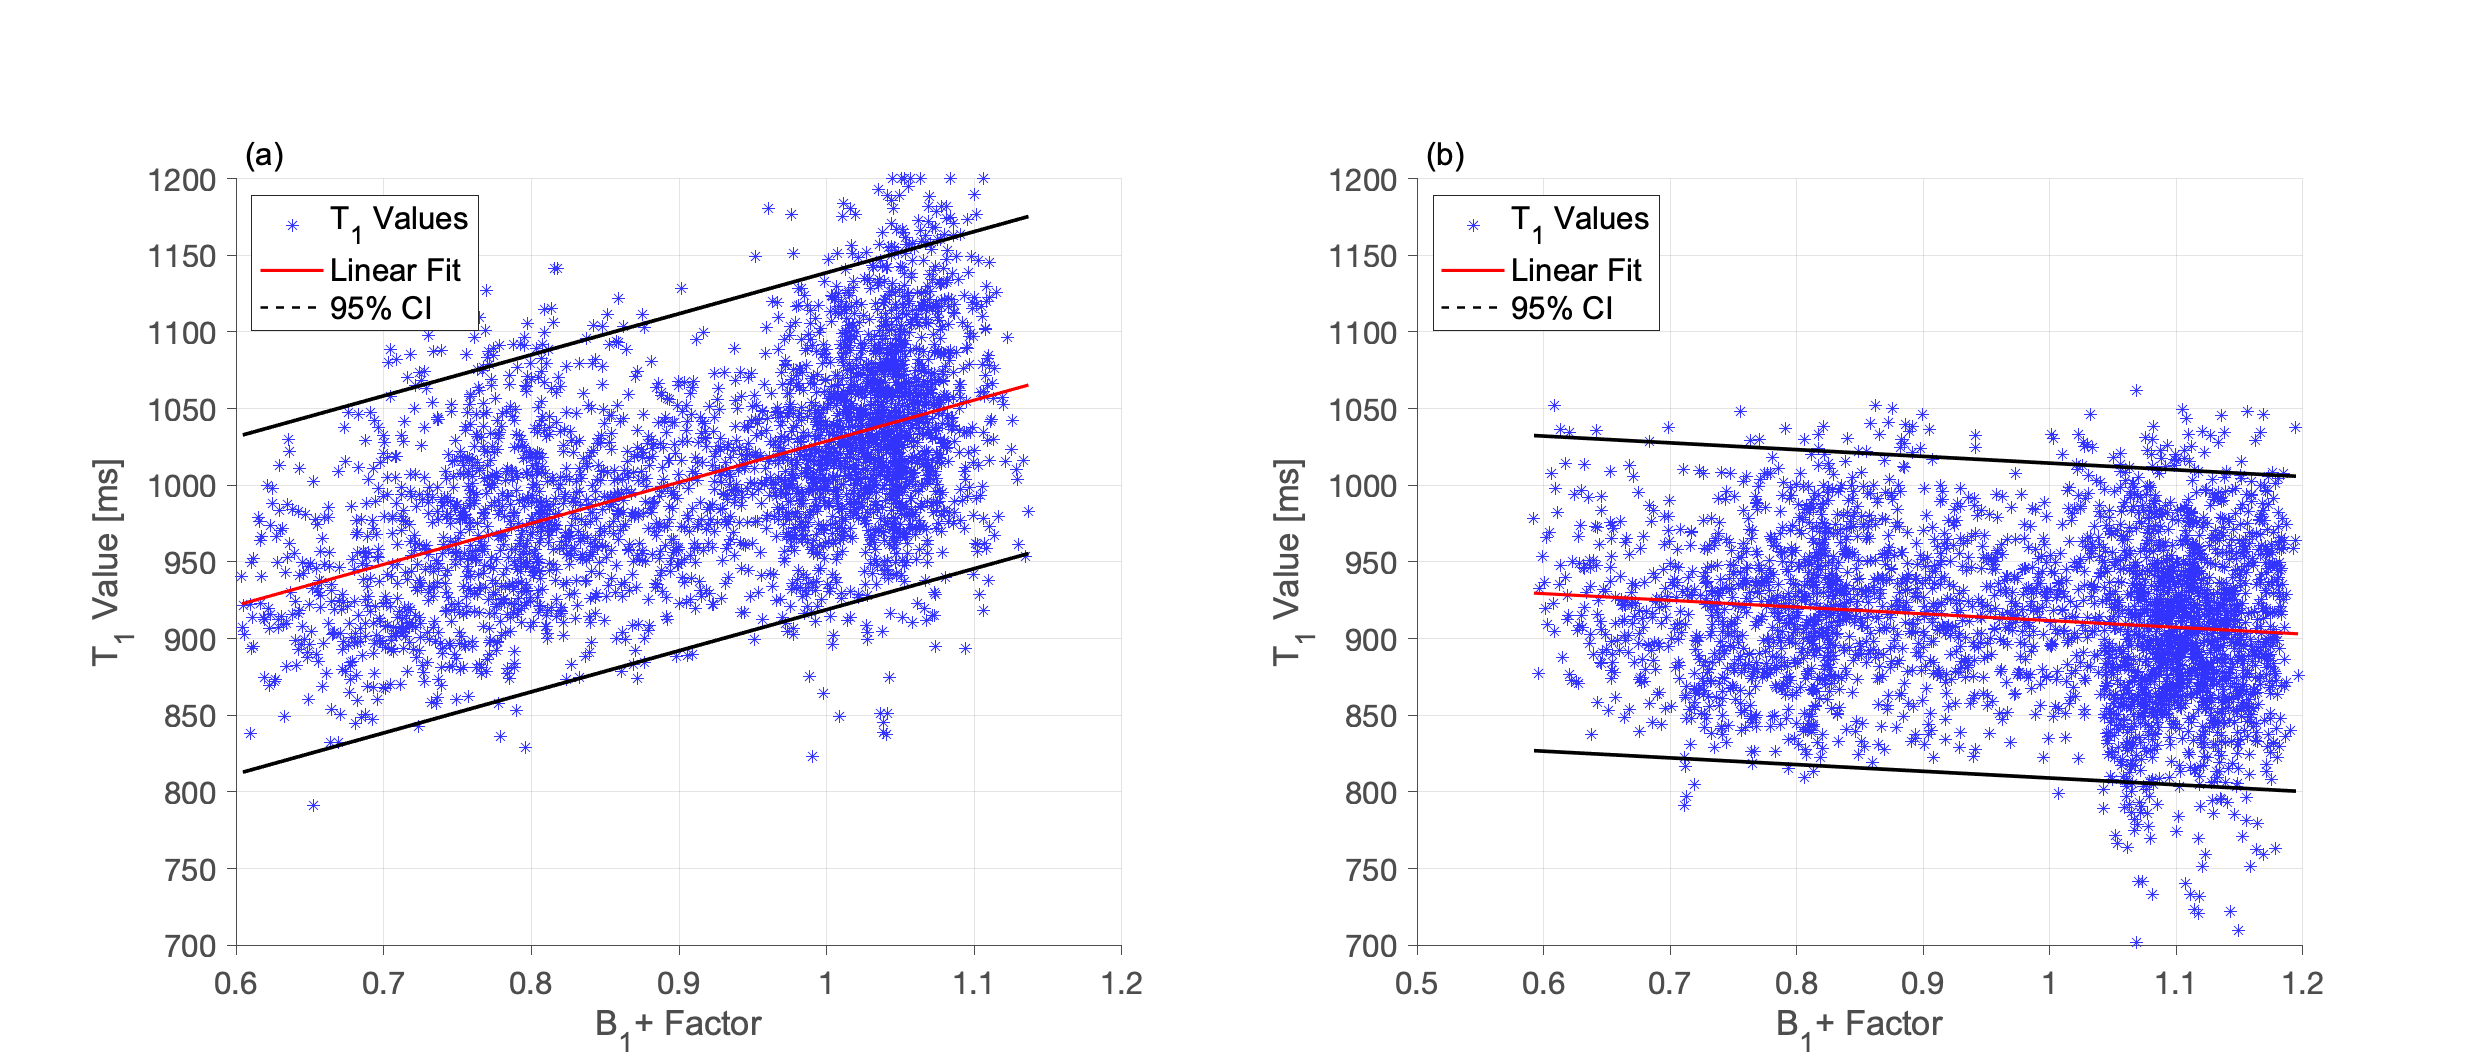
To compare liver T1 maps employing the two different B1+ map methods, a mask (Figure 2 (a) and (b)) enclosing the liver and excluding the vessels was applied to both the B1+ and T1 maps. The correlation between the T1 and the B1+ maps was assessed by plotting T1 as a function of the corresponding B1+. A linear fit of the T1 and B1+ values allows extraction of a slope that, multiplied by the range of B1+ values, gives a measure of the B1+-related variation in liver T1.
RESULTS AND DISCUSSION
The T1 maps for volunteer one corrected with the preRF B1+ map and the DAM GRE-EPI B1+ map are shown in Figure 1 (a) and (b), respectively. Visually, the preRF B1+ map yields a more heterogeneous T1 map with an overall higher T1. The MOLLI T1 map demonstrated homogeneous T1 within the healthy liver parenchyma, as expected (Figure 1 (c)). Note that MOLLI underestimates T1 values9.Figure 3 shows the correlation of T1 with B1+ factor for pixels within the masked T1. Using the DAM GRE-EPI B1+ map (Figure 4 (b)) to correct the FAs there is a low correlation between T1 and B1+ as confirmed by the small B1+-related variation in T1 (Table 1) for both volunteers. However, using the preRF B1+ map (Figure 4 (a)) a large residual B1+-related variation remains in the T1 map. This extra heterogeneity could confound liver fibrosis staging10.
CONCLUSION
Accurate B1+ mapping is required for quantitative T1 mapping using VFA SPGR. The presence of a significant correlation between T1 and B1+ maps is a warning that the B1+ map is not sufficiently correcting the T1 maps. Here, we present evidence that this is the case for the preRF B1+ mapping sequence in the liver at 3T. However, a DAM GRE-EPI sequence mostly eliminates the B1+ inhomogeneities from the T1 maps. Given it relies on a basic GRE sequence with an EPI readout, it could be routinely employed clinically on vendor-agnostic scanners for T1 mapping. This would facilitate comparison of liver T1s in multi-centre studies.Acknowledgements
No acknowledgement found.References
1. Venkatesan R., Lin W., Haacke M., Accurate Determination of Spin-Density and TI in the Presence of RF-Field Inhomogeneities and Flip-Angle Miscalibration. Magn. Reson. Med. 1998, 40(4): 592-602
2. Cheng H. L., Wright G. Rapid High-Resolution T1 Mapping by Variable Flip Angles: Accurate and Precise Measurements in the Presence of Radiofrequency Field Inhomogeneity. Magn. Reson. Med. 2006, 55(3): 566–574.
3. Helms G., Dathe H., Dechent P., Quantitative FLASH MRI at 3T Using a Rational Approximation of the Ernst Equation. Magn. Reson. Med. 2008, 59(3): 667–672.
4. Chung S., Kim D., Breton E., Axel L., Rapid B11 Mapping Using a Preconditioning RF Pulse with TurboFLASH Readout. Magn Reson Med. 2010; 64(2): 439-446.
5. Stollberger R., Wach P. Imaging of the Active B1 Field in Vivo. Magn. Reson. Med. 1996; 35(2): 246-251
6. Jezzard P., Balaban R., Correction for geometric distortion in echo planar images from B0 field variations. Magn. Reson. Med. 1995; 34(1): 65-73
7. Jenkinson M., Improved unwarping of EPI images using regularised B0 maps. Neuroimage 2001; 13(6): 165
8. Hargreaves B., “Bloch Equation Simulator.” http://mrsrl.stanford.edu/~brian/blochsim/. [Accessed: 27-Jun-2019]
9. Gai N., et al. Modified Look-Locker T1 evaluation using Bloch simulations: Human and phantom validation. Magn. Reson. Med. 2013; 69(2): 329-36
10. Banerjee R., et al. Multiparametric magnetic resonance for the non-invasive diagnosis of liver disease., J Heaptal. 2014; 60(1): 69-77
Figures