3298
The application of B1 corrected VFA T1-mapping in staging of liver fibrosis1Department of Magnetic Resonance, LanZhou University Second Hospital, LanZhou, China, 2MR Scientific Marketing, Siemens Healthineers, Shanghai, China
Synopsis
The aim of this study was using B1 corrected native T1 value to assess their diagnostic accuracy for staging of liver fibrosis. We found that native T1 values increased with the level of liver fibrosis, and a positive correlation was found between liver FibroScan results and the native T1 values. In conclusion, the B1 corrected native T1 values might be useful for staging of liver fibrosis.
Introduction and purpose
Traditionally, the staging of liver fibrosis can be based on biopsy and/or transient elastography. However, to find an acknowledged noninvasive imaging methods for quantifying liver fibrosis is still a challenge. There are many studies[1-3] reported to evaluate the value of gadolinium⁃ethoxybenzyl⁃diethylenetriamine pentaacetic acid enhanced T1-mapping to assess the staging of liver fibrosis. Meanwhile few study evaluate the potential of native T1-mapping before. Our study aimed to evaluate the potential and accuracy of B1 corrected native T1 value in staging of liver fibrosis, and its correlation with FibroScan results.Materials and Methods
Twenty-nine patients underwent MR examinations on a 1.5T MR scanner (MAGNETOM Aera, Siemens Healthcare, Erlangen, Germany) using a combination of 18-channel body and 12-channel spine matrix coil elements. T1mapping using B1 inhomogeneity–corrected VFA VIBE method was obtained with the following parameters: TE 2.08ms, TR 4.33 ms, flip angle: 3,15 degrees, FOV: 380 × 332 mm2, matrix: 156 × 256, slice thickness: 3.5 mm, number of slices: 72, acquisition time: 19 s. To correct B1 heterogeneity, a B1 mapping pulse sequence was implemented to acquire a B1 field map of the entire liver using the stimulated echo/spin echo method before VFA T1 mapping. The native T1 values were measured on the T1 image parameter maps on a Syngo.Vsia system (Siemens Healthineers).The histopathologic diagnosis of liver fibrosis (S) and necroinflammatory activity (G) was confirmed by liver biopsy. Twenty-seven patients of them underwent transient elastography examination (TE), from them we get fibroscan to evaluate the elasticity of liver tissue. Figure 1 showed the example of placing region of interest (ROI).Results
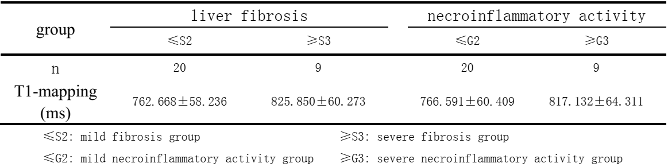
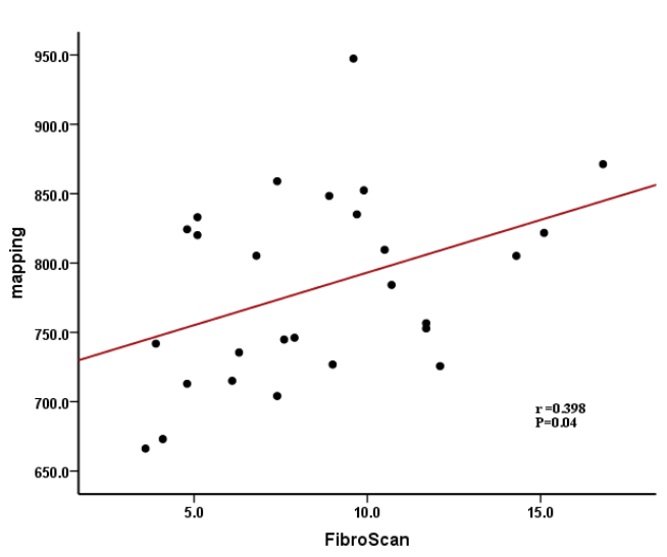
The mean values and standard deviation(SD) of native T1 values of the different staging of liver fibrosis and necroinflammatory activity is showed in Table 1. The native T1 values were significantly higher in the severe fibrosis (≥S3) than that of mild fibrosis (≤S2),P=0.013, Which suggest that the native T1 values may be helpful for staging of liver fibrosis. Meanwhile, the native T1 values were higher in the severe necroinflammatory activity (≥G3) than that of mild activity (≤G2),but the difference was not statistically significant, P=0.51. The correlation of native T1 values with FibroScan was showed in figure 2. There was a significant correlation between them, r=0.398, P=0.04.Discussion and conclusion
Our study showed that native T1 values can be useful in staging of liver fibrosis. The correlation of native T1 values with FibroScan was positive, r=0.398, P=0.04. The result was the same as in previous studies [4,5], that’s because the collagen deposition can prolong the T1 values. Some studies [6,7] indicated that inflammation, iron concentration, and steatosis could also influence the measurement, but in our study, the native T1 values in different stage of necroinflammatory activity has no significant difference. That may prove that the collagen deposition place an important role in the changing of T1 values. While multicenter trials with larger sample sizes are needed to confirm our findings. In addition, it is a simple approach for liver fibrosis quantification that dose not depend on intravenous contrast injection. In conclusion, our results show that native T1 values had potential value for staging of liver fibrosis.Acknowledgements
This article is supported by the Lanzhou Chengguan District Science and Technology Plan Project (No. 2019SHFZ0037)References
1. Sheng RF, Wang HQ, Yang L, et al. Assessment of liver fibrosis using T1 mapping on Gd-EOB-DTPA-enhanced magnetic resonance. Digestive and Liver Disease 2017: 49: 789-795
2. Jiang Y, Qiu WJ, Zhou ZP. The application of Gd-EOB-DTPA-enhanced MRI T1 mapping and its research progresses in hepatic diseases. Int J Med Radiol 2019: 42: 208-211
3. Qiu T, Zhang ZQ, Chen WB, et al. MRI in the quantitative evaluation of hepatic fibrosis in patients with hepatitis B. Chin J Radiol, 2019:53: 1081-1085
4. Ramachandran P, Serai SD, Veldtman GR et al, Assessment of liver T1 mapping in fontan patients and its correlation with magnetic resonance elastography-derived liver stiffness. Abdom Radiol 2019 44(7):2403–2408
5. Li JN, Liu HH, Zhang CY, et al. Native T1 mapping compared to ultrasound elastography for staging and monitoring liver fibrosis: an animal study of repeatability, reproducibility, and accuracy. European Radiology 2020 30(1): 337-345
6. Dekkers IA, Lamb HJ (2018) Clinical application and technical considerations of T1 & T2(*) mapping in cardiac, liver, and renal imaging. Br J Radiol 91:20170825
7. Chow AM, Gao DS, Fan SJ et al. Measurement of liver T1 and T2 relaxation times in an experimental mouse model of liver fibrosis. J Magn Reson Imaging 2012 36(1): 152-158
Figures
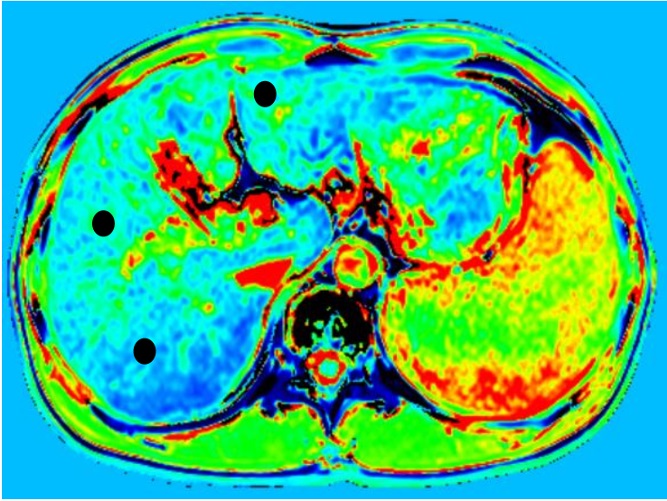
Figure 1, Examples of region of interest (ROI) placement in a patient graded as G1S1. Three ROIs were placed in the different area of liver to measure the T1 relaxation time(● represent the ROI )