3296
Transversal Relaxometry of a Mixture of Iron Compounds at Different Concentrations1Dept. of Diagnostic Radiology, Ulm University, Medical Center, Ulm, Germany, 2Section for Experimental Radiology, Ulm University, Medical Center, Ulm, Germany, 3Institute for Inorganic Chemistry II, Ulm University, Ulm, Germany
Synopsis
Liver R2* determined with a breath hold GRE sequence is commonly used to address liver iron content in vivo. However, iron occurs in the body bound to various chemical substances. To study influence of chemical composition on R2* on a clinical MRI scanner, we scanned mixtures of two iron compounds, polymer coated nanoparticles on the one hand and diluted Fe3+ ions on the other, at different concentrations of both compounds. We found that the relaxivity of one compound depended on the concentration of the other, suggesting that the interactions between compounds are more complex than previously assumed.
Background
R2* relaxometry is a common method to determine liver iron concentration in vivo. However, different iron compounds show different R2* dependence on iron concentration, i.e. different relaxivities.This work was performed to study concentration-dependent R2* of mixtures containing two different iron compounds.
Methods
Polymer coated Fe3O4 superparamagnetic nanoparticles (NP) functionalized with COOH, 6 nm in diameter (type UMC 3001, lot #13573), were purchased from Bangs Laboratories (Warrington, PA) and diluted in purified water. Together with FeCl3, NPs were mixed with agarose in 16 ml vials to obtain probes suitable for MRI. Total concentrations were adjusted to seven different levels ranging from 0 to 0.1 mg/g for NP and six concentrations, 0 to 3 mg/g, for FeCl3. All probes were placed in a holder filled with agarose gel to enable GRE scanning. MR scans were performed on a 1.5 T Somatom Avanto scanner (Siemens Healthcare, Erlangen, Germany). Multi-slice multi-echo GRE was performed at TR/FA of 120 ms / 50°, a minimum TE of 1.1 ms and 12 echos at an echospacing of 1 ms. Additional acquisitions were performed with minimum TEs of 1.3, 1.5, 1.7 and 1.9 ms at the same echospacing to achieve an effective echospacing of 0.2 ms when combining all acquisitions. GRE signals as a function of TE were measured by ROIs manually placed on each probe which were copied to all TEs and acquisitions. For each combination of concentrations, 8 slices were analyzed. Median values of ROIs were fitted to a monoexponential decay function, while MR image noise was accounted for, as proposed by Jensen et al.1 by calculating the square root of sum-of squares of ideal signal and noise signal Snoise$$S_{fit} = \sqrt { (S_{0} e^{(TE*{R_{2}}^{*})} )^2 + {S_{noise}}^2 }$$
with scaling factor S0, transversal relaxation rate R2* and Snoise as fit parameters using a nonlinear Leverberg-Marquardt least-squares fitting algorithm. Fits exceeding predefined thresholds of residual errors or Snoise were excluded from further analysis. Transversal relaxation rates R2* as function of concentration of one compound were plotted with the concentration of the other compound as parameter. Coefficients of determination R2 and regression parameters for all linear combinations between compound concentration and R2* were determined. Relaxivities of each compound, i.e. slope of the regression line R2* vs. concentration were determined, as well as regression line intercepts, and dependencies on the concentration of the other compound were studied.
Results
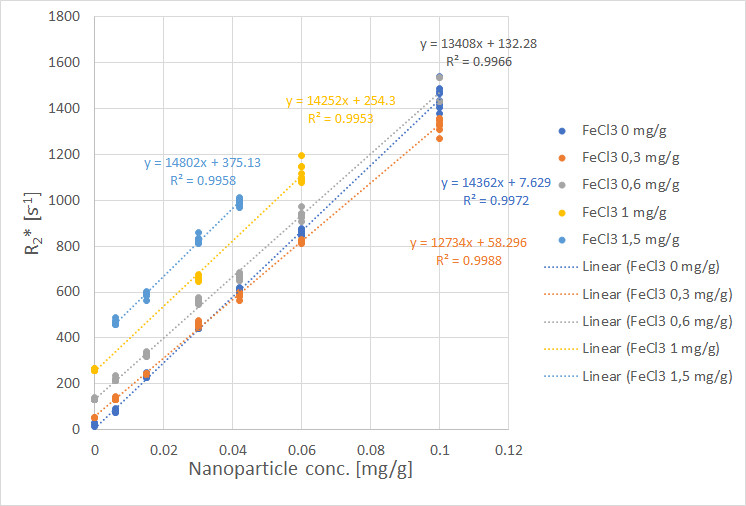
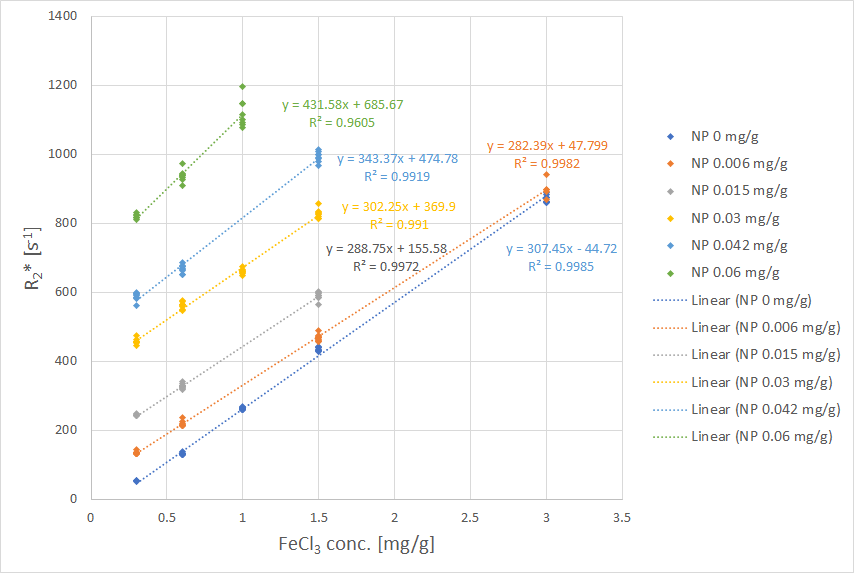
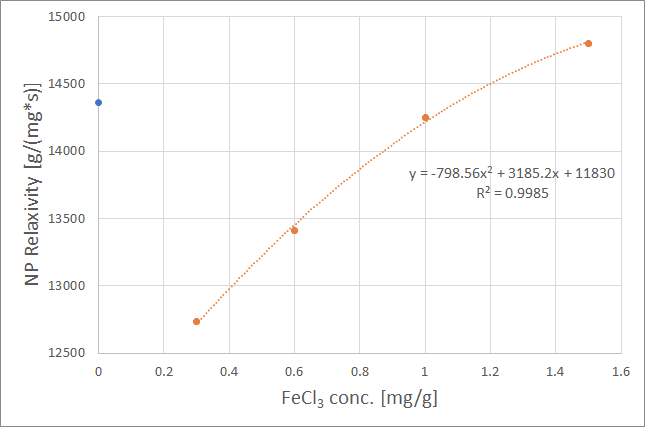
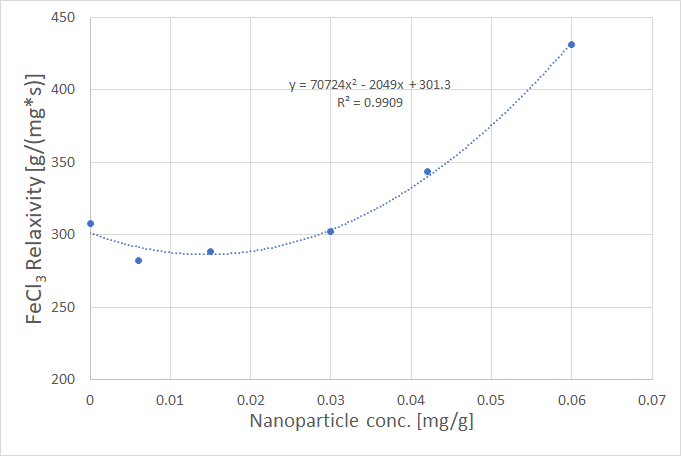
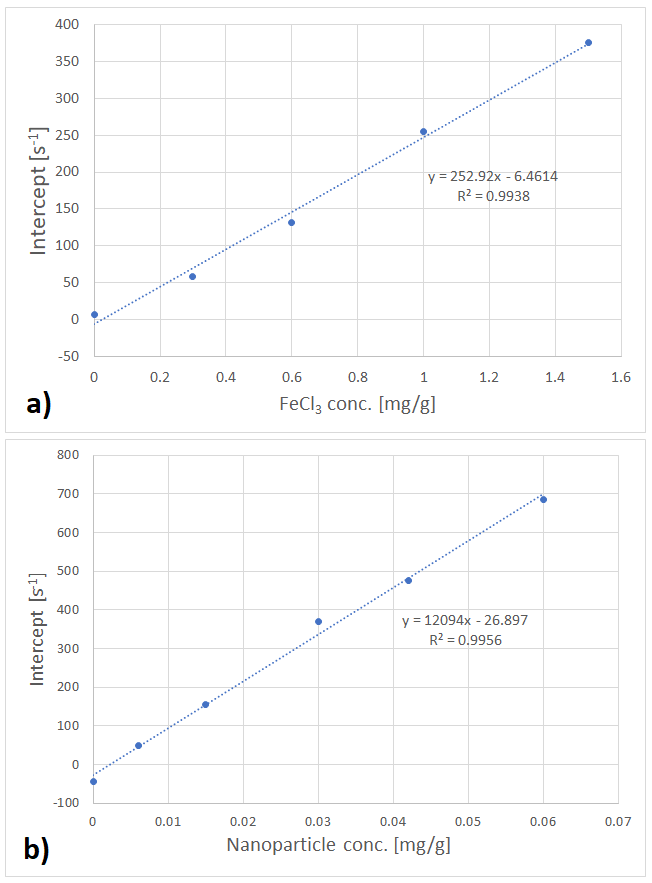
Fits performed best in the R2* range from 100 s-1 to 800 s-1. Uncertainties increased for R2* above 800 s-1, seen from the spread of data points in Figs. 1 and 2. Fig. 1 shows R2* of iron compound mixtures as a function of nanoparticle concentration, Fig. 2 the correspondent values as a function of FeCl3 concentration. All dependencies of R2* on concentration were linear with R2 close to 1. Fig. 3 shows nanoparticle relaxivities as a function of FeCl3 concentration. Unexpectedly, nanoparticle relaxivity was not constant but depended on concentration of added FeCl3. On the other hand, as Fig. 4 shows, the same was observed for relaxivity of FeCl3 in the presence of nanoparticles. Both dependencies could be approximated by a quadratic function, however, in the case of nanoparticles only if omitting their relaxivity without added FeCl3. Intercepts showed a linear dependence on concentration of added compound, cf. Fig. 5.Discussion
Excessive body iron is the cause for several serious diseases. Iron accumulates in the liver, where it is stored as hemosiderin in immobilized form. Nanoparticles have been suggested previously as a model for this form of storage iron1.In our study, iron concentrations of nanoparticles were chosen lower than for FeCl3 since Fe2+/Fe3+ ions in nanoparticles are immobilized in a solid phase, causing an increase in relaxivity by about a factor of about 50 compared to Fe3+ ions in aqueous solution in the case of FeCl3. Also, concentrations were chosen not to exceed transverse relaxation rates R2* of 1500 s-1 assumed as maximum for acquisition parameters used. To reliably quantify larger R2*, the minimum TE, limited by scanner hardware, was too long.
The chemical more aggressive FeCl3 was used instead of the less reactive FeCl2 since Fe2+ ions show much lower relaxivity than Fe3+ ions2.
It is generally known that transversal relaxation rate R2* depends linearly on the concentration of a substance, e.g. contrast agent, with the relaxivity of this substance as slope of the regression line. Our work showed the dependency of one iron compound's relaxivity on the concentration of another iron compound. The linearity of R2* as function of a single compound’s concentration was excellent, therefore we regard our results reflect the truth. An approach to explain nonconstant relaxivity is that Fe3+ ions may absorb to the surface of the nanoparticles functionalized with COO-. At low Fe3+ concentrations, this might reduce NP relaxivity, but increase it at high concentrations. Computer simulations may be helpful to study this behavior in more detail.
Conclusion
It has been shown that in a mixture of different iron compounds relaxivities of one compound varied with the concentration of the other. This suggests that interactions of both compounds are more complex than previously assumed.Acknowledgements
No acknowledgement found.References
1 Jensen JH et al. Separate MRI Quantification of Dispersed (Ferritin-like) and Aggregated (Hemosiderin-like) Storage Iron. MRM 63:1201-09 (2010)
2 Dietrich O et al. MR imaging differentiation of Fe2+ and Fe3+ based on relaxation and magnetic susceptibility properties. Neuroradiology 59:403-409 (2017)
Figures