3295
Correlation between multi-echo ultrashort TE and mDIXON-quant imaging for R2* mapping in liver cirrhosis1The First Affiliated Hospital of Dalian Medical University, Dalian, China, 2Philips Healthcare, Dalian, China
Synopsis
Ultrashort echo time (UTE) imaging is a valuable technique for imaging short T2 and T2* samples. While the mDIXON-quant sequence enables reliable separation of water and fat signals, and measurement of fat fraction. With introduction of multiple echo acquisition, both the UTE and mDIXON-quant sequence can be used for measurement of the quantitative R2* values. This study investigated the correlation between R2* values measured by UTE and mDIXON-quant sequences. Results show that a moderate correlation between R2 values by the two methods, and R2* values measured by UTE were slightly higher than those by mDIXON-quant.
Short synopsis
The R2* values measured by ultrashort TE and mDIXON-quant sequences in patients with liver cirrhosis show a good agreement (r =0.767, P=0.000).Introduction
Ultrashort echo time (UTE) imaging is a valuable technique for imaging short T2 and T2* samples [1,2]. While the mDIXON-quant sequence enables reliable separation of water and fat signals, and measurement of fat fraction [3]. With introduction of multiple echo acquisition, both the UTE and mDIXON-quant sequence can be used for measurement of the quantitative R2* values. This study investigated the correlation between R2* values measured by UTE and mDIXON-quant sequences. This study aims to investigate the consistency of R2* values measured by the ultrashort TE and mDIXON-quant sequences in patients with liver cirrhosis.Methods
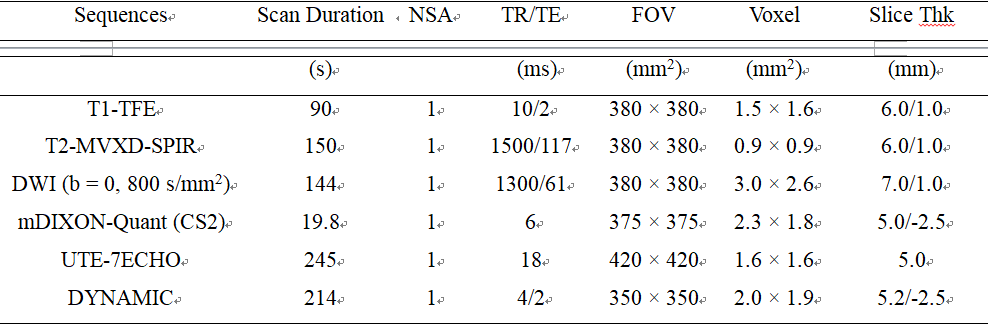
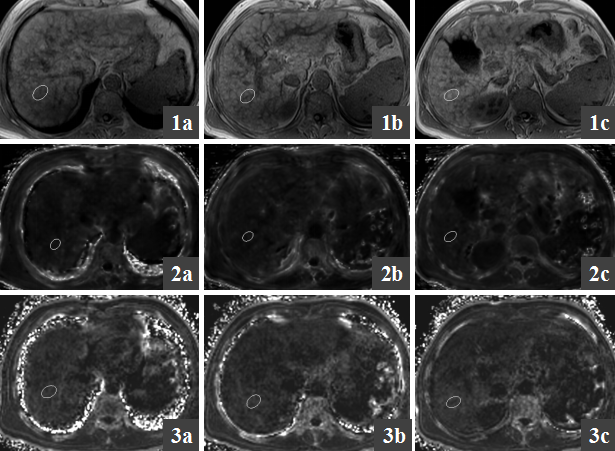
40 patients clinically diagnosed with liver cirrhosis were retrospectively selected for the is study. The data were acquired on a 3.0T MR scanner (Ingenia CX, Philips Healthcare, Best, the Nertheland) from May 2019 to October 2019. MR sequences of T1-TFE, T2-MVXD-SPIR, DWI (b=800), mDIXON-Quant, UTE-7ECHO and DYNAMIC were scanned with detailed parameters listed Table 1. 7 patients with liver postoperative patients or intrahepatic occupying disease were excluded. Finally, data from 33 liver cirrhosis patients were analyzed (23 males, 10 females, median age 56 [38-79] years), including 17 cases of post hepatitic cirrhosis, 10 cases of alcoholic cirrhosis, and 6 other causes of liver cirrhosis. R2* value of the upper right anterior lobe, right anterior lobe, and right posterior lobe of liver from both the UTE and mDIXON-quant sequences were measured by two observers (with 4 and 3years’ experience, respectively) on the Inteli Space Portal (Philips Healthcare) workstation (Figure.1). The mean value for the three regions was used for analyses. Pearson correlation coefficient was used to test the correlation between R2* values measured from UTE and mDIXON-quant sequences.Results
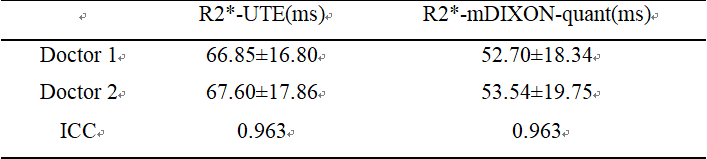
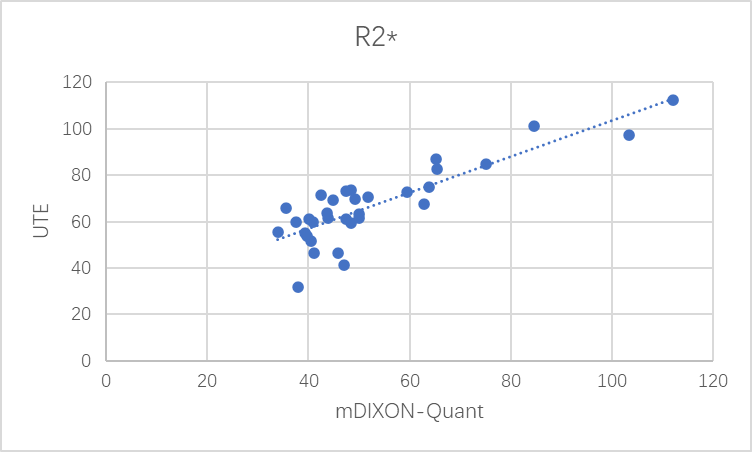
The interobserver measurement consistency was good for the R2* values measured with UTE (ICC = 0.963) and mDIXON-quant sequence (ICC = 0.987) (Table 2). The R2* values measured by UTE and mDIXON-quant were 66.85±16.80 and 52.70±18.34 ms, respectively. The R2* values measured by UTE were moderately correlated with those by mDIXON-Quant (r = 0.767, P = 0.000, Figure 2).Conclusion
A moderate correlation was observed between R2 values measured by the UTE and mDIXON-quant methods, and R2* values measured by UTE were slightly higher than those by mDIXON-quant.Acknowledgements
No acknowledgement found.References
1. Li Q, Cao X, Ye H, Liao C, He H, Zhong J. Ultrashort echo time magnetic resonance fingerprinting (UTE-MRF) for simultaneous quantification of long and ultrashort T tissues. Magn Reson Med. 2019 Oct;82(4):1359-1372..
2. Wu Q, Fu X, Zhuo Z, et al. The application value of ultra-short echo time MRI in the quantification of liver iron overload in a rat model[J]. Quant Imaging Med Surg. 2019, 9(2): 180-187.
3. Zhang Y, Wang C, Duanmu Y, et al. Comparison of CT and magnetic resonance mDIXON-Quant sequence in the diagnosis of mild hepatic steatosis[J]. Br J Radiol. 2018, 91(1091): 20170587.
Figures