3294
Bias, repeatability and reproducibility of liver T1 mapping with variable flip angles1Institute of Medical Physics, The University of Sydney, Sydney, Australia, 2Department of Biomedical Imaging Sciences, The University of Leeds, Leeds, United Kingdom, 3Department of Medical Physics and Engineering, Leeds Teaching Hospital NHS Trust, Leeds, United Kingdom, 4Cardiac MRI, Leeds Teaching Hospitals NHS Trust, Leeds, United Kingdom, 5MR Physics and Radiology, Cambridge University Hospitals NHS Foundation Trust, Cambridge, United Kingdom, 6Department of Radiology, University of Cambridge, Cambridge, United Kingdom, 7Department of Nuclear Medicine, Cambridge University Hospitals NHS Foundation Trust, Cambridge, United Kingdom, 8Bioxydyn, Manchester, United Kingdom, 9Department of Infection, Immunity and Cardiovascular Disease, University of Sheffield, Sheffield, United Kingdom
Synopsis
A multi-centre, multi-vendor study in 8 travelling healthy volunteers was conducted for technical validation of variable flip angle (VFA) T1 mapping in the liver across 6 scanners (3 vendors and 2 field strengths). The 95% CI was 28±8% for the bias in VFA liver T1, 10±3% for the intra-scanner repeatability CV and 28±6% for the inter-scanner reproducibility CV. These values are comparable to B1+ corrected VFA T1 in prostate, brain, and breast. Any proposed refinement of the VFA method in the liver should demonstrate a significant improvement on those benchmarks before it can be recommended as a future standard.
Introduction
Variable flip angle (VFA) methods offer fast, 3D T1 mapping, but their accuracy is affected by B1+ inhomogeneities, incomplete RF spoiling and magnetisation transfer (MT) effects1,2. These errors depend on scanner hardware and sequence optimisation, and affect intra-scanner repeatability and inter-scanner reproducibility. Technical recommendations increasingly promote inclusion of procedures such as B1+ correction, which come at a cost of extra acquisition time and computation, may not be routinely available and are themselves subject to measurement error. Any decision to include additional corrections in VFA T1 mapping should therefore be based on careful assessment of the cost/benefit ratio, but this is difficult to determine without robust benchmarks to measure the benefit. A number of reproducibility studies have been performed in organs such as the brain3,4, prostate5,6 and breast7, but none offer comprehensive coverage of vendors and field strengths. In application areas such as the liver, there is no data on the performance of VFA T1 mapping methods in a multi-vendor setting, despite their wide use in conditions such as liver fibrosis8,9, cirrhosis10, and DCE-MRI calibration11.The aim of this study was to establish a benchmark for the performance of standard VFA T1 mapping in the liver, which can subsequently be used to determine the added value of methodological refinements.Methods
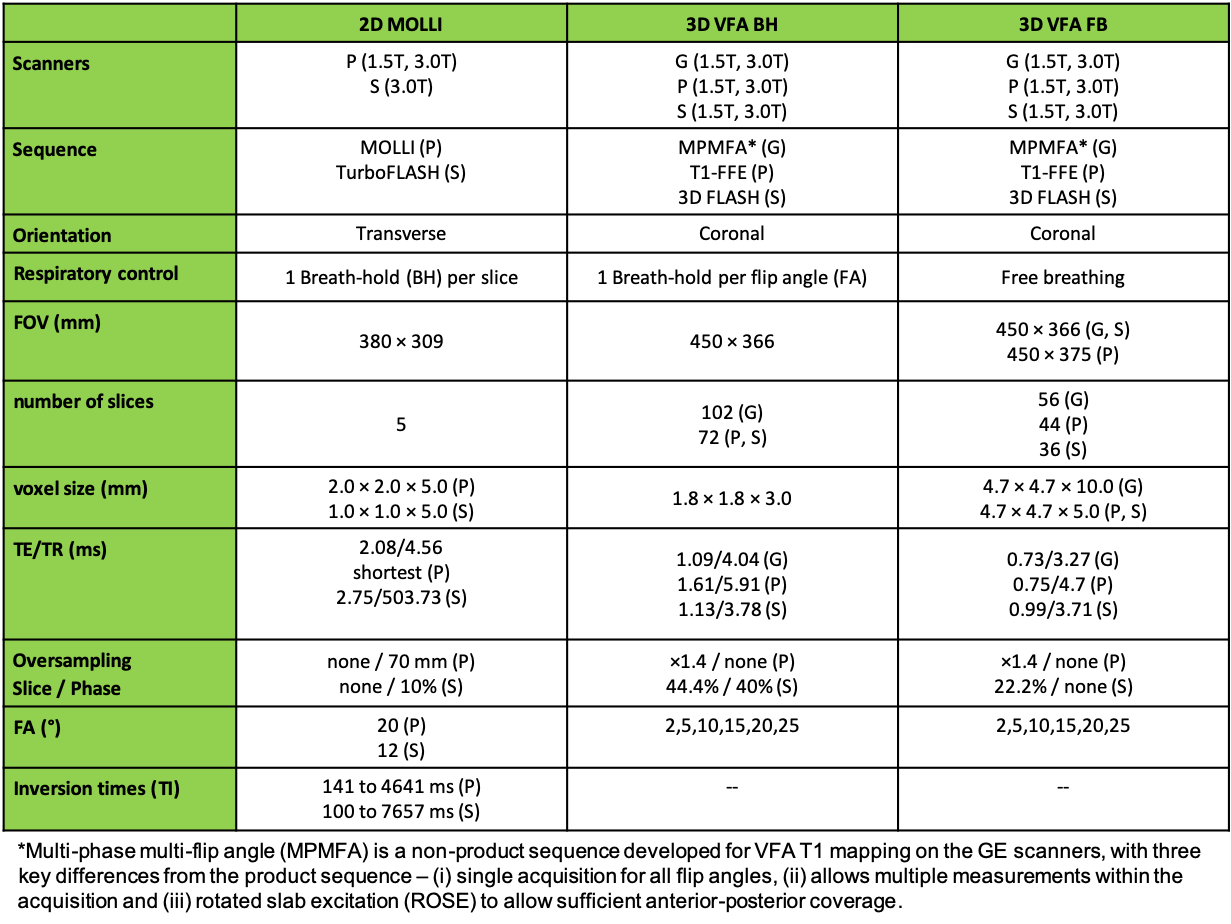
Eight healthy volunteers were scanned twice each on six MRI scanners from three vendors, GE Healthcare (G), Philips Medical Systems (P) and Siemens Healthineers (S), at two field strengths of 1.5T and 3.0T. The study was approved by the institutional ethics committee (University of Leeds, MREC17-111) and informed consent was obtained. Two differently optimized 3D SPGR VFA protocols (Table 1) were compared: a slow, breath-hold (~16 seconds) sequence (VFA BH) and a fast (~2 seconds, acquired continuously for up to 1 minute), free-breathing sequence (VFA FB). Where available, T1 mapping was also performed using a 2D MOLLI sequence. Images were processed centrally using PMI (https://github.com/plaresmedima/PMI-0.4). MOLLI and VFA T1 maps were obtained as described previously1,12. Continuously acquired free breathing VFA images were motion-corrected using non-rigid registration and averaged prior to VFA T1 mapping. Whole liver ROIs were manually drawn on the T1 maps on a single central slice and blood vessels were removed by thresholding. Median T1 values within the ROIs were extracted from each T1 map. Bias, repeatability and reproducibility were calculated for each volunteer as $$Bias(\%)=100\times\frac{T_{1,\text{averaged over scans 1 and 2}}-T_{1,reference}}{T_{1,reference}}$$$$RepeatabilityCV(\%)=100\times1.96\times\frac{\text{standard deviation}_{\text{scan 1, scan 2}}}{\text{average}_{\text{scan 1, scan 2}}}$$$$ReproducibilityCV(\%)=100\times1.96\times\frac{\text{standard deviation}_{\text{all vendors}}}{\text{average}_{\text{all vendors}}}$$ Reference T1 values in the liver were obtained from literature (812 ms at 3.0T, 576 ms at 1.5T)13. Separate pairwise reproducibility CVs were also calculated for the three possible pairs of vendors. Mean bias, repeatability, and reproducibility, and their 95% confidence interval (CI) were calculated. Mean values were compared using repeated measures ANOVA. When the p-value was less than 0.05, post-hoc pairwise t-tests were performed.Results
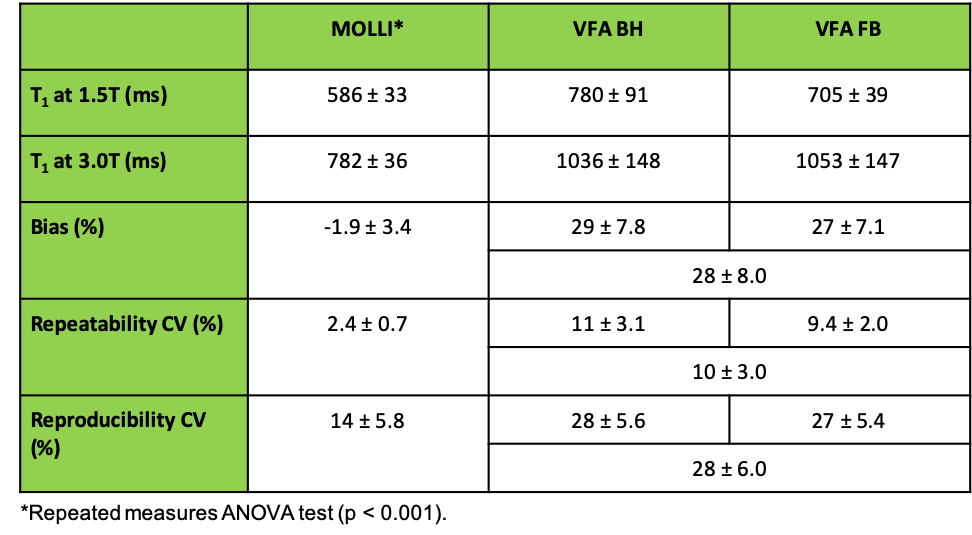
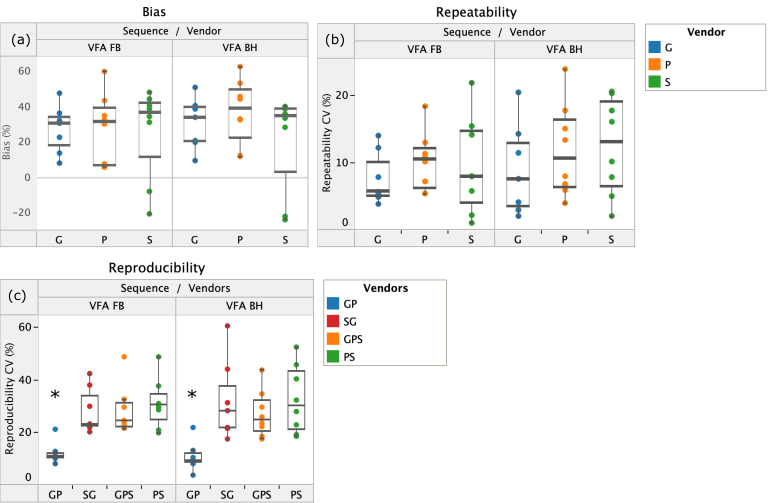
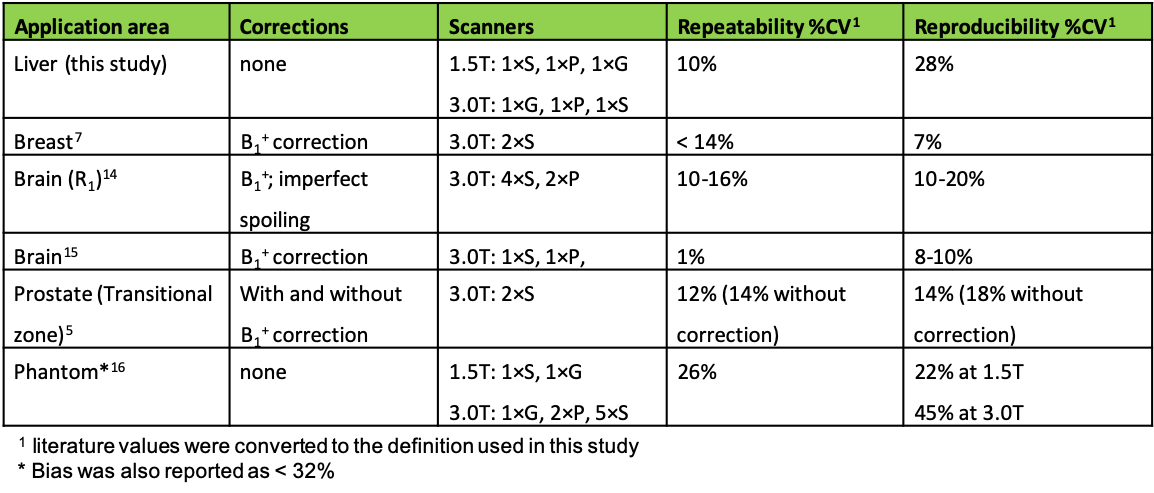
VFA T1 values in the liver were significantly overestimated compared to MOLLI T1 at both field strengths. The 95% CI on mean bias, repeatability, and reproducibility of VFA liver T1 was 28 ± 8 %, 10 ± 3% and 28 ± 6%, respectively. Performance of MOLLI T1 values was significantly better (Table 2). No significant difference between the two VFA methods was found. Figure 1 shows bias, repeatability, and reproducibility of VFA T1 values, separately calculated for each vendor. Pairwise reproducibility was significantly lower for the vendor pair (G, P) compared to (G, S) and (S, P) (p < 0.001). No other significant differences were found between vendors. Table 3 compares repeatability and reproducibility of liver VFA T1 against literature values in brain, breast, and prostate. Reproducibility CV of liver T1 was 8% higher than the largest values reported in volunteers and repeatability CV was intermediate.Discussion
Results from this liver VFA T1 mapping study are comparable to studies in more static organs, despite the use of routine cartesian sequences and no corrections for B1+ effects, imperfect spoiling, MT effects or other confounders. This liver study is also the only volunteer study with equal weighting of three vendors and two field strengths. Comparison of two studies in the brain14,15 indicates that the use of a narrower sample of vendors and fields can significantly underestimate inter-scanner variability. This is also evident by the significant improvement in reproducibility observed in our study when one vendor is excluded. Single-scanner studies have shown strong correlation between VFA and MOLLI T1 in the liver17,18 after B1+ correction. It is plausible therefore to assume that B1+ and other corrections can further improve the performance of VFA T1 mapping in the liver. However, the relatively small differences between this study and other results in the literature indicate that the room for further improvement may not be large. It is critical therefore, that the value of proposed corrections is benchmarked against the results presented here before they are recommended for VFA T1 mapping in the liver.Conclusion
Bias, repeatability and reproducibility of VFA T1 mapping in the liver in a multi-vendor setting have been reported for the first time. The value of future corrections for B1+ inhomogeneities, imperfect RF spoiling and MT effects can be assessed against the benchmark established in this study.Acknowledgements
This work is funded by Innovative Medicines Initiative 2 Joint Undertaking, Grant Agreement number 116106. This joint undertaking receives support from the European Union’s Horizon 2020 research and innovation programme and EFPIA.References
1. Stikov N, Boudreau M, Levesque IR, Tardif CL, Barral JK, Pike GB. On the accuracy of T1 mapping: searching for common ground. Magn Reson Med. 2015;73: 514–522.\newline
2. A G Teixeira RP, Malik SJ, Hajnal JV. Fast quantitative MRI using controlled saturation magnetization transfer. Magn Reson Med. 2019;81: 907–920.
3. AG Teixeira RP, Neji R, Wood TC, Baburamani AA, Malik SJ, Hajnal JV. Controlled saturation magnetization transfer for reproducible multivendor variable flip angle T1 and T2 mapping. Magn Reson Med. 2020;84: 221–236.
4. Boudreau M, Tardif CL, Stikov N. B1 mapping for bias‐correction in quantitative T1 imaging of the brain at 3T using standard pulse sequences. J Magn Reson. 2017;46: 1673-1682.
5. Zhong X, Shakeri S, Liu D, Sayre J. Repeatability and reproducibility of variable flip angle T1 quantification in the prostate at 3 T. J Magn Reson. 2019;49: 1730-1735.
6. Rangwala NA, Dregely I, Wu HH, Sung K. Optimization and evaluation of reference region variable flip angle (RR-VFA) B1+ and T1 Mapping in the Prostate at 3T. J Magn Reson Imaging. 2017;45: 751–760.
7. Panda A, Chen Y, Ropella-Panagis K, Ghodasara S, Stopchinski M, Seyfried N, et al. Repeatability and reproducibility of 3D MR fingerpringting relaxometry measurements in normal breast tissue. J Magn Reson Imaging. 2019;50: 1133-1143.
8. Xu X, Zhu H, Li R, Lin H, Grimm R, Fu C, et al. Whole-liver histogram and texture analysis on T1 maps improves the risk stratification of advanced fibrosis in NAFLD. Eur Radiol. 2020. doi:10.1007/s00330-020-07235-4.
9. Li Z, Sun J, Hu X, Huang N, Han G, Chen L, et al. Assessment of liver fibrosis by variable flip angle T1 mapping at 3.0T. J Magn Reson Imaging. 2016;43: 698–703.
10. Besa C, Bane O, Jajamovich G, Marchione J, Taouli B. 3D T1 relaxometry pre and post gadoxetic acid injection for the assessment of liver cirrhosis and liver function. Magn Reson Imaging. 2015;33: 1075–1082.
11. Georgiou L, Penny J, Nicholls G, Woodhouse N, Blé F-X, Hubbard Cristinacce PL, et al. Quantitative Assessment of Liver Function Using Gadoxetate-Enhanced Magnetic Resonance Imaging: Monitoring Transporter-Mediated Processes in Healthy Volunteers. Invest Radiol. 2017;52: 111–119.
12. Messroghli DR, Radjenovic A, Kozerke S, Higgins DM, Sivananthan MU, Ridgway JP. Modified Look-Locker inversion recovery (MOLLI) for high-resolution T1 mapping of the heart. Magn Reson Med. 2004;52: 141–146.
13. Stanisz GJ, Ewa EO, Pun J, Escaravage M, Graham SJ, Bronskill MJ and Henkelman MR. T1, T2 Relaxation and Magnetization Transfer in Tissue at 3T. Magn Reson Med. 2005;54: 507–12.
14. Leutritz T, Seif M, Helms G, Samson RS, Curt A, Freund P, et al. Multiparameter mapping of relaxation (R1, R2*), proton density and magnetization transfer saturation at 3 T: A multicenter dual-vendor reproducibility and repeatability study. Hum Brain Mapp. 2020;41: 4232-4247.
15. Lee Y, Callaghan MF, Acosta-Cabronero J, Lutti A and Nagy Z. Establishing Intra- and Inter-Vendor Reproducibility of T1 Relaxation Time Measurements with 3T MRI. Magn Reson in Med. 2019;81: 454–65.
16. Bane O, Hectors SJ, Wagner M. Accuracy, repeatability, and interplatform reproducibility of T1 quantification methods used for DCE‐MRI: Results from a multicenter phantom study. Magnetic resonance. 2018;79: 2564-2575.
17. Tirkes T, Zhao X, Lin C, Stuckey AJ, Li L, Giri S, et al. Evaluation of variable flip angle, MOLLI, SASHA, and IR-SNAPSHOT pulse sequences for T 1 relaxometry and extracellular volume imaging of the pancreas and liver. Magn Reson Mater Phys Biol Med. 2019;32: 559–566.
18. Kim JE, Kim HO, Bae K, Choi DS, Nickel D. T1 mapping for liver function evaluation in gadoxetic acid--enhanced MR imaging: comparison of look-locker inversion recovery and B1 inhomogeneity--corrected variable flip angle method. Eur Radiol. 2019;29: 3584–3594.
Figures