3293
Survey of water proton longitudinal relaxation in liver in vivo.
John Charles Waterton1,2
1Centre for Imaging Sciences, University of Manchester, MANCHESTER, United Kingdom, 2Bioxydyn Ltd, MANCHESTER, United Kingdom
1Centre for Imaging Sciences, University of Manchester, MANCHESTER, United Kingdom, 2Bioxydyn Ltd, MANCHESTER, United Kingdom
Synopsis
Liver R1 was surveyed in vivo in 3464 subjects at 16 field strengths from 106 publications. R1 was plotted against B0 and fitted both to a biophysical model, and to a log-log heuristic. An investigator who wishes to compare their own findings with prior literature, and who finds their average liver R1 to be within 9% of our fit, with between-subject CoV <8%, can conclude that their study is consistent with the majority of the literature.
Background
The liver longitudinal water proton relaxation rate R1 is important for several reasons. It is a biomarker of liver pathology, and baseline R1 is essential for the derivation of several other biomarkers. However, measurements of R1 in individual livers or liver regions suffer from both systematic errors and random errors. Systematic errors (bias) arise because methods of measurement are suboptimal. Other systematic deviations occur when methods depend differently on liver composition and physiology. Random (repeatability) errors arise from physiologic and instrument noise, and can be high particularly when regions are small. In addition, even in the absence of bias and noise, there may be, in each study, genuine between-subject differences in R1 due to between-subject variation in physiology or subclinical pathology. The aim of this study is to survey published values for native liver R1 in order to help investigators ascertain whether the liver R1 or T1 values and variabilities they measure are broadly consistent with, or discordant from, prior literature.Methods
Literature was searched using "Ovid Medline". Liberal inclusion criteria were employed. Human and rodent subjects were included if they were normal controls, if the study reported normal parts of livers with focal disease, or if they were patients in whom no liver abnormality had been found. Ex vivo studies were excluded. The mean and variance of R1 across all subjects in each study was estimated from the publications, with the coefficient of variation given by $$$CoV=\frac{\sqrt{variance}}{mean}$$$. Any R1 measurement method was allowed, as long as T1/s or R1/s-1 was reported. To aggregate the data, individual studies were weighted by the inverse of their inter-subject variance in R1. Two methods of representing B0 dependence were used: a heuristic log-log relationship, and a biophysically-based model developed by Diakova et al[1]. R1 was fitted to B0 using the weighted non-linear least squares function in “R”. The fitted parameters in the heuristic log-log fit (Eq.1) were M and C: $$log(R_{1})=Mlog(B_{0})+C$$ The fitted parameters in the biophysically-based model (Eq.2) were A and B: $$R_{1}=A\omega^{-0.6}+B\tau_{D}[\ln(1+(\omega\tau_{D})^{-2})+4\ln(1+(2\omega\tau_{D})^{-2})]+R_{1,\inf}$$ where R1,inf is the high-frequency asymptote, set here to 0.213 s-1 at 310K; τD is the translational correlation time from Diakova et al. adjusted for temperature to 1.43×10⁻¹¹ s; and $$$\omega=2\pi\times42.58\times10^{6}\times B_{0}$$$ s-1.Results
After exclusions, 106 publications remained, with publication dates between 1981 and 2020. These represented 3122 humans, 109 mice and 233 rats. Sixteen field strengths were included between 0.04T to 9.4T. Figs.1 and 2 plot R1 against B0. Fig 3 plots inter-subject CoV against year of publication. R1 showed the expected decrease with increasing field. The fit to Eq.1 gave M=-0.3649±0.0126 and C=0.2809±0.0059. The fit to Eq.2 gave A=(8.994±0.725)×104 and B=(1.197±0.077)×109. In studies published since 1992 (Fig.3), the median inter-subject CoV was 7.4% (lower quartile 5.1%, upper quartile 10.9%). In half of the studies, the measured R1 deviated from Eq.2 by 9.0% or less (lower quartile 4.0%, upper quartile 19.1%).Discussion
Fits from the heuristic and biophysical models were very similar. The major difference is that the heuristic model forces R1 to zero at infinite field, while the biophysical model forces R1 to asymptote. This difference might be important above 7T. In this study, following Diakova et al., we set the asymptote R1,inf to 1/4.7 s-1, the R1 of pure deoxygenated water at high field, although a slightly higher value of might be appropriate if liver R1 does not fully converge with water R1 as illustrated by the dotted curve in Fig.1. The within-study between-subject CoV (median 7.4%) reflects not only repeatability, but also the expected between-subject variation. Between-study variation also includes between-population variation, together with bias from interactions between each study’s measurement method and its livers’ variation in flow, motion, fat, oedema, collagen, glycogen and iron. There are some limitations. Some literature may have been missed because suitable keywords were not included in their abstracts. Few reports validated their liver R1 by means of a phantom, so accuracy is unknown. It was difficult to explore the effect of methodology on R1, because some studies used methodology which was poorly described or did not appear robust, and because of correlation between field strength and methodology (old studies used old methodology and lower fields). Likewise, there was correlation between field strength and species (humans at low-medium fields, rats at medium-high fields and mice at high fields).Conclusion
Quantitative relaxometry requires validation with phantoms and analysis of propagation of errors. However, it is also good scientific practice to compare one’s own findings with prior literature. An investigator who finds their average liver R1 to be within 9% of Eq.2 with between-subject CoV <8%, can conclude that their measurements are consistent majority of the literature: measurements far outside these limits should be justified on physiological or methodological grounds.Acknowledgements
The research leading to these results received funding from the Innovative Medicines Initiatives 2 Joint Undertaking under grant agreement No 116106 (IB4SD-TRISTAN). This Joint Undertaking receives support from the European Union’s Horizon 2020 research and innovation programme and EFPIA.References
1. Diakova G, Korb J-P, Bryant RG. The Magnetic Field Dependence of Water T1 in Tissues. Magn. Reson. Med. (2012) 68:272–277.Figures
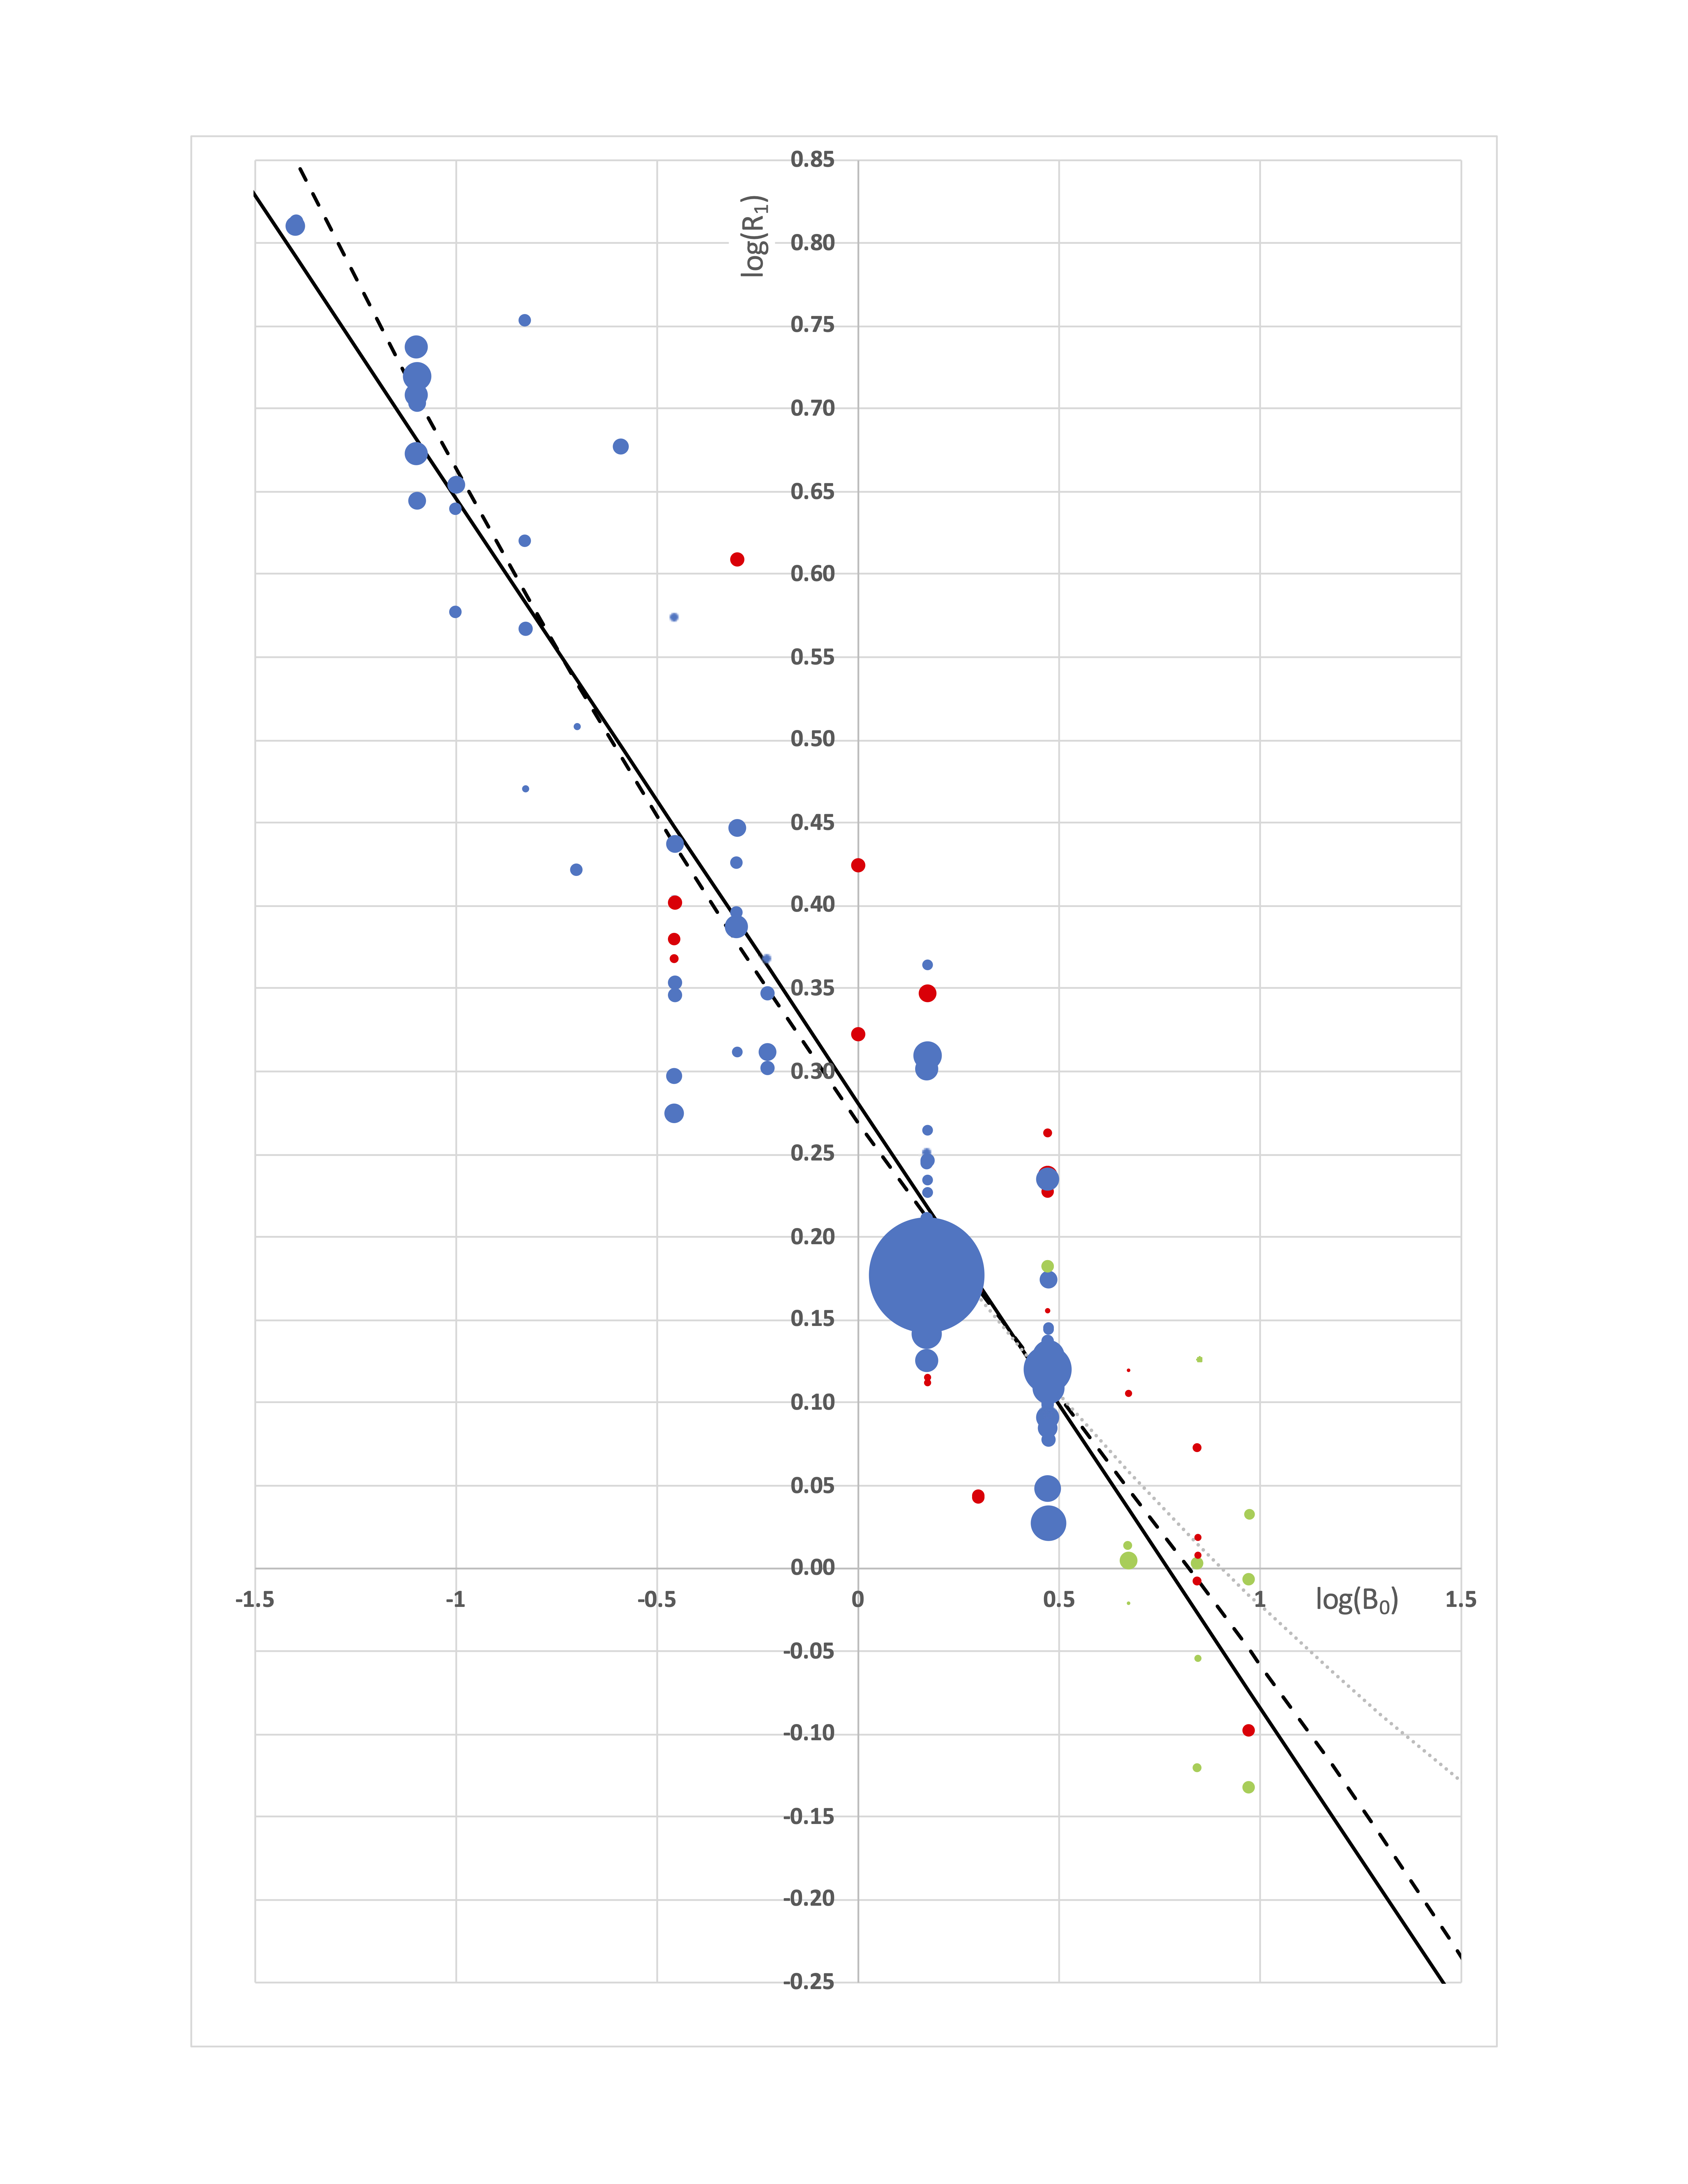
FIGURE 1. Log-log plot of R1 against B0. Blue: human; Red: rat; Green: mouse. Each symbol represents one study. Size of circle reflects number of subjects (some smaller symbols are occluded by larger symbols). Solid black line: Eq.1. Dashed black line: Eq.2 with R1,inf=0.213s-1. The dotted line shows, purely for illustrative purposes, a fit to Eq.2 where R1,inf was fixed arbitrarily at a higher value of 0.5s-1.
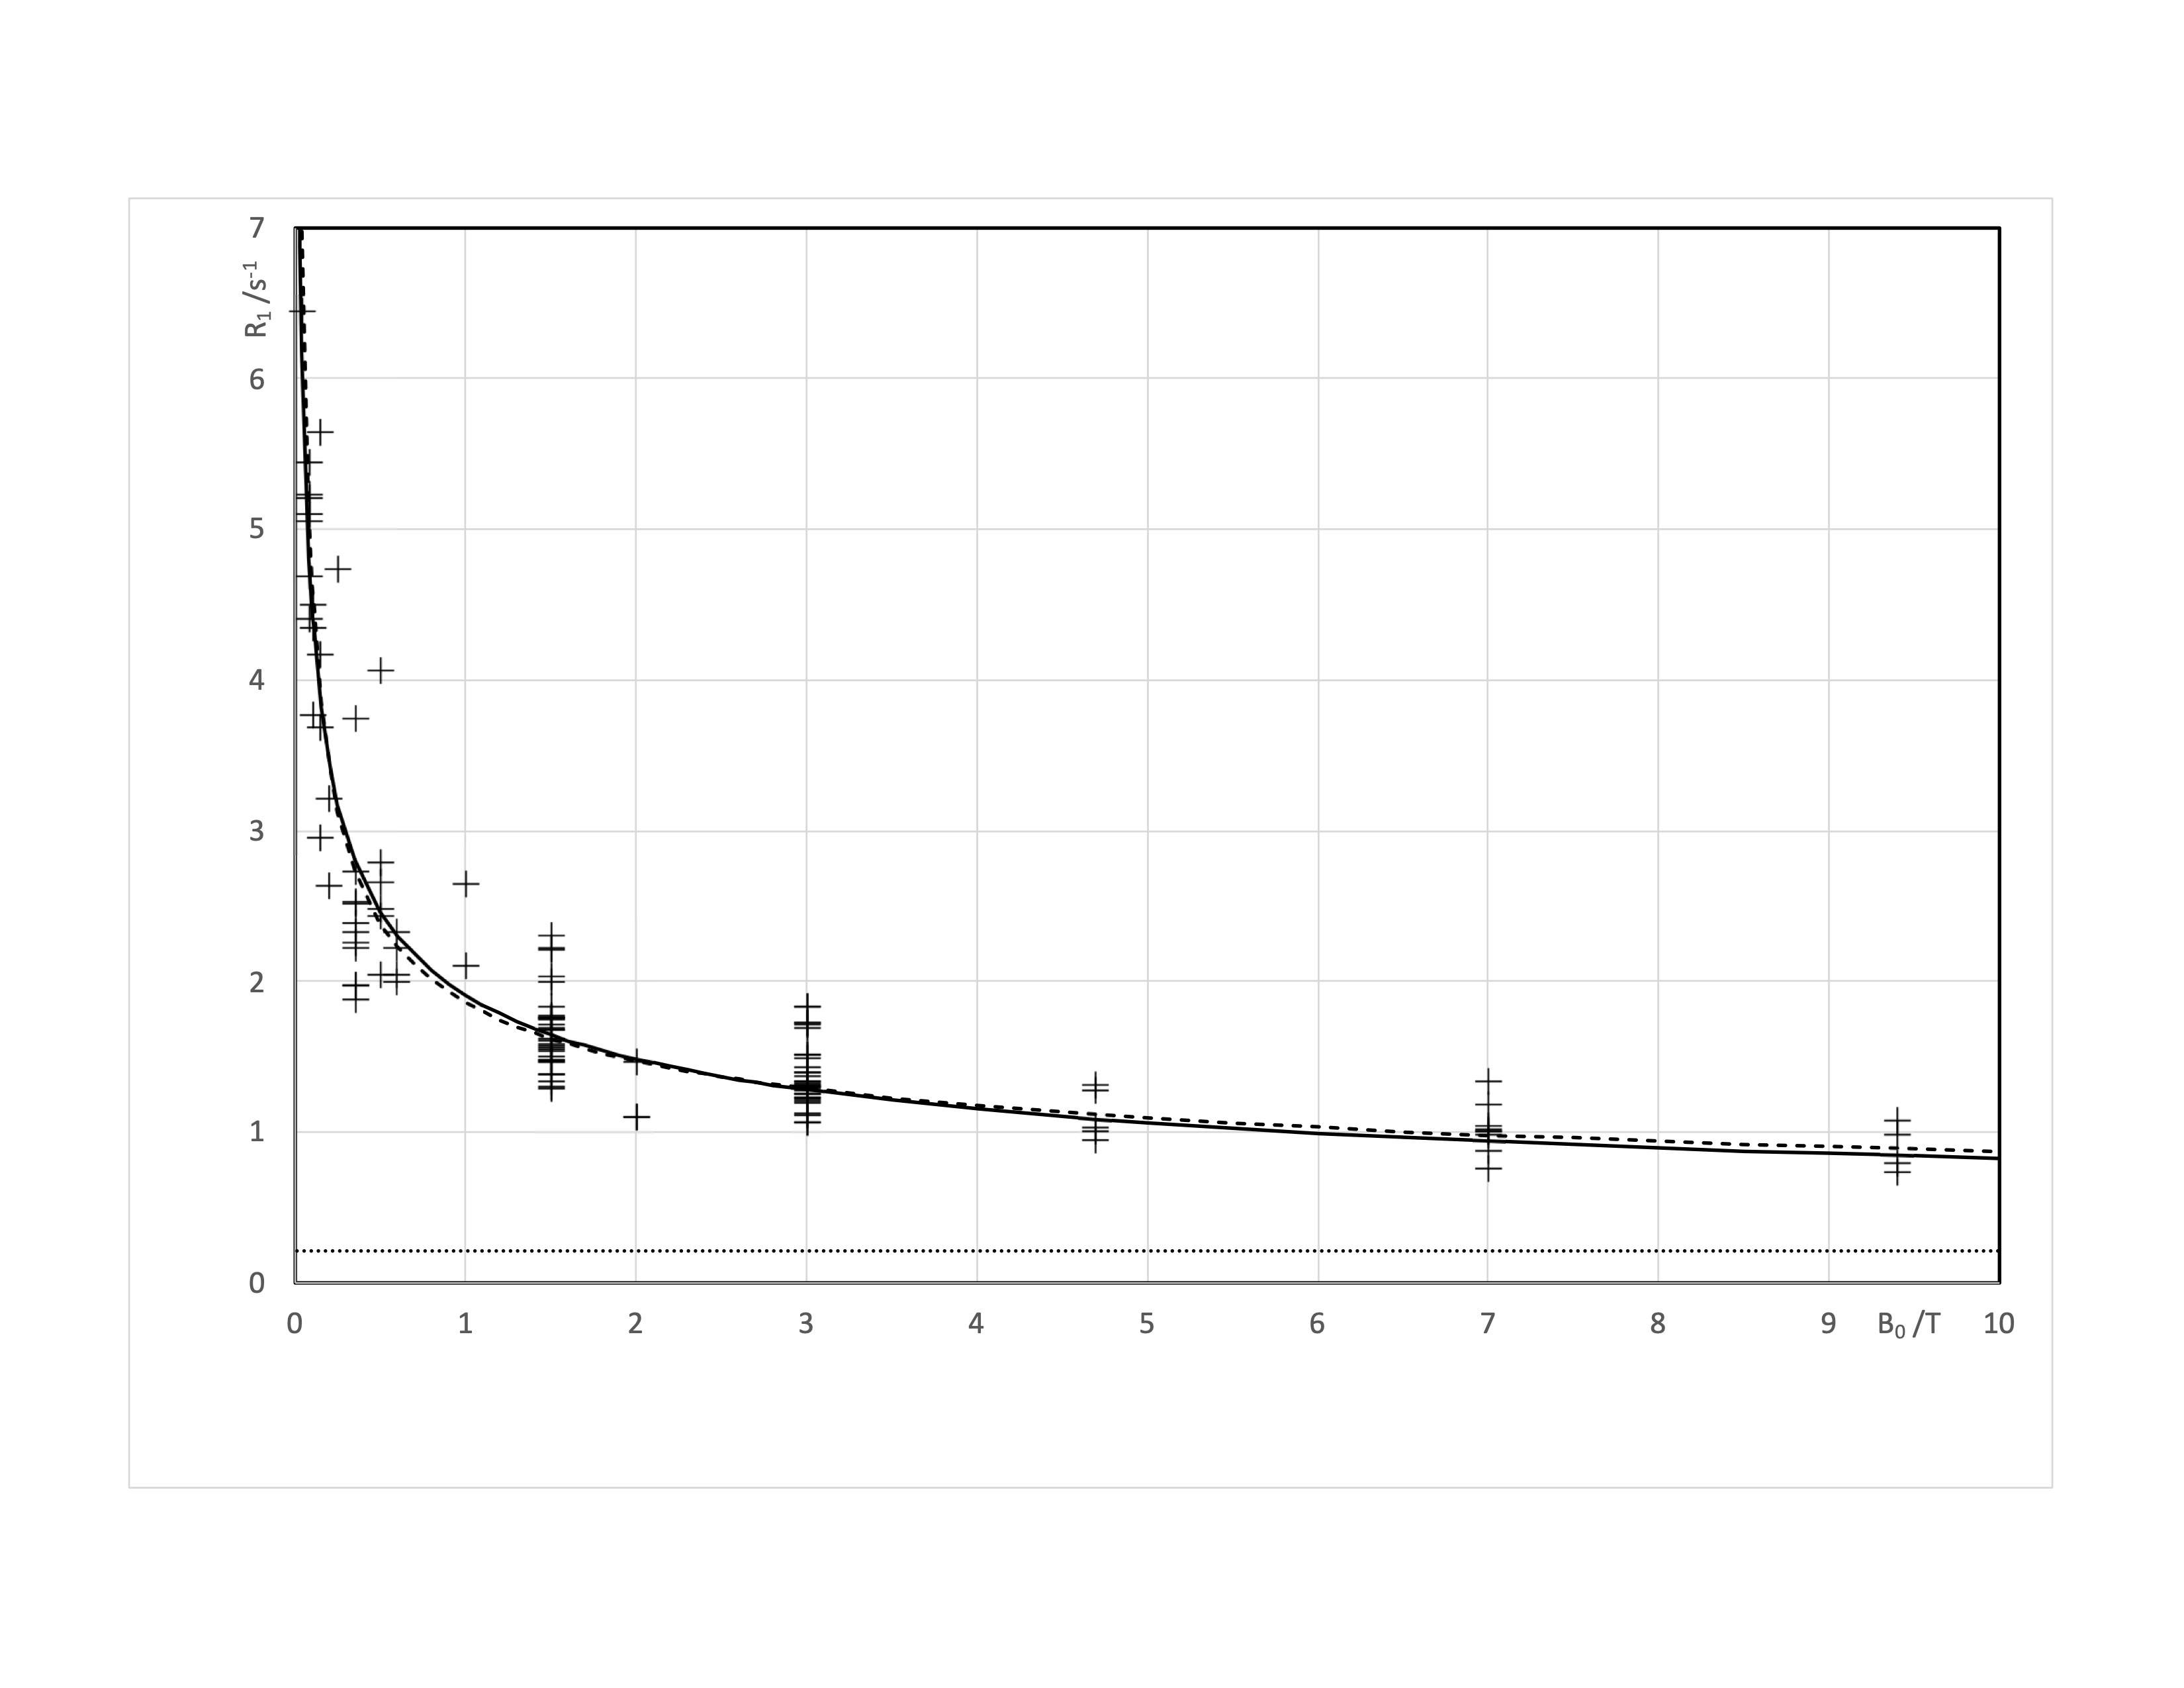
FIGURE 2. Plot of R1 against B0. Each symbol represents one study. Solid black line: Eq.1. Dashed black line: Eq.2 with R1,inf.=0.213s-1. Dotted line: R1,inf.
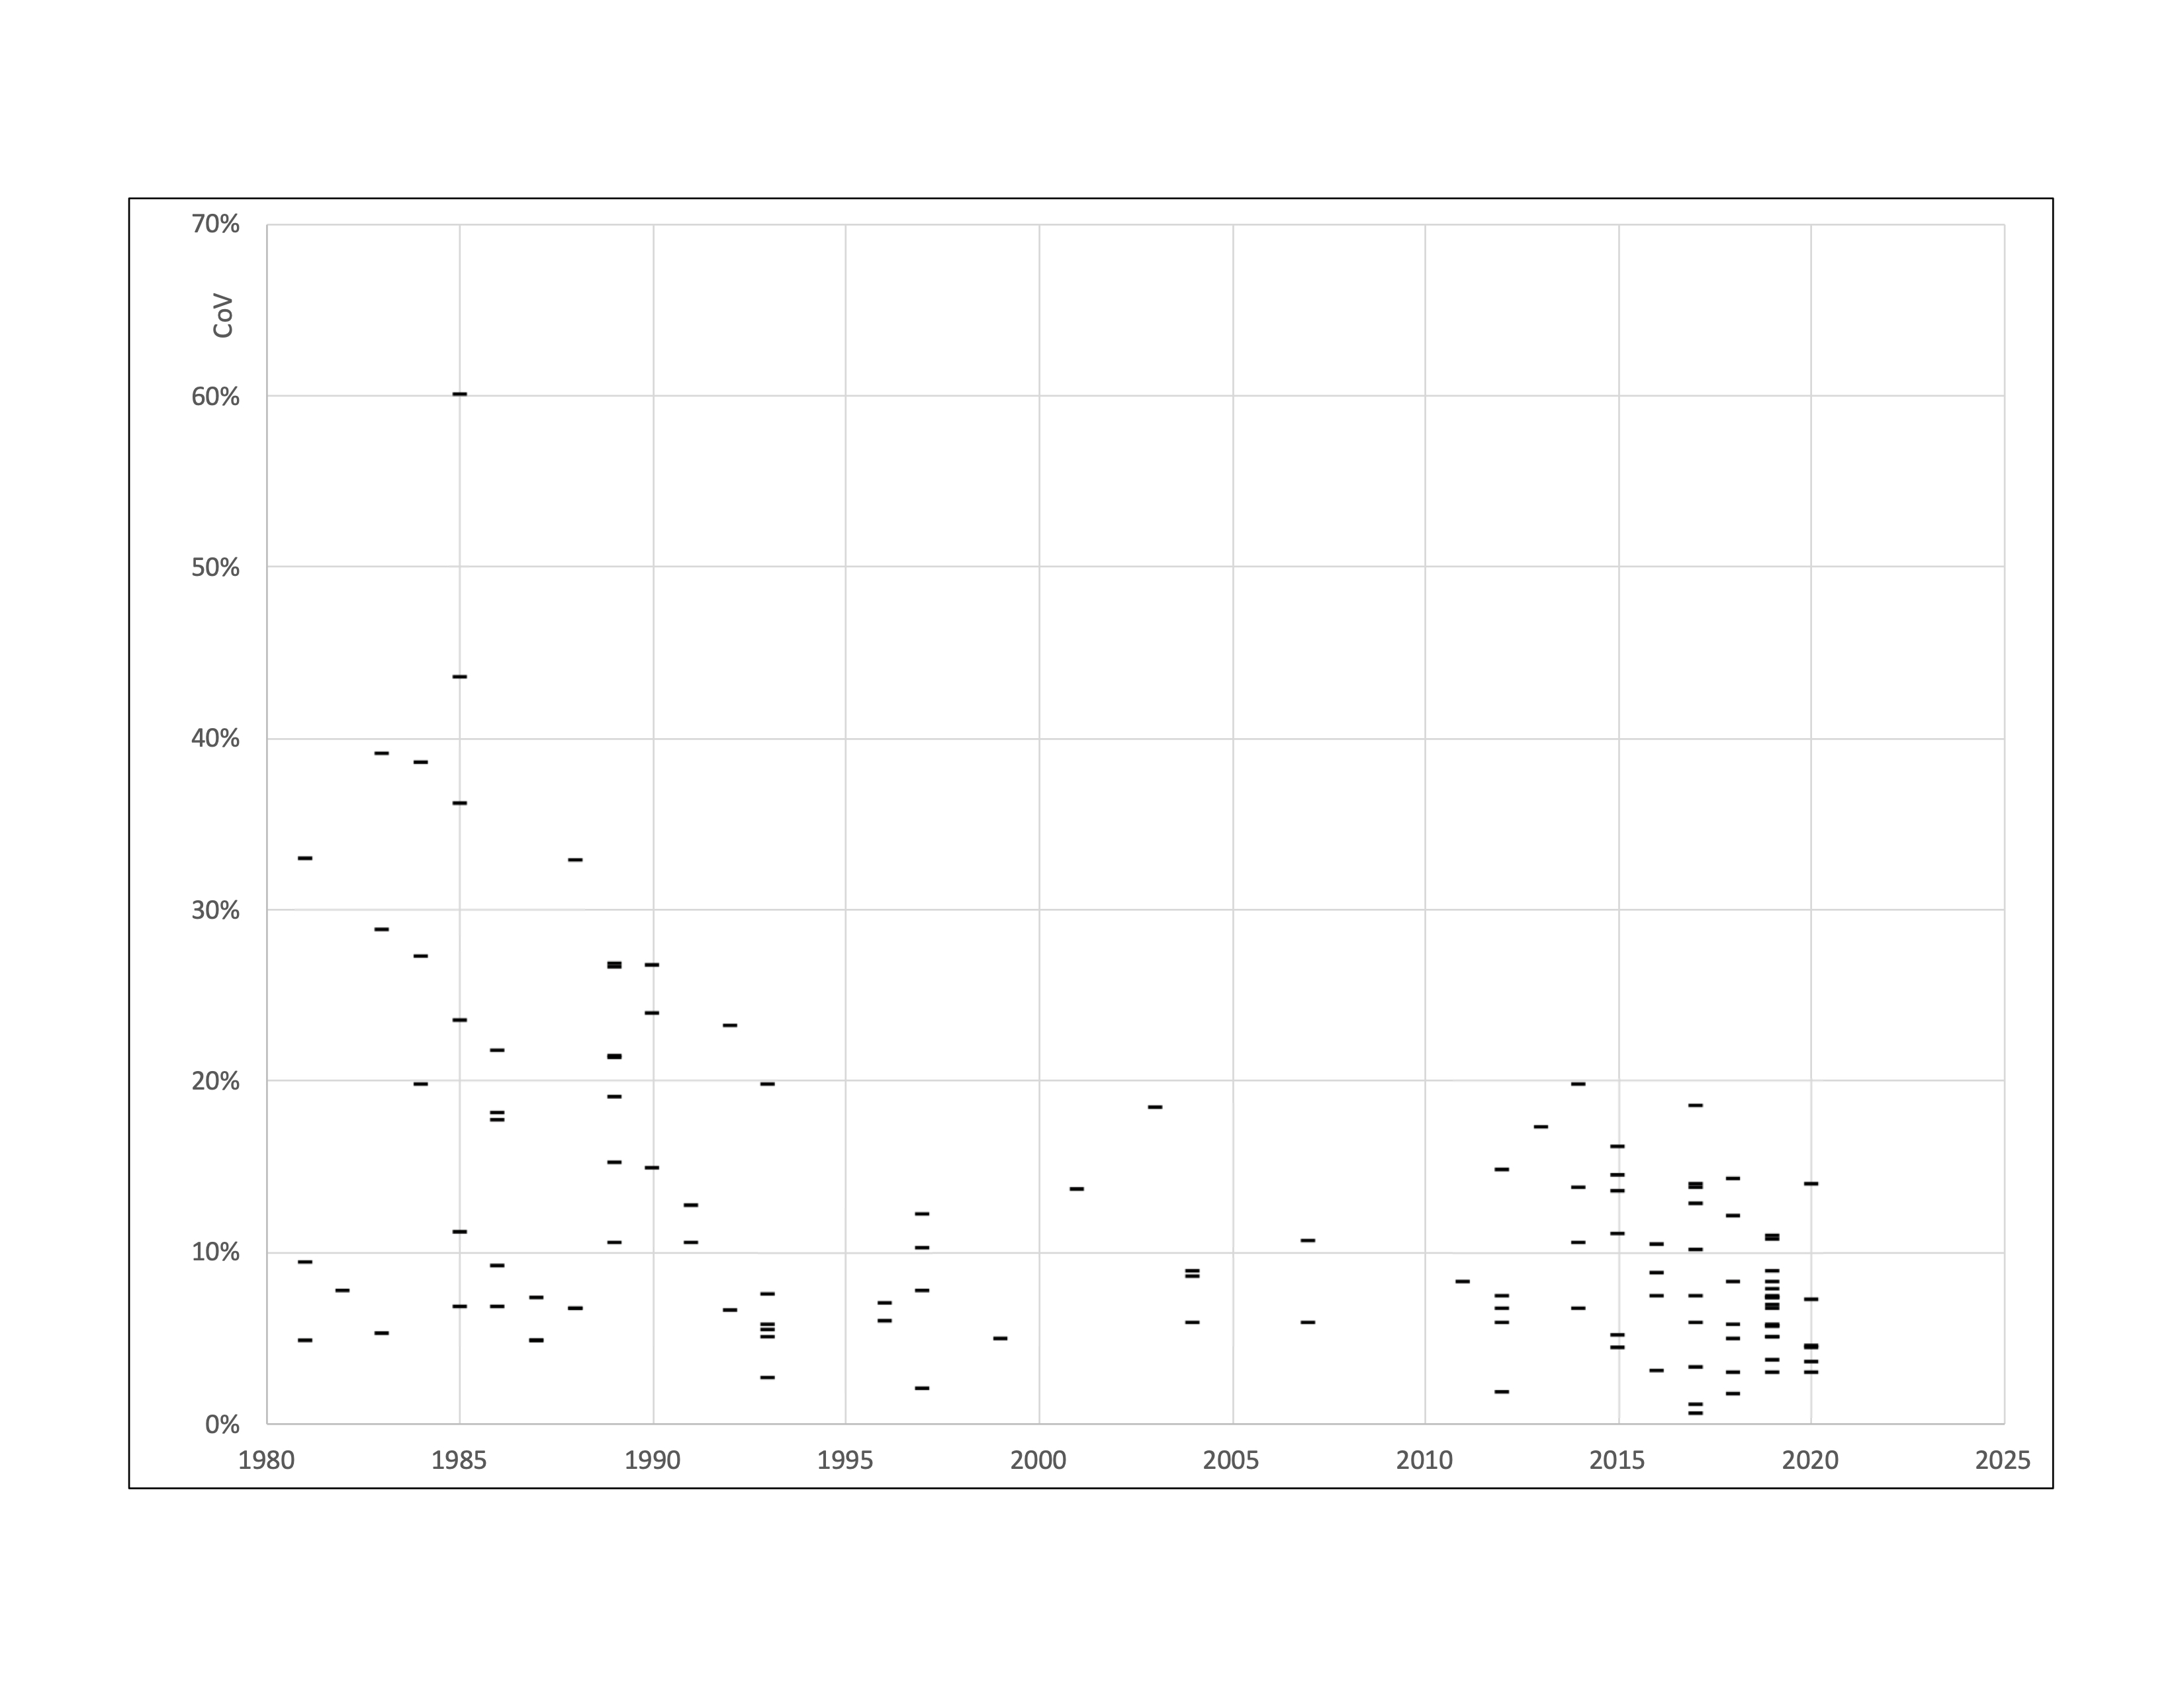
FIGURE 3. Plot of within-study between-subject coefficient of variation against year of publication.