3291
Synthetic relaxometry and diffusion measures in the differentiation of breast lesions: a contrast-free alternative to BI-RADS?1Radiology, Second Affiliated Hospital of Xi’an Jiaotong University, Xi’an, Shaanxi, China, 2MR Research, GE Healthcare, Beijing, China
Synopsis
In this study, we aim to investigate the performance of quantitative measurements from synthetic MRI and DWI as well as their combinations in differentiating malignant from benign breast lesions and to compare with BI-RADS. Quantitative T2, PD and ADC values were significant lower in malignant than that of benign breast lesions. Quantitative multi-parameters of T2+PD+ADC had the best performance compared to all the other quantitative plans and BI-RADS. The approach, without contrast agents that combined synthetic MRI and DWI outperformed BI-RADS and may serve as an alternative and effective strategy for the improvement of breast lesion differentiation.
Introduction
Early detection and early diagnosis have impact on the treatment plan and can effectively improve the survival rate of breast cancer patients1,2. MRI plays an important role in the early diagnosis of breast cancer3,4. The Breast Imaging Reporting and Data System (BI-RADS) is widely regarded as the interpretation for breast MRI, which is subjective and based on qualitative assessment5; in addition, the use of DCE requires contrast injection that may be potentially risky for certain patient population6. Therefore, an objective, quantitative and contrast free method is highly desirable for breast cancer diagnosis. Apparent diffusion coefficient (ADC) from DWI has been reported to improve the differentiation between benign and malignant breast lesions7,8. However, different studies reported controversial sensitivity and specificity overlap between malignant and benign lesions9. Recently proposed synthetic MR methods, the magnetic resonance image compilation (MAGiC) with multiecho and multidelay acquisition method can simultaneously quantify tissues’intrinsic magnetic properties, and investigates all of the relaxometry measures T1, T2 relaxation time and proton-weighted (PD) in a practically acceptable scan time10-14. The purpose of this study is to investigate the use of different relaxometry measures generated from synthetic and ADC in breast cancer diagnosis, aiming to find a quantitative and contrast free alternative to BI-RADS.Material and Methods
From May 2019 to Jan 2020, 80 patients (56 with malignant lesions and 24 with benign lesions), ranging from 29 to 75 years old (47.6 ±10.1 years) were retrospectively included in our study. The region of interest (ROI) was manually drawn to cover the largest area of the lesion and necrotic or cystic areas were excluded. T1 relaxation time (T1), T2 relaxation time (T2) and proton density (PD) from synthetic MRI and apparent diffusion coefficient (ADC) from DWI were analyzed by two radiologists (Reader A, ReaderB). Univariable and multivariable models were developed to optimize differentiation between malignant and benign lesions and their performances compared to BI-RADS. The diagnostic performance was evaluated using multivariate logistic regression analysis and area under the receiver operating characteristic (ROC) curves (AUC). All patients underwent MR exams on a 3.0 T whole body scanner (Signa Pioneer, GE Healthcare, Milwaukee, USA) with an 8-channel breast coil. The scan sequences included routine axial (AX) T2-weighted and T1-weighted imaging. Synthetic MRI (MAGiC), diffusion weighted imaging (DWI) and dynamic contrast enhanced (DCE) imaging were also performed. The MAGIC parameters were as follows: TR=6000ms, two echo times (TEs, 21.6 and 108 ms), four delay times (146, 546, 1879, and 3879 ms), Bandwidth=25kHz, number of average=1, FOV=34cm×34cm, slice thickness/gap=5/1mm, 31 axial slices, echo train length=16, matrix=320×224, SENSE acceleration factor=2, and scanning time = 6.01mins. The quantitative measurements, including T1, T2 and PD maps were generated from the raw data produced by MAGIC imaging sequence using a vendor-provided program (MAGiC, version 100.1.1).Results
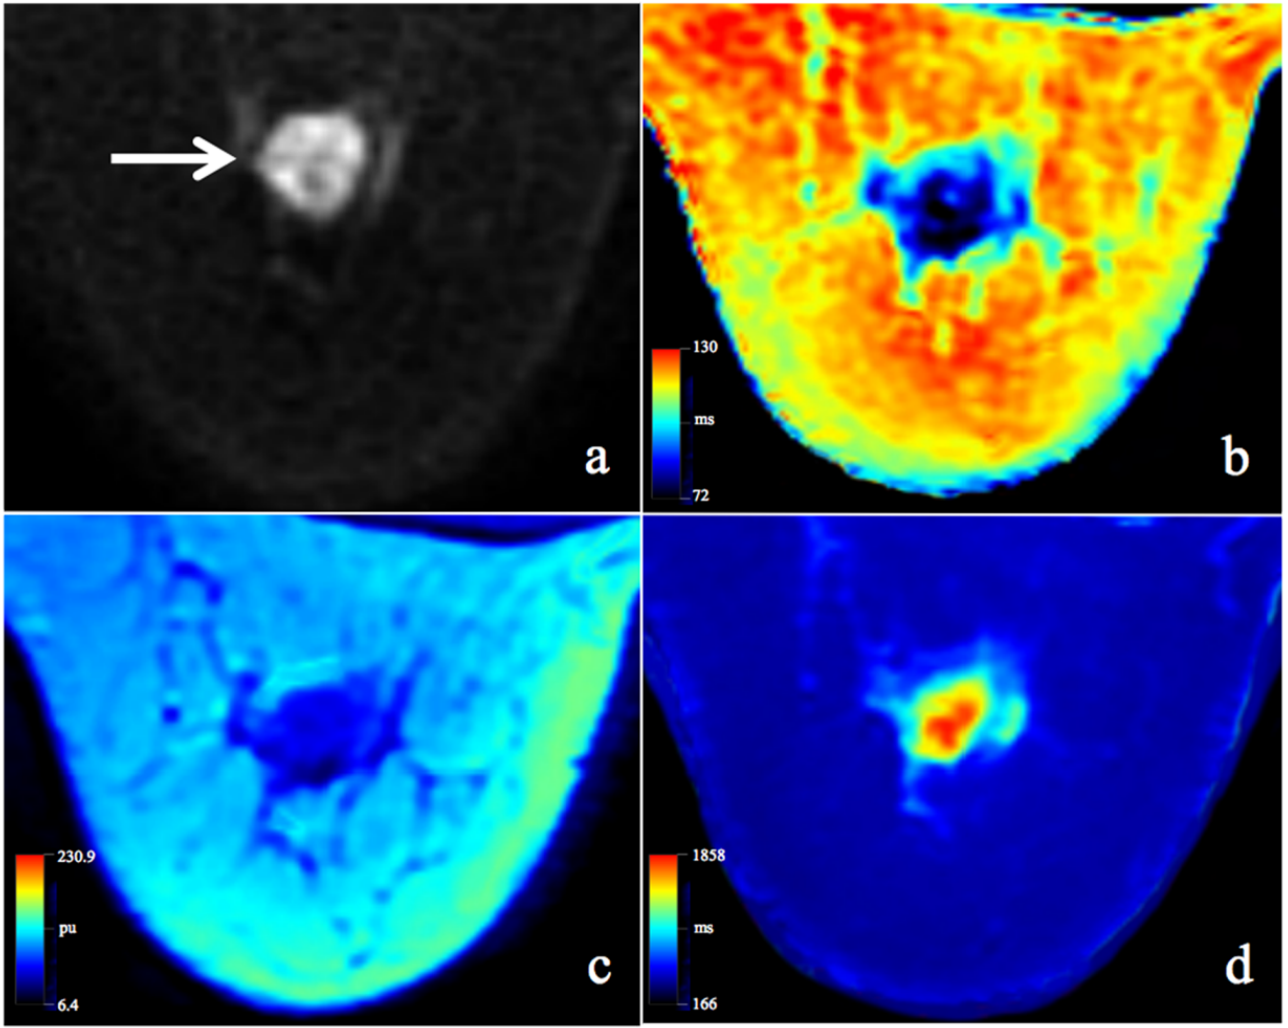
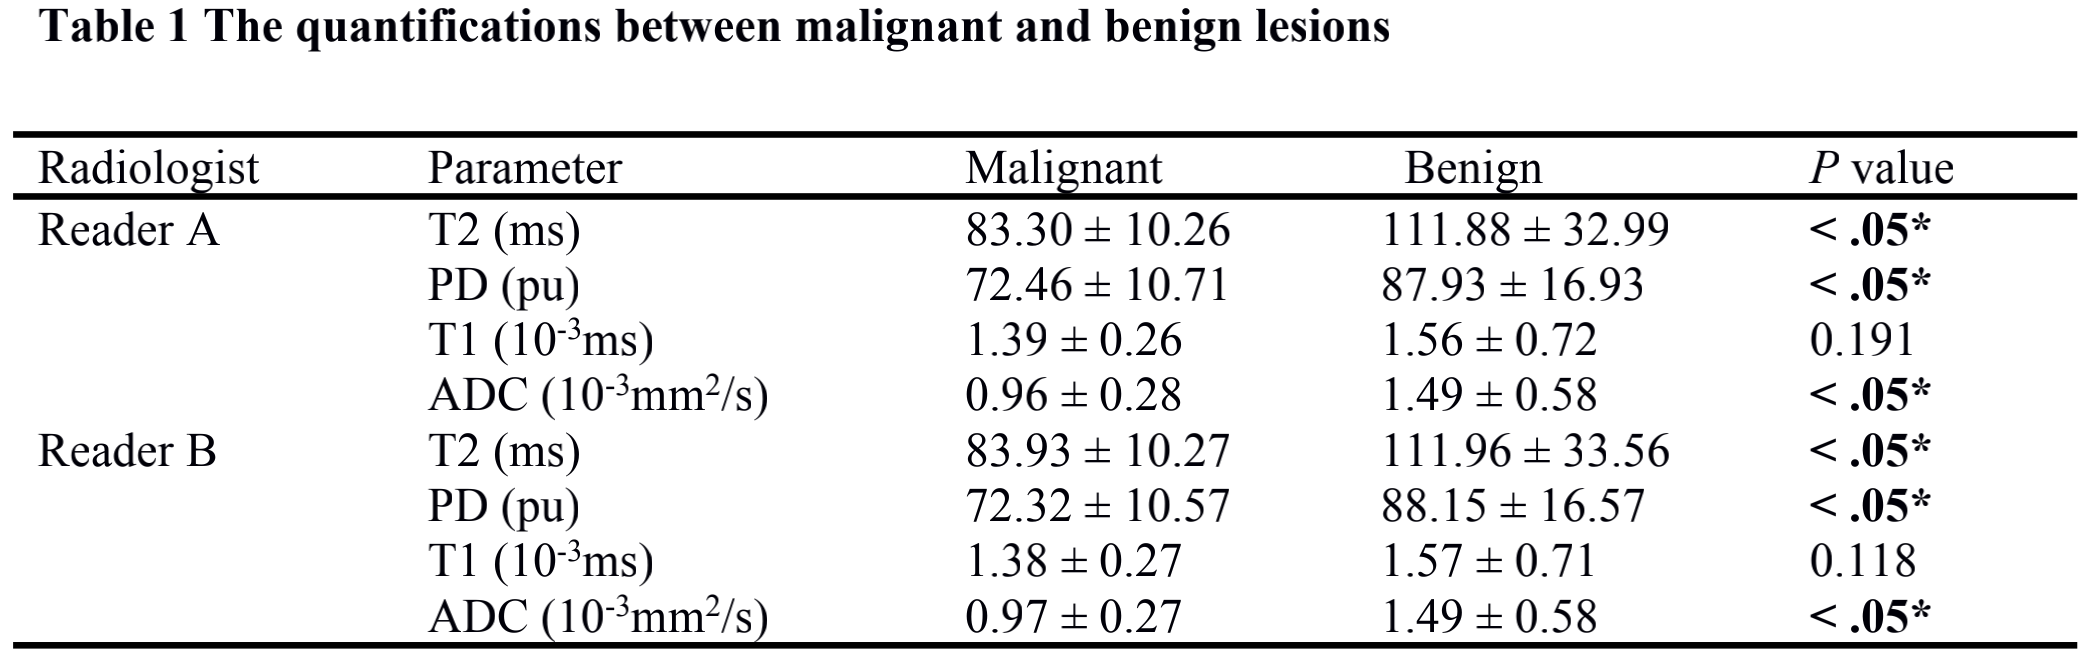
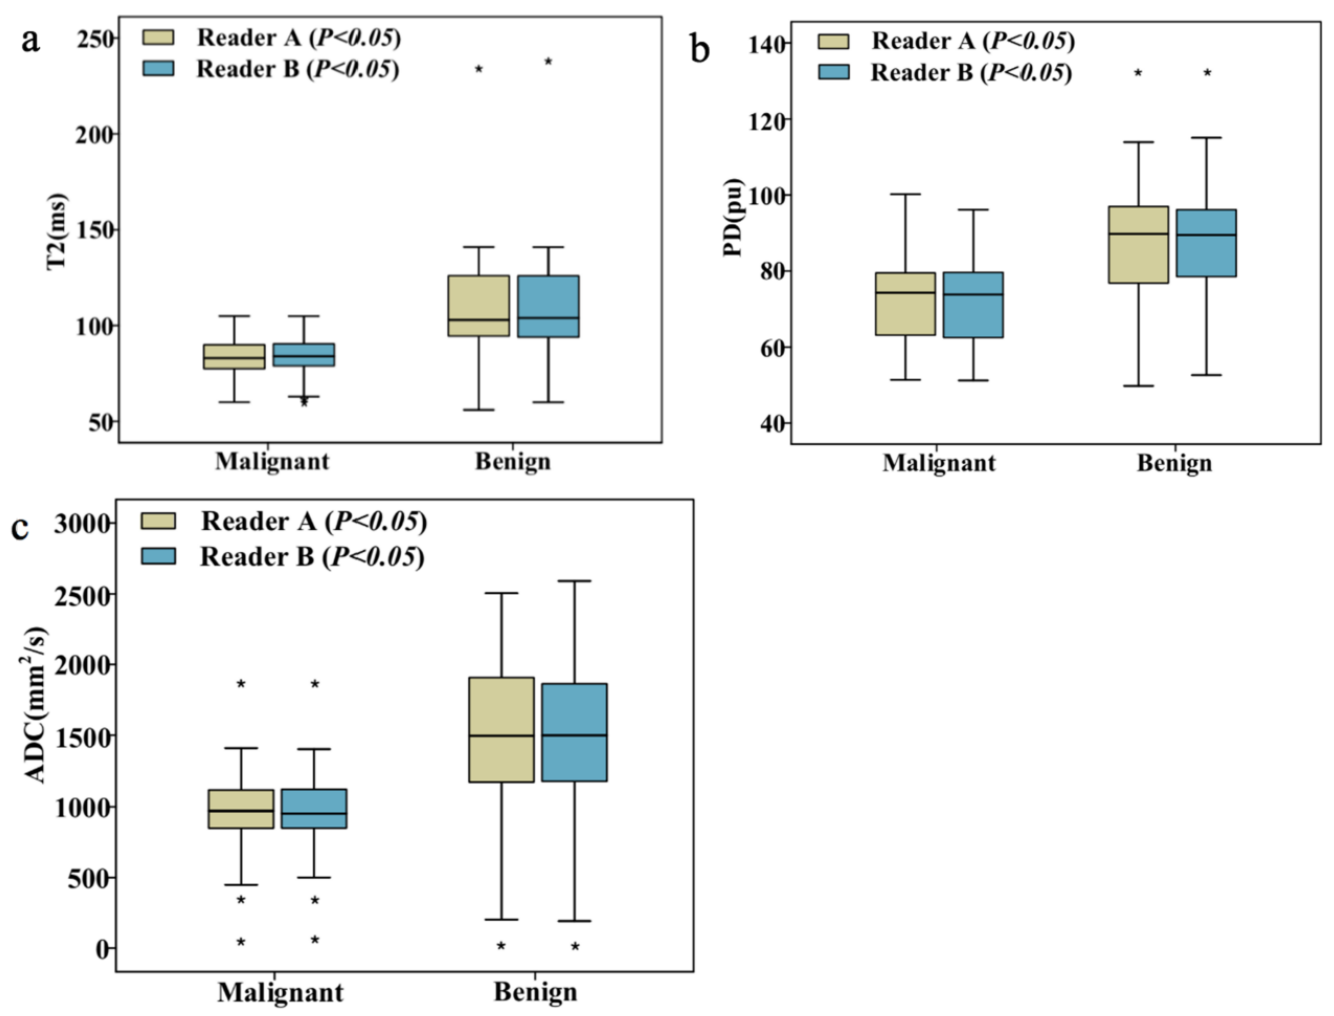
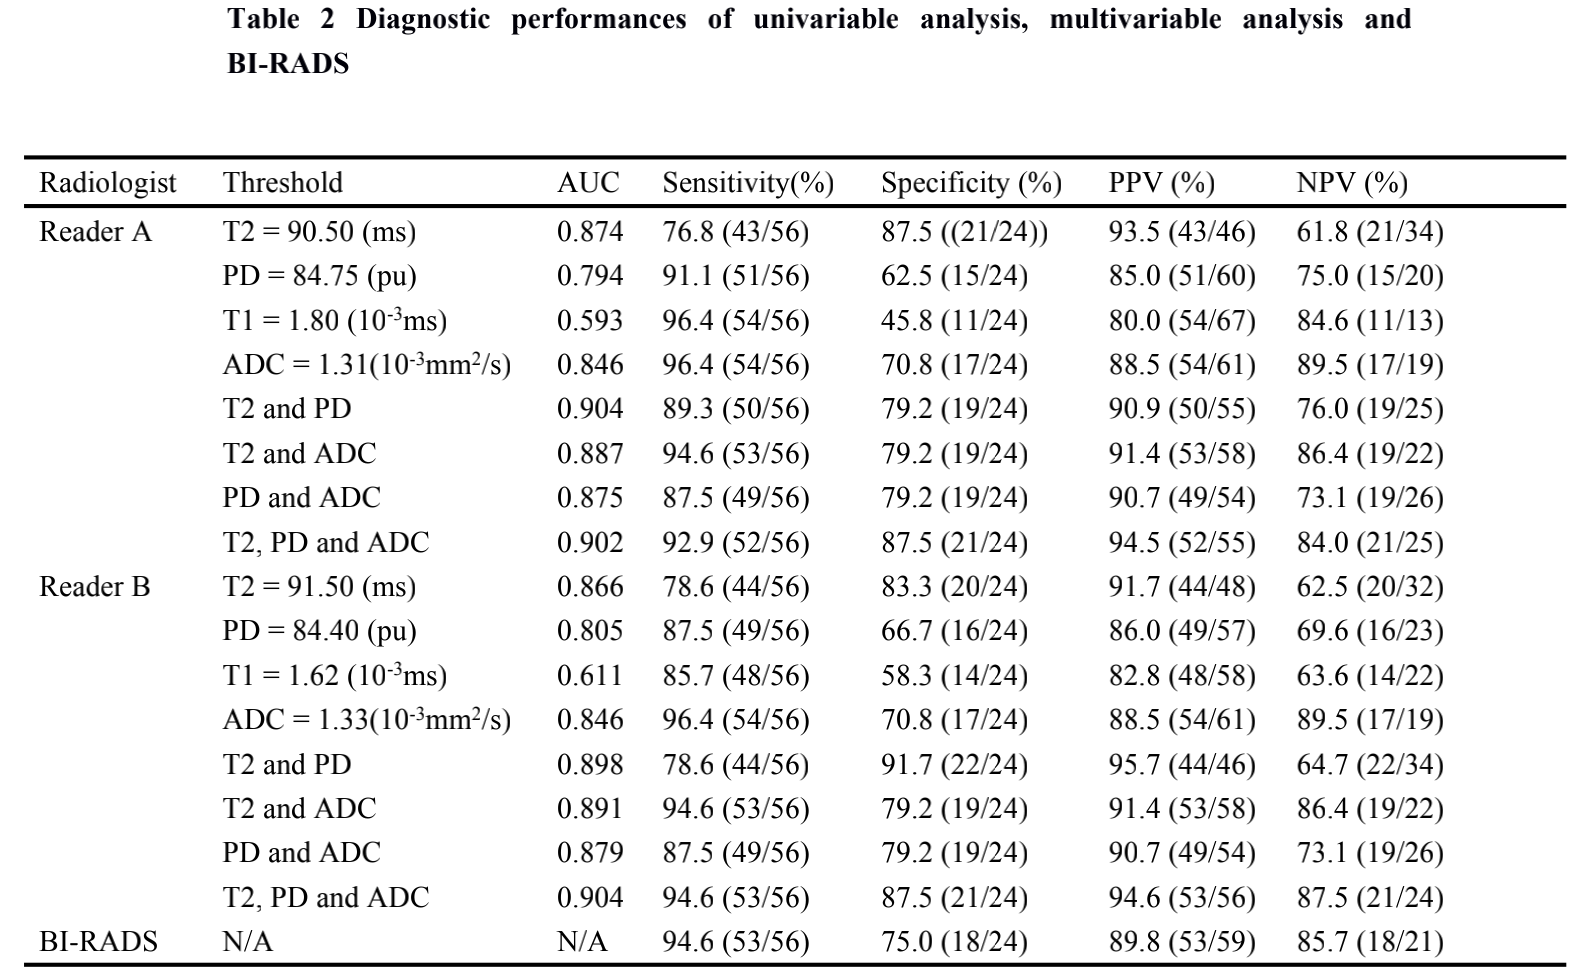
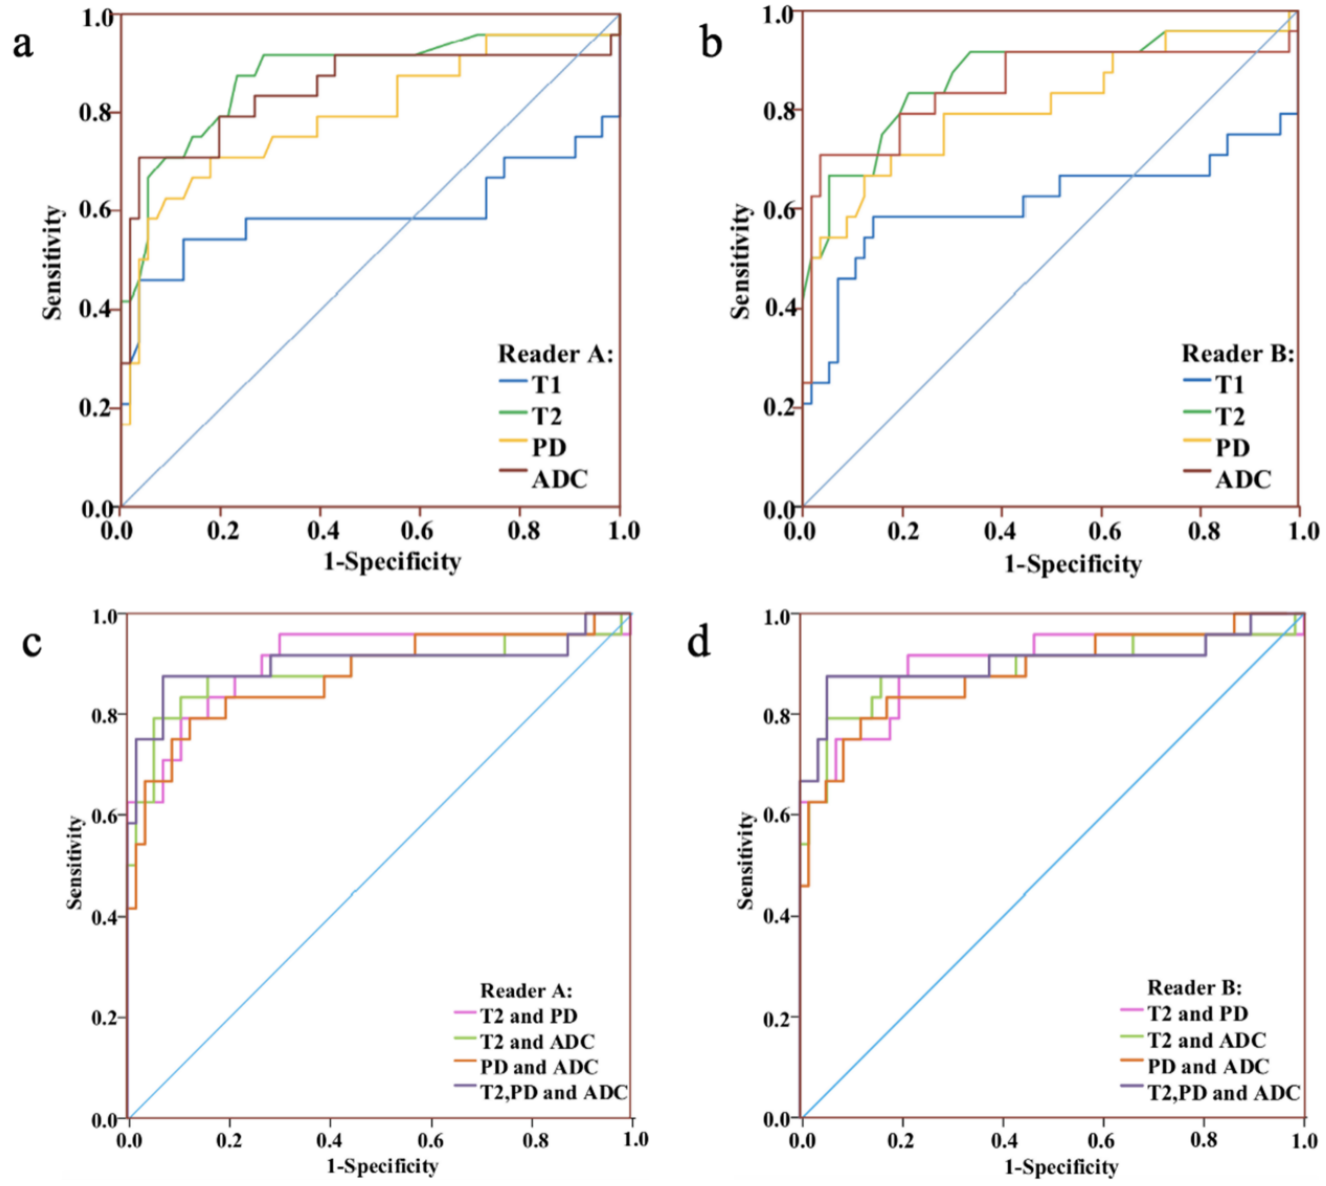
T2, PD and ADC values for malignant lesions were significantly lower than those in benign breast lesions (Figure 1) for both radiologists (all P <.05, Table 1, Figure 2). The combined T2, PD and ADC model had the best performance for differentiating malignant and benign lesions with AUC, sensitivity, specificity, positive predictive value and negative predictive values of 0.904, 94.6%, 87.5%, 94.6% and 87.5% respectively (Table 2, Figure 3). The corresponding results for BI-RADS were no AUC, 94.6%, 75.0%, 89.8% and 85.7% respectively.Discussion and Conclusion
Main finding in our study is that quantitative T2, PD and ADC values were significant lower in malignant than that of benign breast lesions. Quantitative multi-parameters of T2 + PD + ADC for both readers had the best performance compared to all the other quantitative plans and BI-RADS. In clinical practice, this could reduce the numbers of unnecessary re-evaluation biopsies and the dependence of diagnosis on subjective factors such as signal intensity, morphology and haemodynamics15, 16. It would also avoid the need for contrast agent injection which is essential for BI-RADS, which would be beneficial for pregnant women, children and patients allergic to contrast6, 17. Liu et al11 reported that there was a significantly lower T2 relaxation time in malignant breast lesions compared to benign breast lesions and this was also found in our study. Our study indicated that PD values had relative high sensitivity in the differentiation of breast lesions and assisted in improving sensitivity in combined models. In our study the ADC yielded the highest diagnostic sensitivity and NPV in comparison with T2 and PD by both radiologists. Similar results have been reported by a meta-analysis9. However, there are some limitations in our study. First, the number of patients in this study was small and a larger patient cohort would be needed for further investigation. Second, the models developed in our study were not tested on an independent testing dataset. To conclude, the approach combining T2 and PD from synthetic MRI and ADC from DWI outperformed BI-RADS without contrast agents and may serve as an effective strategy for improvement of benign and malignant breast lesion differentiation.Acknowledgements
No acknowledgement found.References
1.Siegel RL, Miller KD, Jemal A. Cancer statistics, 2019. CA Cancer J Clin 2019;69(1):27-34. 2.Byers T, Wender RC, Jemal A, et al. The American cancer society challenge goal to reduce US cancer mortality by 50% between 1990 and 2015: results and reflections. CA Cancer J Clin 2016;66(5):359-369. 3.Santamaría G, Bargalló X, Fernández PL, et al. Neoadjuvant systemic therapy in breast cancer: association of contrast-enhanced MR imaging findings, diffusion-weighted imaging findings, and tumor subtype with tumor response. Radiology 2017(3);283:663-672. 4.Riedl CC, Luft N, Bernhart C, et al. Triple-modality screening trial for familial breast cancer underlines the importance of magnetic resonance imaging and questions the role of mammography and ultra-sound regardless of patient mutation status, age,and breast density. J Clin Oncol 2015;33(10):1128-1135. 5.Magny SJ, Shikhman R, Keppke AL. Breast, Imaging, Reporting and Data System (BI RADS). Treasure Island (FL): StatPearls 2020. 6.Kanda T, Nakai Y, Oba H, et al. Gadolinium deposition in the brain. Magn Reson Imaging 2016;34(10):1346-1350. 7.Telegrafo M, Rella L, Stabile I, et al. Unenhanced breast MRI (STIR, T2-weighted TSE, DWIBS): an accurate and alternative strategy for detecting and differentiating breast lesions. Magn Reson Imaging 2015;33:951-955. 8.Mann RM, Cho N, Moy L. Breast MRI: state of the art. Radiology 2019;292:520-536. 9.Dorrius MD, Dijkstra H, Oudkerk M, et al. Effect of b value and pre-admission of contrast on diagnostic accuracy of 1.5-T breast DWI: a systematic review and meta-analysis. Eur Radiol 2014;24:2835-2847. 10.Jung Y, Gho SM, Back SN,et al. The feasibility of synthetic MRI in breast cancer patients: comparison of T2 relaxation time with multiecho spin echo T2 mapping method. Br J Radiol 2018;92(1093):20180479. 11.Liu L, Yin B, Shek K, et al. Role of quantitative analysis of T2 relaxation time in differentiating benign from malignant breast lesions. J Int Med Res 2018;46(5):1928-1935. 12.Matsuda M, Kido T, Tsuda T, et al. Utility of synthetic MRI in predicting the Ki-67 status of oestrogen receptor-positive breast cancer: a feasibility study. Clin Radiol 2020; 75(5) :398.e1 - 398.e8. 13.Liu L, Yin B, Geng DY, et al. Changes of T2 relaxation time from neoadjuvant chemotherapy in breast cancer lesions. Iran J Radiol 2016;13(3):e24014. 14.Tan PC, Pickles MD, Lowry M, et al. Lesion T(2) relaxation times and volumes predict the response of malignant breast lesions to neoadjuvant chemotherapy. Magn Reson Imaging 2008;26:26-34. 15.Yamada I, Yoshino N, Hikishima K, et al. Colorectal carcinoma: Ex vivo evaluation using 3-T high-spatial-resolution quantitative T2 mapping and its correlation with histopathologic findings. Magn Reson Imaging 2017;38:174-181. 16.Just M, Thelen M. Tissue characterization with T1, T2, and proton density values: results in 160 patients with brain tumors. Radiology. 1988;169(3):779-785. 17.Lersy F, Diepenbroek AL, Lamy J, et al. Signal changes in enhanced T1-weighted images related to gadolinium retention: a three-time-point imaging study. J Neuroradiol. 2020;S0150-9861(20)30199-1.
Figures