3290
Synthetic MRI with quantitative mappings as biomarkers for prediction of prognostic factors and molecular subtypes of breast cancer
Weibo Gao1, Quanxin Yang1, Xin Chen1, and Xiaocheng Wei2
1Radiology, Second Affiliated Hospital of Xi’an Jiaotong University, Xi’an, Shaanxi, China, 2MR Research, GE Healthcare, Beijing, China
1Radiology, Second Affiliated Hospital of Xi’an Jiaotong University, Xi’an, Shaanxi, China, 2MR Research, GE Healthcare, Beijing, China
Synopsis
In this study, we aim to investigate whether different parameters of synthetic MRI can be used for the prediction of prognostic factors and molecular subtypes of breast cancer. It was concluded that SD of PD-Pre, SD of PD-Gd, T2-Pre, T2-Gd, T1-Pre and PD-Pre can be used as quantitative imaging biomarkers for the different receptor status of breast cancer. Among them, SD of PD-Pre, SD of PD-Gd, T2-Pre and T2-Gd were significantly different molecular subtypes, which worth further study.
Introduction
Breast cancer is a highly heterogeneous disease with varying molecular subtypes which have led to various treatment1, 2 and clinical outcomes3. Immunohistochemical (IHC) markers, including estrogen receptor (ER), progesterone receptor (PR), human epidermal growth factor receptor 2 (HER2) and proliferation rate (Ki-67), as an alternative to genetic analysis is applied to clinical practice1. In addition, using IHC surrogates, molecular breast cancer subtypes can be defined. However, the use of IHC has been shown to be short of robustly predicting outcomes,and presents a barrier because of the invasive method, even with false negative prediction rate4. Dynamic contrast-enhanced imaging (DCE) MRI and diffusion weighted imaging (DWI) has been applied to correlate with different molecular subtypes and molecular prognostic factors5-7. However, the results were inconsistent. Demand for additional alternative methods capable of predicting prognostic factors and differentiating breast cancer into molecular subtypes remains. Recently proposed synthetic MRI8-10 using the magnetic resonance image compilation (MAGiC) can simultaneously quantify tissues’ intrinsic magnetic properties and can obtain the tissues’ quantitative maps of T1, T2 relaxation time and proton-weighted image (PD). The purpose of the study was to investigate whether different parameters of synthetic MRI can be used for prediction of prognostic factors and molecular subtypes of breast cancer.Material and Methods
From May 2019 to Oct 2020, 115 patients ranging from 31 to 75 years old (49.8±10.0 years) were retrospectively included in our study. All breast lesions were confirmed by biopsy or surgical pathology. All patients underwent MR exams on a 3.0 T whole body scanner (Signa Pioneer, GE Healthcare, Milwaukee, USA) with an 8-channel breast coil. The scan sequences included routine axial (AX) T2-weighted and T1-weighted imaging. Synthetic MRI (MAGiC), DWI and DCE imaging were also performed. The MAGIC parameters were as follows: TR=6000ms, two echo times (TEs, 21.6 and 108 ms), four delay times (146, 546, 1879, and 3879 ms), Bandwidth=25kHz, number of average=1, FOV=34cm×34cm, slice thickness/gap=5/1mm, 31 axial slices, echo train length=16, matrix=320×224, SENSE acceleration factor=2, and scanning time = 6.01mins. The quantitative measurements were generated using a vendor-provided program (MAGiC, version 100.1.1). Parameters involving T1, T2, PD and their standard deviations (SD) in the breast lesions before (T1-Pre, T2-Pre, PD-Pre, SD of T1-Pre, SD of T2-Pre, SD of PD-Pre) and after (T1-Gd, T2-Gd, PD-Gd, SD of T1-Gd, SD of T2-Gd, SD of PD-Gd) contrast agent injection were obtained. Associations between quantitative parameters and IHC receptor (ER, PR, HER2), Ki-67 status and molecular subtypes (Luminal A, luminal B, HER2-positive, TN) were assessed using Wilcoxon test or independent Student’s t-test. The diagnostic performance was evaluated using area under the receiver operating characteristic (ROC) curves (AUC).Results
ER, PR, HER2 status and Ki-67 were all to present significantly different quantitative values for synthetic MRI (Table 1, Figure 1). SD of PD-Pre and PD-Gd were significantly lower for ER-negative than for ER-positive tumors. T1-Pre, T2-Pre and T2-Gd) were significantly lower for ER-positive than for ER-negative tumors. SD of PD-Pre, SD of PD-Gd, T1-Pre and T2-Gd were significantly lower for PR-negative than for PR-positive tumors. HER2-positive tumors had only PD-Pre values significantly lower than HER2-negative tumors. Lower T2-Pre, T2-Gd and higher SD of PD-Gd were observed in Ki-67 low proliferating than in Ki-67 high proliferating tumors. There was no significant association between the ADC values and IHC status or proliferation rate. The area under the curve (AUC) for the prediction of prognostic factors and using corresponding quantitative parameters are demonstrated in Table 2. T2-Pre, T2-Gd, SD of PD-Pre and SD of PD-Gd were significantly different among the five different molecular subtypes (all P <.05, Table 3).Discussion and Conclusion
Our study demonstrated that SD of PD-Pre, SD of PD-Gd, T2-Pre, T2-Gd, T1-Pre and PD-Pre can be used as quantitative imaging biomarkers for the different receptor status of breast cancer. Among them, SD of PD-Pre, SD of PD-Gd, T2-Pre and T2-Gd were significantly different molecular subtypes. However, there is still a significant amount of overlap of synthetic MRI values among different receptor status and molecular subtypes, which reduces the accuracy of the metrics used. Matsuda et al8 reported that T2-Gd were significantly higher in the Ki-67 high-proliferation group than in the low-proliferation group, which is in accordance with our results. However, we assessed not only the Ki-67 status but also other prognostic factors, as well as the molecular subtypes of breast cancer. In addition, we evaluated different subtypes of breast cancer besides ER-positive breast cancer. One of the major limitations in our study is the relatively small number of lesions. Hence future study with bigger cohort of subject is warranted. To conclude, SD of PD-Pre, SD of PD-Gd, T2-Pre and T2-Gd synthetic MRI values may be used to differentiate molecular subtypes of breast cancer.Acknowledgements
No acknowledgement found.References
1.Goldhirsch A, Wood WC, Coates AS, et al. Strategies for subtypes-dealing with the diversity of breast cancer: highlights of the St. Gallen international expert consensus on the primary therapy of early breast cancer 2011. Ann Oncol 2011;22(8):1736–1747.2.Perou CM, Sørlie T, Eisen MB, et al. Molecular portraits of human breast tumours. Nature 2000;406(6797):747–752. 3.Kim JH, Ko ES, Lim Y, et al. Breast cancer heterogeneity: MR imaging texture analysis and survival outcomes. Radiology 2017(3);282:665–6754.Guiu S, Michiels S, André F, et al. Molecular subclasses of breast cancer: how do we define them? The IMPAKT 2012 Working Group Statement. Ann Oncol 2012;23(12):2997–3006. 5.Youk JH, Son EJ, Chung J, et al. Triple-negative invasive breast cancer on dynamic contrast-enhanced and diffusion-weighted MR imaging: comparison with other breast cancer subtypes. Eur Radiol 2012;22(8):1724–1734.6.Agner SC, Rosen MA, Englander S, et al. Computerized image analysis for identifying triple-negative breast cancers and differentiating them from other molecular subtypes of breast cancer on dynamic contrast-enhanced MR images: a feasibility study. Radiology 2014;272(1):91–997.Horvat JV, Bernard-Davila B, Helbich TH, et al. Diffusion-weighted imaging (DWI) with apparent diffusion coefficient (ADC) mapping as a quantitative imaging biomarker for prediction of immunohistochemical receptor status, proliferation rate, and molecular subtypes of breast cancer. J Magn Reson Imaging 2019;50(3):836–846. 8.Matsuda M, Kido T, Tsuda T, et al. Utility of synthetic MRI in predicting the Ki-67 status of oestrogen receptor-positive breast cancer: a feasibility study. Clin Radiol 2020;75(5): 398.e1 -398.e8. 9.Jung Y, Gho SM, Back SN, et al. The feasibility of synthetic MRI in breast cancer patients: comparison of T2 relaxation time with multiecho spin echo T2 mapping method. Br J Radiol 2018;92(1093):20180479. 10.Liu L, Yin B, Shek K, et al. Role of quantitative analysis of T2 relaxation time in differentiating benign from malignant breast lesions. J Int Med Res 2018;46(5):1928–1935.Figures
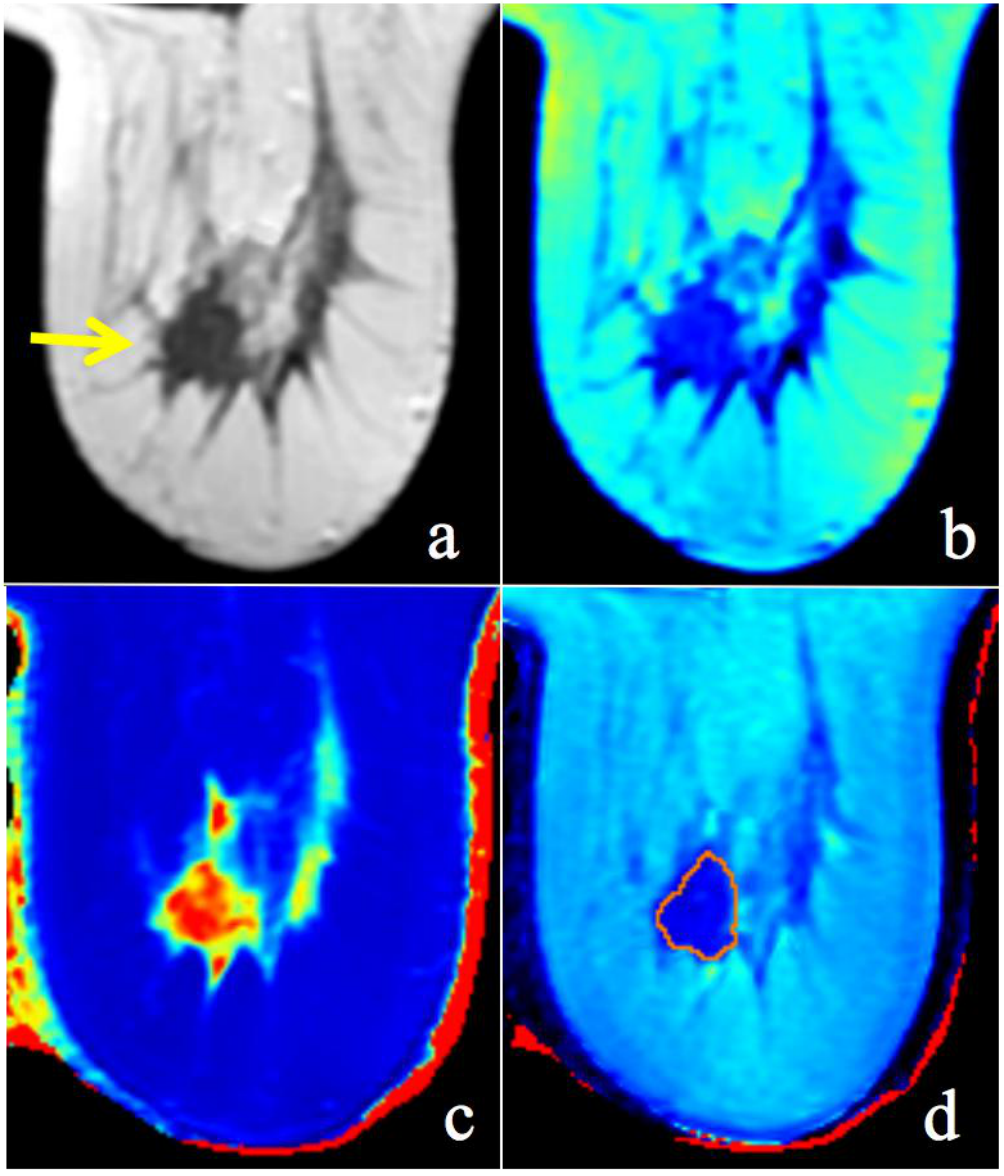
Figure 1: A 58-year-old woman with invasive ductal carcinoma of the right breast. An example of the synthetic images obtained before contrast agent injection. (a) T2(synthetic); (b) PD map; (c) T1 map; (d) T2map. The ROI showed the quantifications: T1-Pre = 1.71 10-3ms, SD of T1-Pre = 0.19, T2-Pre = 80.00 ms, SD of T2-Pre = 4.00, PD-Pre = 59.00 pu and SD of PD-Pre = 2.50 in this ER-positive, PR-negative, HER2-negative and Ki-67 high proliferating tumor.
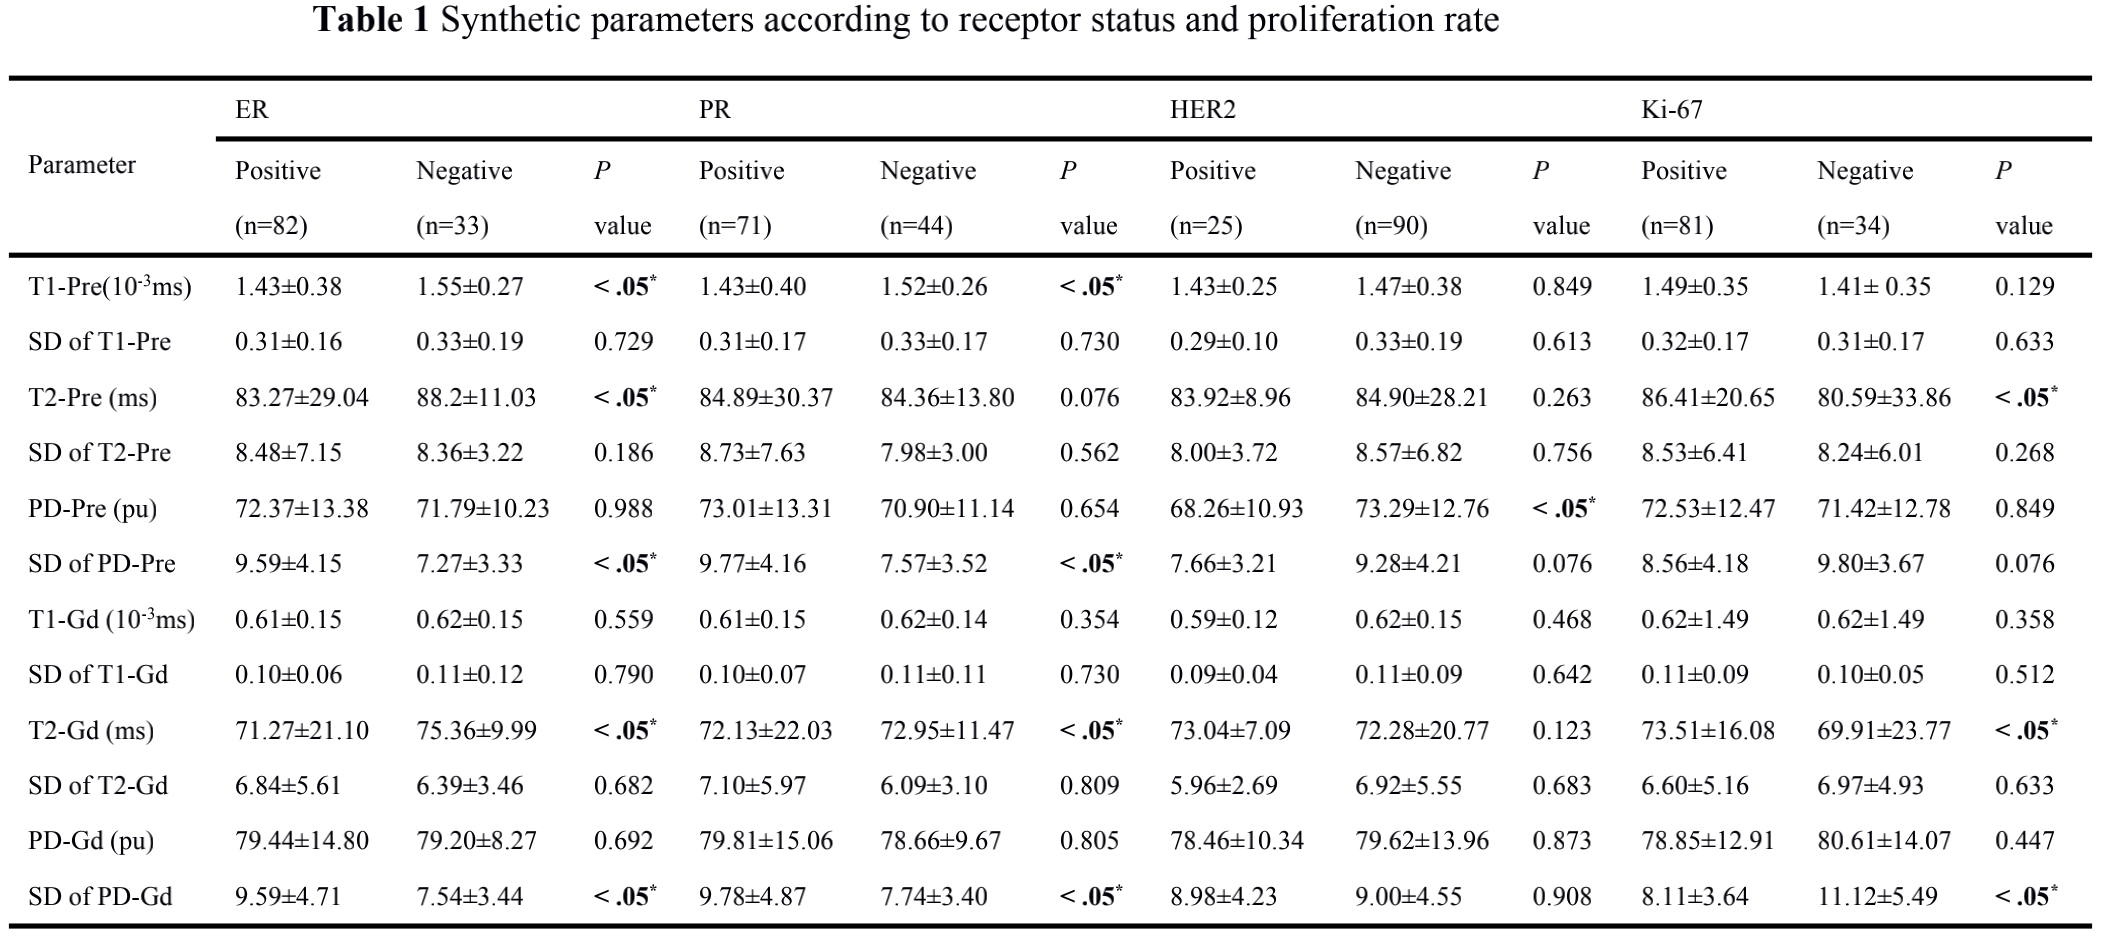
Note. Data are mean ± standard deviation. P values less than .05* were considered to indicate statistical significance.
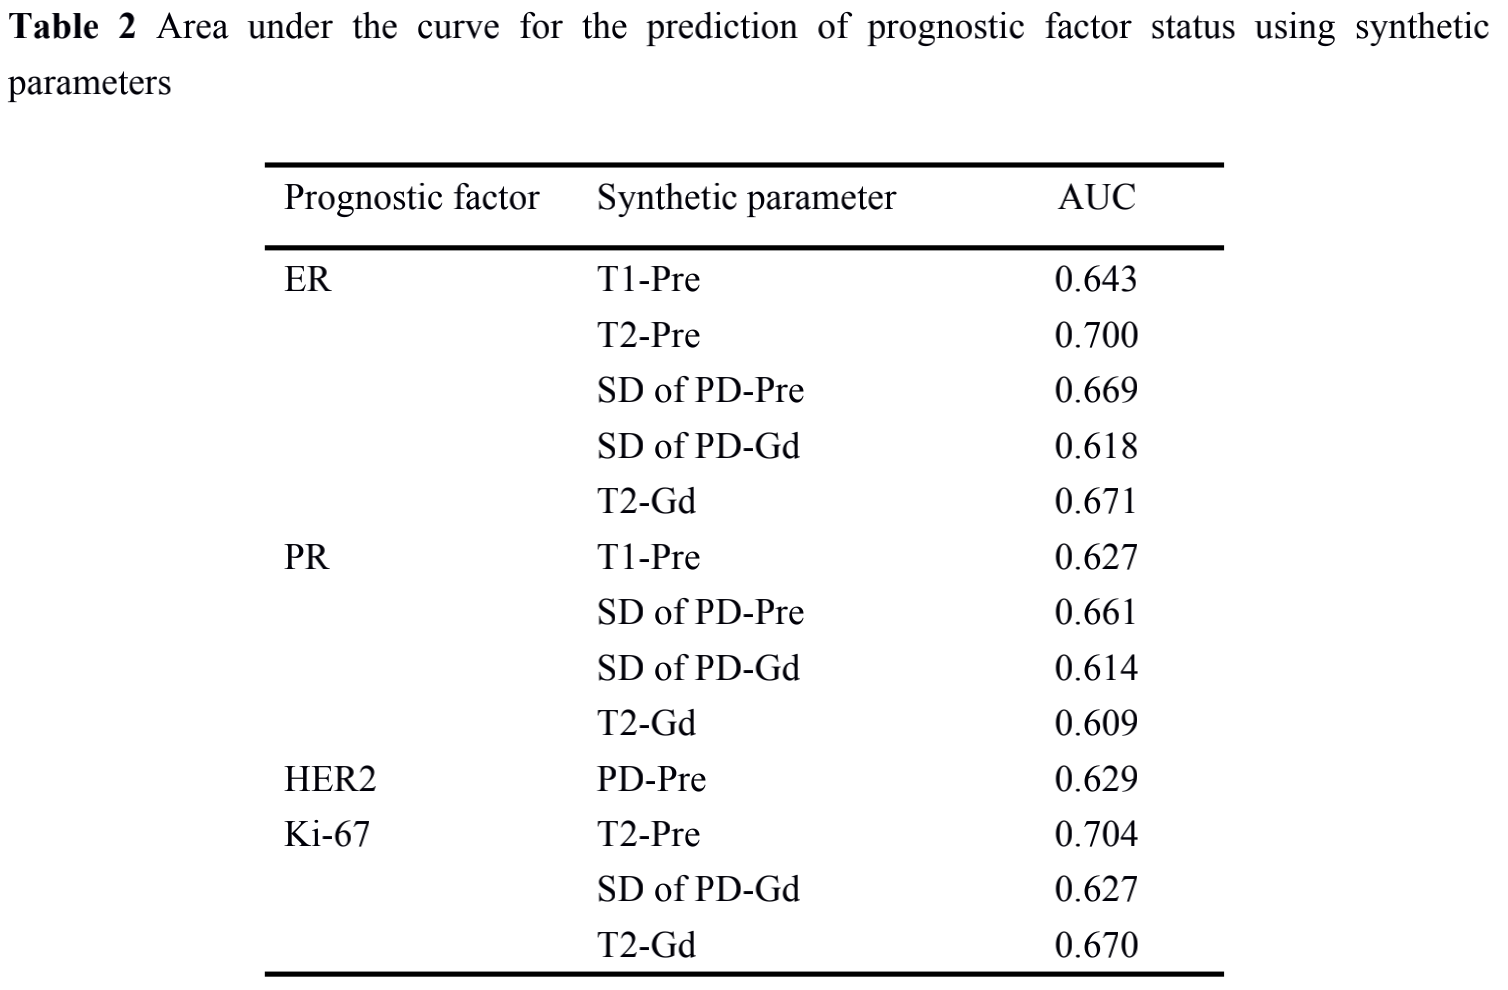
Note. AUC is area under the curve.
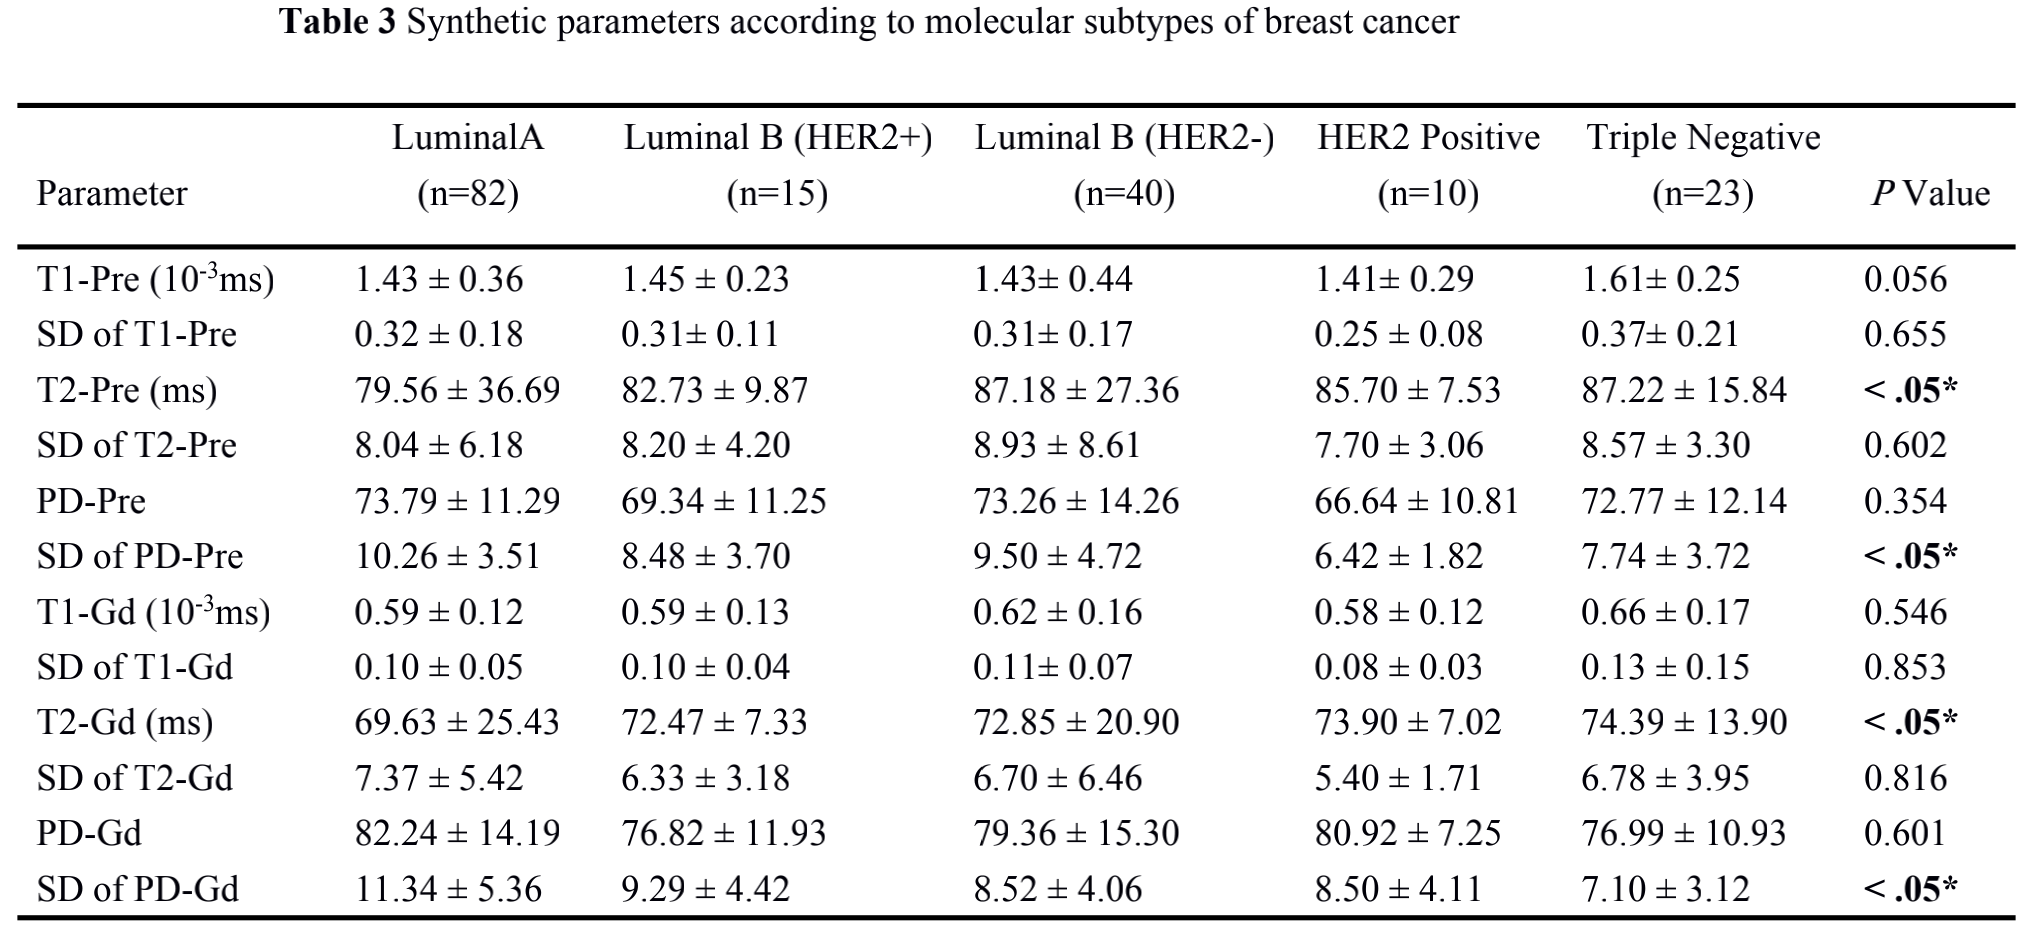
Note. Data are mean ± standard deviation. P values less than .05* were considered to indicate statistical significance.