3289
Comparison of lung T1 mapping using variable flip angle and Look-Locker techniques1Infection Immunity and Cardiovascular Disease, University of Sheffield, Sheffield, United Kingdom, 2Sheffield Teaching Hospitals NHS, Sheffield, United Kingdom
Synopsis
Lung T1 is sensitive to lung pathology, tissue and perfusion, and can be used to the calculation of quantitative DCE perfusion metrics. However, no comparisons have been made of common MRI T1 mapping sequences in the human lung. The aim of this work was to compare Look-Locker and variable flip angle T1 mapping sequences in phantoms and in vivo, in the lung, liver and blood. T1 measured in the phantom, blood and liver was significantly lower when measured using a Look-Locker acquisition than VFA, whereas lung T1 was significantly higher when measured using Look-Locker acquisition than when measured using VFA.
Introduction
Lung T1 mapping is sensitive to changes in lung tissue and lung perfusion[1-6] and is used for the calculation of quantitative perfusion MRI[7]. Lung T1 mapping is usually performed using a Look-Locker inversion recovery sequence with a gradient echo readout or a SPGR sequence acquired at multiple flip angles (variable flip angle, VFA). The Modified Look-Locker Inversion Recovery sequence (MOLLI), which is an interleaved and cardiac gated Look-Locker variant with a SSFP readout has also been used to calculate lung T1[6, 8].Comparisons of the accuracy and precision of VFA, Look-Locker and MOLLI sequences have been reported in phantoms and multiple organs. In phantom data, Look-Locker, MOLLI and VFA sequences with B1 correction have excellent agreement with spin-echo inversion recovery[9, 10]. In vivo data has shown less consistent results with significant differences in T1 measured using different sequences[9, 11]. To the authors knowledge, no comparisons have been made between in vivo human lung T1 calculated using VFA and Look-Locker sequences, despite both sequences having being performed in multiple studies in the lung[1, 2, 5, 7, 12-15].
In vivo T1 is sensitive to multiple physiological effects which can alter the measured T1, including T2* and TE dependency[2], T2 dependency[16], the in-flow of non-inverted blood [16, 17], magnetisation transfer and, for MOLLI sequences, heart-rate[16]. The aim of this work is to compare T1 measured using inversion recovery and VFA sequences in phantoms and in vivo.
Methods
Look-Locker, VFA and MOLLI T1 mapping was performed on 18 phantoms with known T1 at 1.5T on a GE HDx scanner.The 2D Look-Locker inversion recovery sequence[18, 19] acquisition parameters were: TR: 3.2 ms; TE: 0.9 ms; flip angle: 7°; phase × frequency: 128×128; slice thickness: 15 mm; FOV: 440 mm2; overall acquisition time=7s.
The 3D VFA sequence acquisition parameters were: 3 acquisitions with flip angles of 2, 10 and 30°; TE: 0.9ms; phase x frequency = 80x200; slice thickness: 4mm; FOV: 400mm2.
The 2D MOLLI sequence acquisition parameters were: image sequence: 3-3-5; TR: 3.2ms ; TE: 1.0 ms; flip angle: 35°; phase x frequency: 192x192; slice thickness: 5.1mm; ASSET: 2; FOV: 400mm2; acquisition time: 17s for 60bpm heart rate.
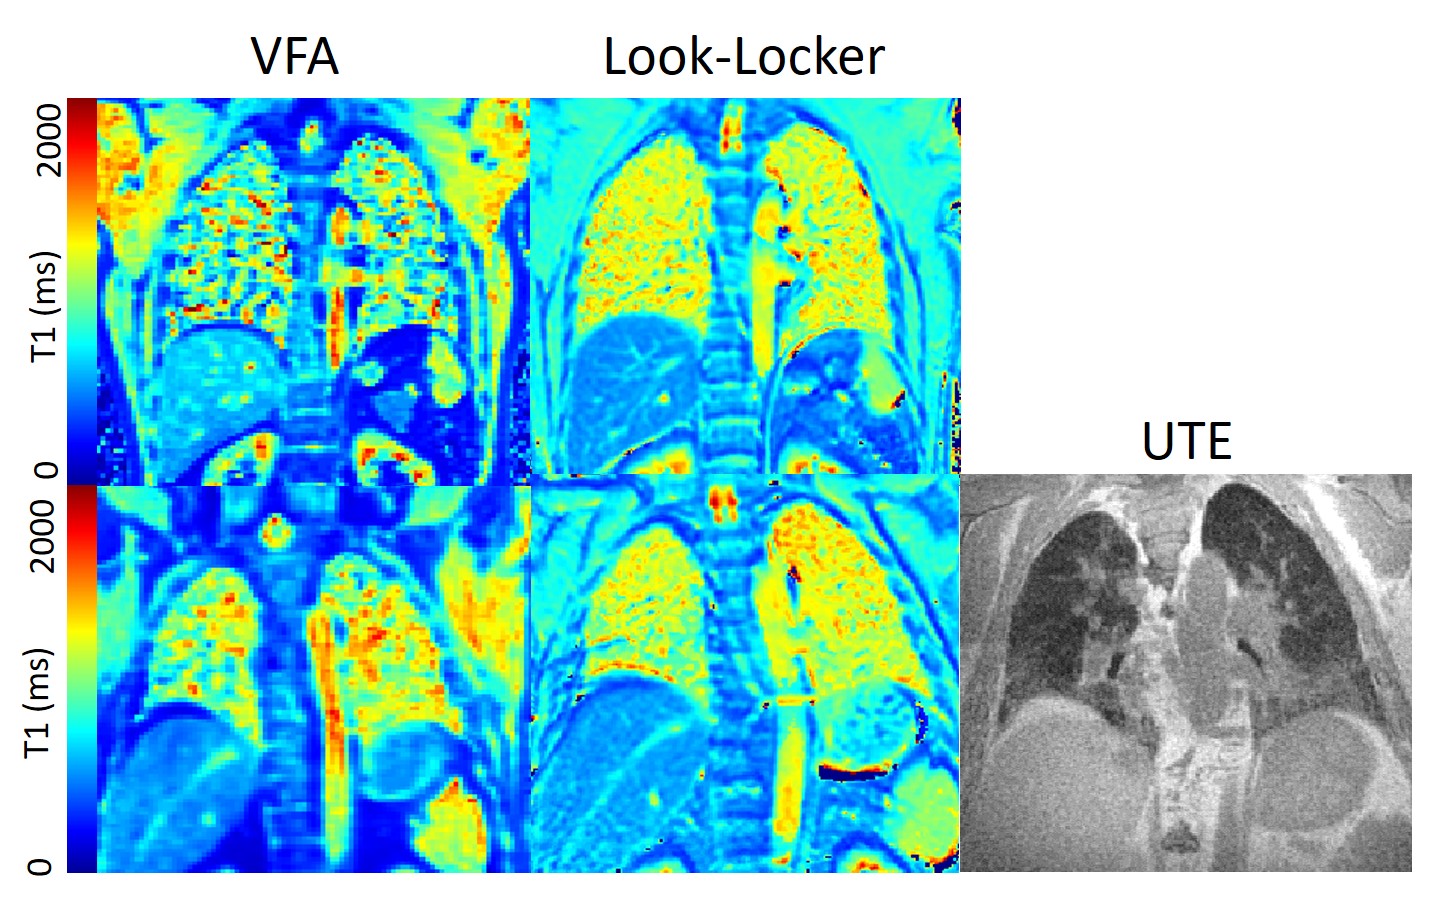
4 volunteers and 8 patients with IPF underwent Look-Locker and VFA T1 mapping with the aforementioned parameters. Look-Locker and MOLLI slices were positioned through the descending aorta. A similar slice from the 3D VFA sequence was selected for analysis. Regions of interest were also placed in the liver and descending aorta.
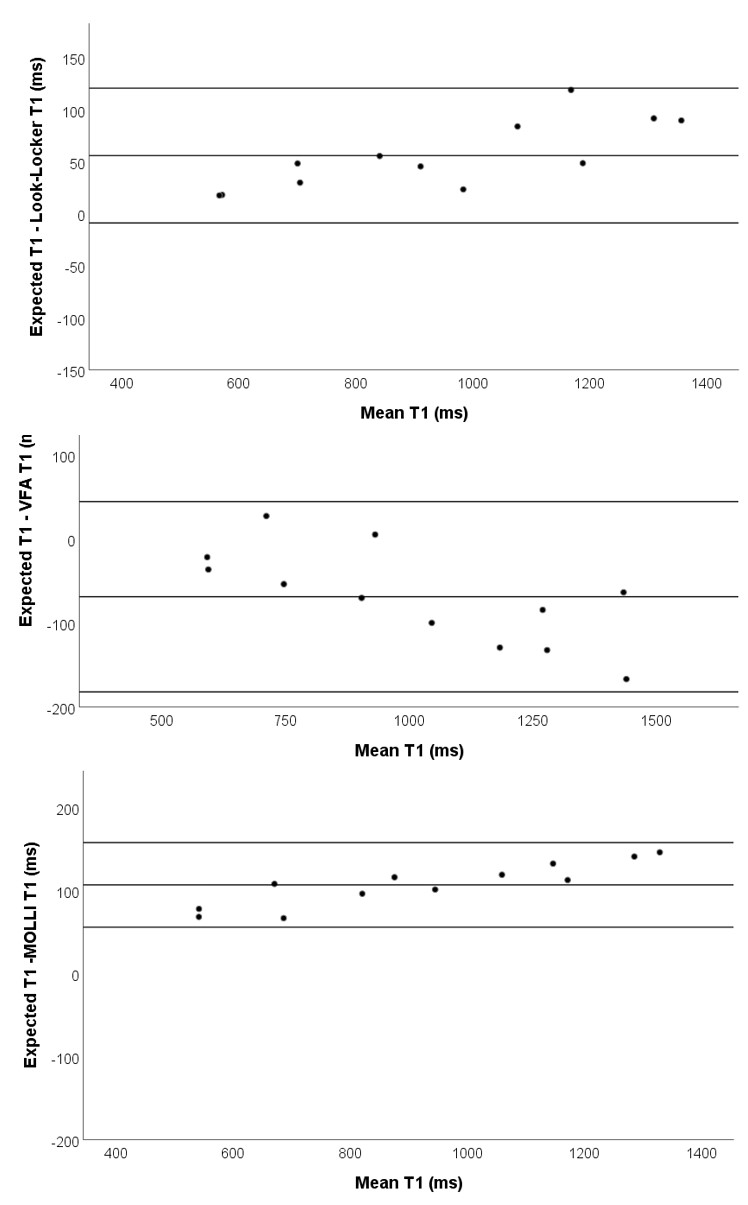
Phantom T1 measurements were presented using Bland-Altman plots, and mean differences and one-way random intraclass correlation coefficients were calculated. In vivo T1 was also compared using mean differences and one-way random intraclass correlation coefficients for the lung, liver and descending aorta (blood) separately. Paired-t tests were used to test for difference in T1 between methods.
VFA and Look-Locker acquisitions in 12 phantoms and 7 patients with IPF and 3 healthy volunteers were re-sized during post-processing to the same size and slice thickness and to assess the effect of image size and slice thickness on resultant T1.
Results
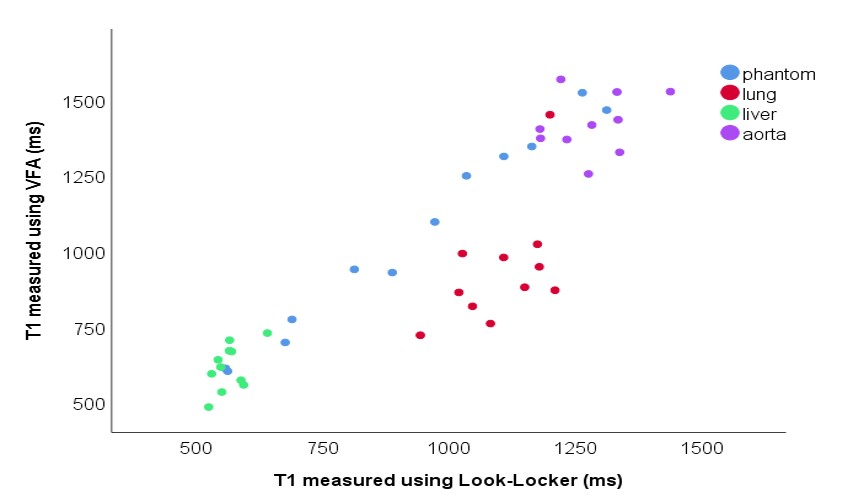
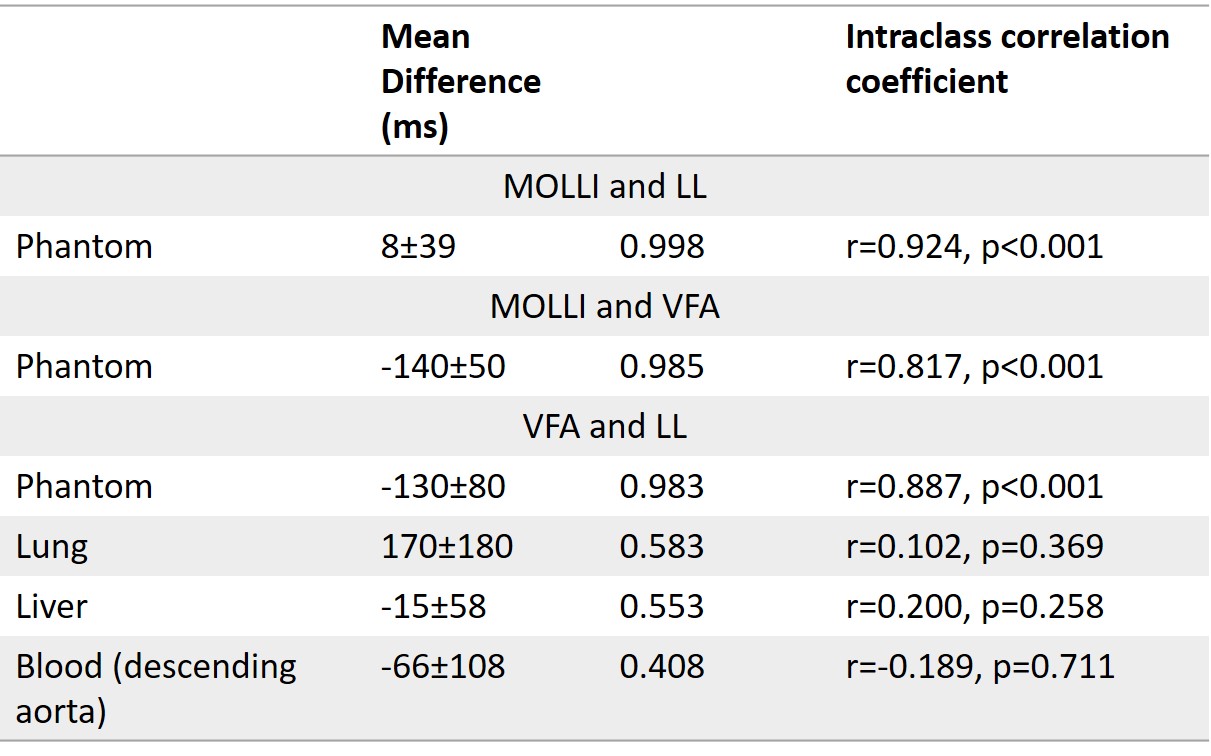
In phantoms, Look-Locker and MOLLI sequences systematically underestimate T1 (Figure 1), with an increasing underestimation at longer T1. VFA calculated a small overestimation of T1 with a wider standard deviation in T1 difference. MOLLI and LL T1 showed excellent agreement.Lung T1 values were calculated for healthy volunteers and patients with IPF (Figure 2). Lung T1 was significantly different between patients with IPF and healthy volunteers when measured using the Look-Locker sequence (volunteers: T1=1180±30ms; patients: T1=1040±90ms; p=0.010) but not when measured using the VFA sequence (volunteers: T1=1040±90ms; patients: T1=880±190ms; p=0.231).
In phantom data, VFA calculated a significantly higher T1 than Look-Locker (p<0.001). For in vivo data, VFA calculated a significantly higher T1 than Look-Locker in the liver and blood (p=0.030 and p=0.003, respectively). However, in the lung VFA calculated a significantly lower T1 than Look-Locker (p=0.007) (Table 1).
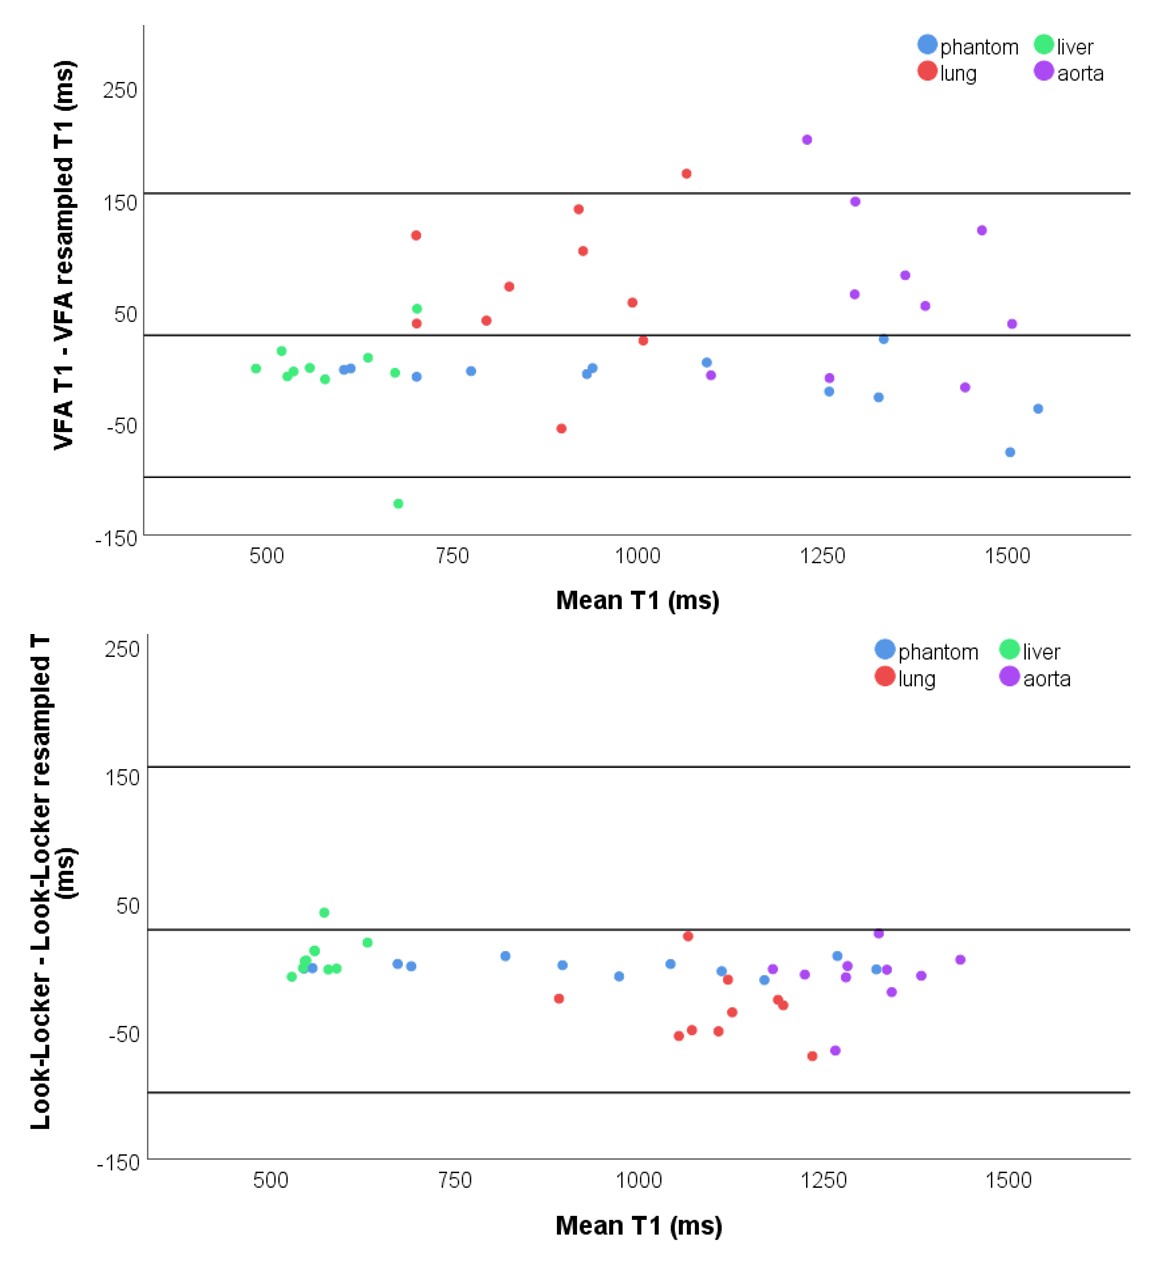
Decreasing slice thickness (4mm to 15mm) during post-processing, decreased VFA T1 significantly in the blood and lung. Downsizing Look-Locker images in the phase direction from 128 to 80mm significantly increased lung T1. No other significant differences in T1 due to resizing were found (Figure 4).
Discussion
In phantoms, there were significant differences between VFA and inversion recovery methods, which are consistent with literature[11, 16].In vivo data showed significant differences between T1 measured using VFA and Look-Locker, which varied depending on the tissue. Blood and liver T1 was lower when measured using Look-Locker sequences than VFA, however T1 measured using VFA was lower in the lung than T1 measured using Look-Locker.
Significant differences between lung T1 in healthy volunteers and patients were not found in VFA T1, which is likely due to the large standard deviation of T1 in these results.
Decreasing VFA slice thickness during post-processing decreased lung T1, suggesting it can not be responsible for the differences in T1 between the sequences.
Conclusion
In vivo, there are significant differences in T1 measured with inversion recovery and VFA sequences, which differ in different tissues. Lung T1 calculated using a VFA sequence is significantly lower than T1 calculated using a Look-locker sequence.Acknowledgements
This work was supported by MRC grant MR/M008894/1 and Wellcome Trust grant: 205188/Z/16/Z. The views expressed in this work are those of the author(s) and not necessarily those of the NHS, or the Department of Health.References
1. Triphan, S.M.F., et al., Echo Time-Dependence of Observed Lung T1 in Patients With Cystic Fibrosis and Correlation With Clinical Metrics. J Magn Reson Imaging, 2020: p. e27271.
2. Triphan, S.M., et al., Echo time dependence of observed T1 in the human lung. J Magn Reson Imaging, 2015. 42(3): p. 610-6.
3. Stadler, A., et al., T1 mapping of the entire lung parenchyma: Influence of respiratory phase and correlation to lung function test results in patients with diffuse lung disease. Magnetic Resonance in Medicine, 2008. 59(1): p. 96-101.
4. Jobst, B.J., et al., Functional lung MRI in chronic obstructive pulmonary disease: comparison of T1 mapping, oxygen-enhanced T1 mapping and dynamic contrast enhanced perfusion. PLoS One, 2015. 10(3): p. e0121520.
5. Saunders, L.C., et al., Free breathing lung T(1)mapping using image registration in patients with idiopathic pulmonary fibrosis. Magnetic Resonance in Medicine, 2020.
6. Mirsadraee, S., et al., T1 characteristics of interstitial pulmonary fibrosis on 3T MRI-a predictor of early interstitial change? Quant Imaging Med Surg, 2016. 6(1): p. 42-9.
7. Naish, J.H., et al., Modeling of Contrast Agent Kinetics in the Lung Using T-1-Weighted Dynamic Contrast-Enhanced MRI. Magnetic Resonance in Medicine, 2009. 61(6): p. 1507-1514.
8. Neemuchwala, F., et al., Lung T1 mapping magnetic resonance imaging in the assessment of pulmonary disease in children with cystic fibrosis: a pilot study. Pediatric Radiology, 2020. 50(7): p. 923-934.
9. Stikov, N., et al., On the accuracy of T1 mapping: searching for common ground. Magn Reson Med, 2015. 73(2): p. 514-22.
10. Cho, Y.J., et al., Validation and feasibility of liver T1 mapping using free breathing MOLLI sequence in children and young adults. Sci Rep, 2020. 10(1): p. 18390.
11. Tirkes, T., et al., Evaluation of variable flip angle, MOLLI, SASHA, and IR-SNAPSHOT pulse sequences for T1 relaxometry and extracellular volume imaging of the pancreas and liver. MAGMA, 2019. 32(5): p. 559-566.
12. Jobst, B.J., et al., Functional Lung MRI in Chronic Obstructive Pulmonary Disease: Comparison of T1 Mapping, Oxygen-Enhanced T1 Mapping and Dynamic Contrast Enhanced Perfusion. Plos One, 2015. 10(3).
13. Triphan, S.M.F., et al., Reproducibility and comparison of oxygen-enhanced T-1 quantification in COPD and asthma patients. Plos One, 2017. 12(2).
14. Alamidi, D.F., et al., T-1 Relaxation Time in Lungs of Asymptomatic Smokers. Plos One, 2016. 11(3).
15. Lee, S.H., et al., Dual-input tracer kinetic modeling of dynamic contrast-enhanced MRI in thoracic malignancies. Journal of Applied Clinical Medical Physics, 2019. 20(11): p. 169-188.
16. Kellman, P. and M.S. Hansen, T1-mapping in the heart: accuracy and precision. J Cardiovasc Magn Reson, 2014. 16: p. 2.
17. Liberman, G., Y. Louzoun, and D. Ben Bashat, T-1 Mapping Using Variable Flip Angle SPGR Data With Flip Angle Correction. Journal of Magnetic Resonance Imaging, 2014. 40(1): p. 171-180.
18. Jakob, P.M., et al., Rapid quantitative lung (1)H T(1) mapping. Journal of Magnetic Resonance Imaging, 2001. 14(6): p. 795-9.
19. Look, D.C.a.L., D. R., Time Saving in Measurement of NMR and EPR Relaxation Times. Review of Scientific Instruments 1970. 41(250).
Figures