3288
Optimization of Spoiled GRE-based IR Acquisition Scheme for 3D Cardiac T1 Mapping at 3T1Gordon Center for Medical Imaging, Department of Radiology, Massachusetts General Hospital and Harvard Medical School, Boston, MA, United States, 2GE Healthcare, Boston, MA, United States, 3LTCI, Télécom Paris, Institut Polytechnique de Paris, Paris, France
Synopsis
Spoiled gradient echo (GRE) is an attractive alternative to balanced steady-state free precession (bSSFP) for ECG-gated recovery (IR)-based volumetric myocardial T1 mapping at 3T. However, the robustness of T1 estimation from spoiled GRE-based ECG-gated IR acquisitions has not been thoroughly investigated under different schemes and in the presence of B1 inhomogeneity. This work investigated effects of B1 inhomogeneity in the context of T1 estimation, considering B1 inhomogeneity in the model for T1 estimation, and characterized effects of flip angle and heart rate to optimize a spoiled GRE-based ECG-gated IR acquisition scheme for 3D cardiac T1 mapping.
Introduction
Electrocardiography (ECG)-gated inversion recovery (IR) acquisition is commonly used in myocardial T1 mapping1. Various ECG-gated IR acquisition schemes have been proposed and optimized at different field strengths, mostly based on balanced steady-state free precession (bSSFP) acquisition2. Balanced SSFP show advantages in SNR, however, it suffers from banding artifacts due to B0 inhomogeneities at 3T. Spoiled gradient echo (GRE) is an attractive alternative, especially for volumetric myocardial T1 mapping at 3T. The robustness of T1 estimation from spoiled GRE-based ECG-gated IR schemes has not been thoroughly investigated under different schemes and in the presence of B1 inhomogeneity. In this work, we investigated the effects of B1 inhomogeneity in the context of T1 estimation, considering B1 inhomogeneity in the model for T1 estimation, and characterized effects of flip angle and heart rate to optimize spoiled GRE-based ECG-gated IR acquisition scheme for 3D cardiac T1 mapping.Methods
Simulation StudyBloch equation simulations were performed to investigate effect of B1 inhomogeneity on estimated T1. ECG-gated-IR acquisition schemes of 5-(3)-5-(3) and 8-8 (where N-[M] scheme denotes N number of cardiac cycles for acquisition and M number of cardiac cycles for signal recovery) were investigated for spoiled GRE acquisition at different B1 scenarios (B1 = 0.8, 1, 1.2). Monte Carlo simulations were performed with 10,000 iterations and the same noise level across variations. Normalized standard deviation (SD) (i.e., standard deviation of T1 estimation normalized by standard deviation of noise and square root of acquisition efficiency) was used to assess precision in T1 estimation for different schemes. ECG-gated IR schemes with variation in numbers of cardiac cycles for acquisition and signal recovery period (N-N, N-[1]-N-[1], N-[2]-N-[2], N-[3]-N-[3] schemes) were investigated for spoiled GRE acquisition. Note the N-N scheme has highest data acquisition efficiency. This is desirable for reducing imaging time, however performance of the scheme on T1 estimation is unclear. Representative ECG-gated IR schemes of 8-8, 5-(3)-5-(3), and 10-(3)-10-(3) were also investigated for spoiled GRE acquisition with variation in flip angle (from 1-15 in 1° increments). Additionally, 10-(3)-10-(3) scheme was investigated for spoiled GRE acquisition over heart rates from 50 to 120 in 5bpm increments. Simulation details were: heart rate=80bpm, acquisition window=180ms, and TI=100 and 180ms, and flip angle=6°.
Simulation studies utilized a pre-calculated look-up table of Bloch equation simulated signal dynamics to fit the T1, with and without consideration of B1 inhomogeneity in the model. The pre-calculated look-up table was generated for a range of T1 from 1-3000ms in increments of 1ms, and additionally for a range of B1 from 0-2 in increments of 0.01, when B1 inhomogeneity was considered.
Phantom and In Vivo Study
Experiments were performed using a 3T MR scanner. For the phantom study, ECG-gated IR schemes of 8-8, 5-(3)-5-(3), 10-(3)-10-(3) were performed at end-diastole with simulated heart rate of 80bpm using spoiled GRE readout. The phantom consisted of 21-vials containing deionized water doped with equally distributed concentrations of gadolinium (Dotarem®) from 0-0.5mM/L. Imaging parameters were: acquisition-window-per-cardiac-cycle=34ms, TI=100 and 180ms, field-of-view (FOV)=360×304mm2, matrix-size=192×162, slice-thickness=6mm, TR/TE=3.4/1.9ms and flip-angle=9°. IR with fast spin echo (FSE) readout and MOLLI3 were performed to provide reference and comparison of T1, respectively.
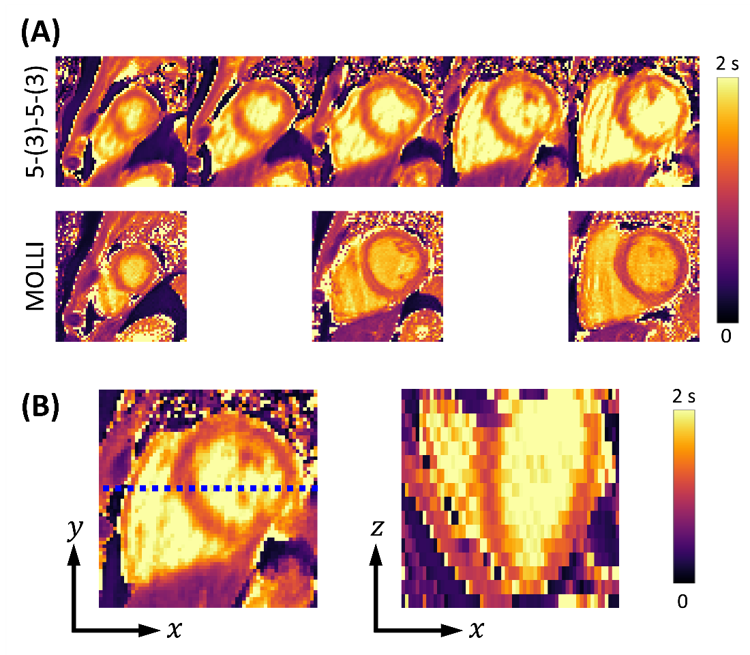
In vivo experiments were performed on a healthy volunteer using ECG-gated IR scheme 5-(3)-5-(3) at end-diastole with spoiled GRE. Subspace-based data acquisition and image reconstruction methods were used4. Imaging parameters were: acquisition-window-per-cardiac-cycle=204ms, TI=100 and 180ms, FOV=360×304×96mm3, matrix-size=192×162×16, TR/TE=3.0/1.5ms, and flip-angle=6°. For comparison, three slices in the apical, mid-cavity, basal regions of the heart were acquired using MOLLI3.
T1 was estimated for each voxel using cosine similarity between signal dynamics from data and from the pre-calculated look-up table of Bloch equation simulation that includes effects from B1 inhomogeneity.
Results and Discussion
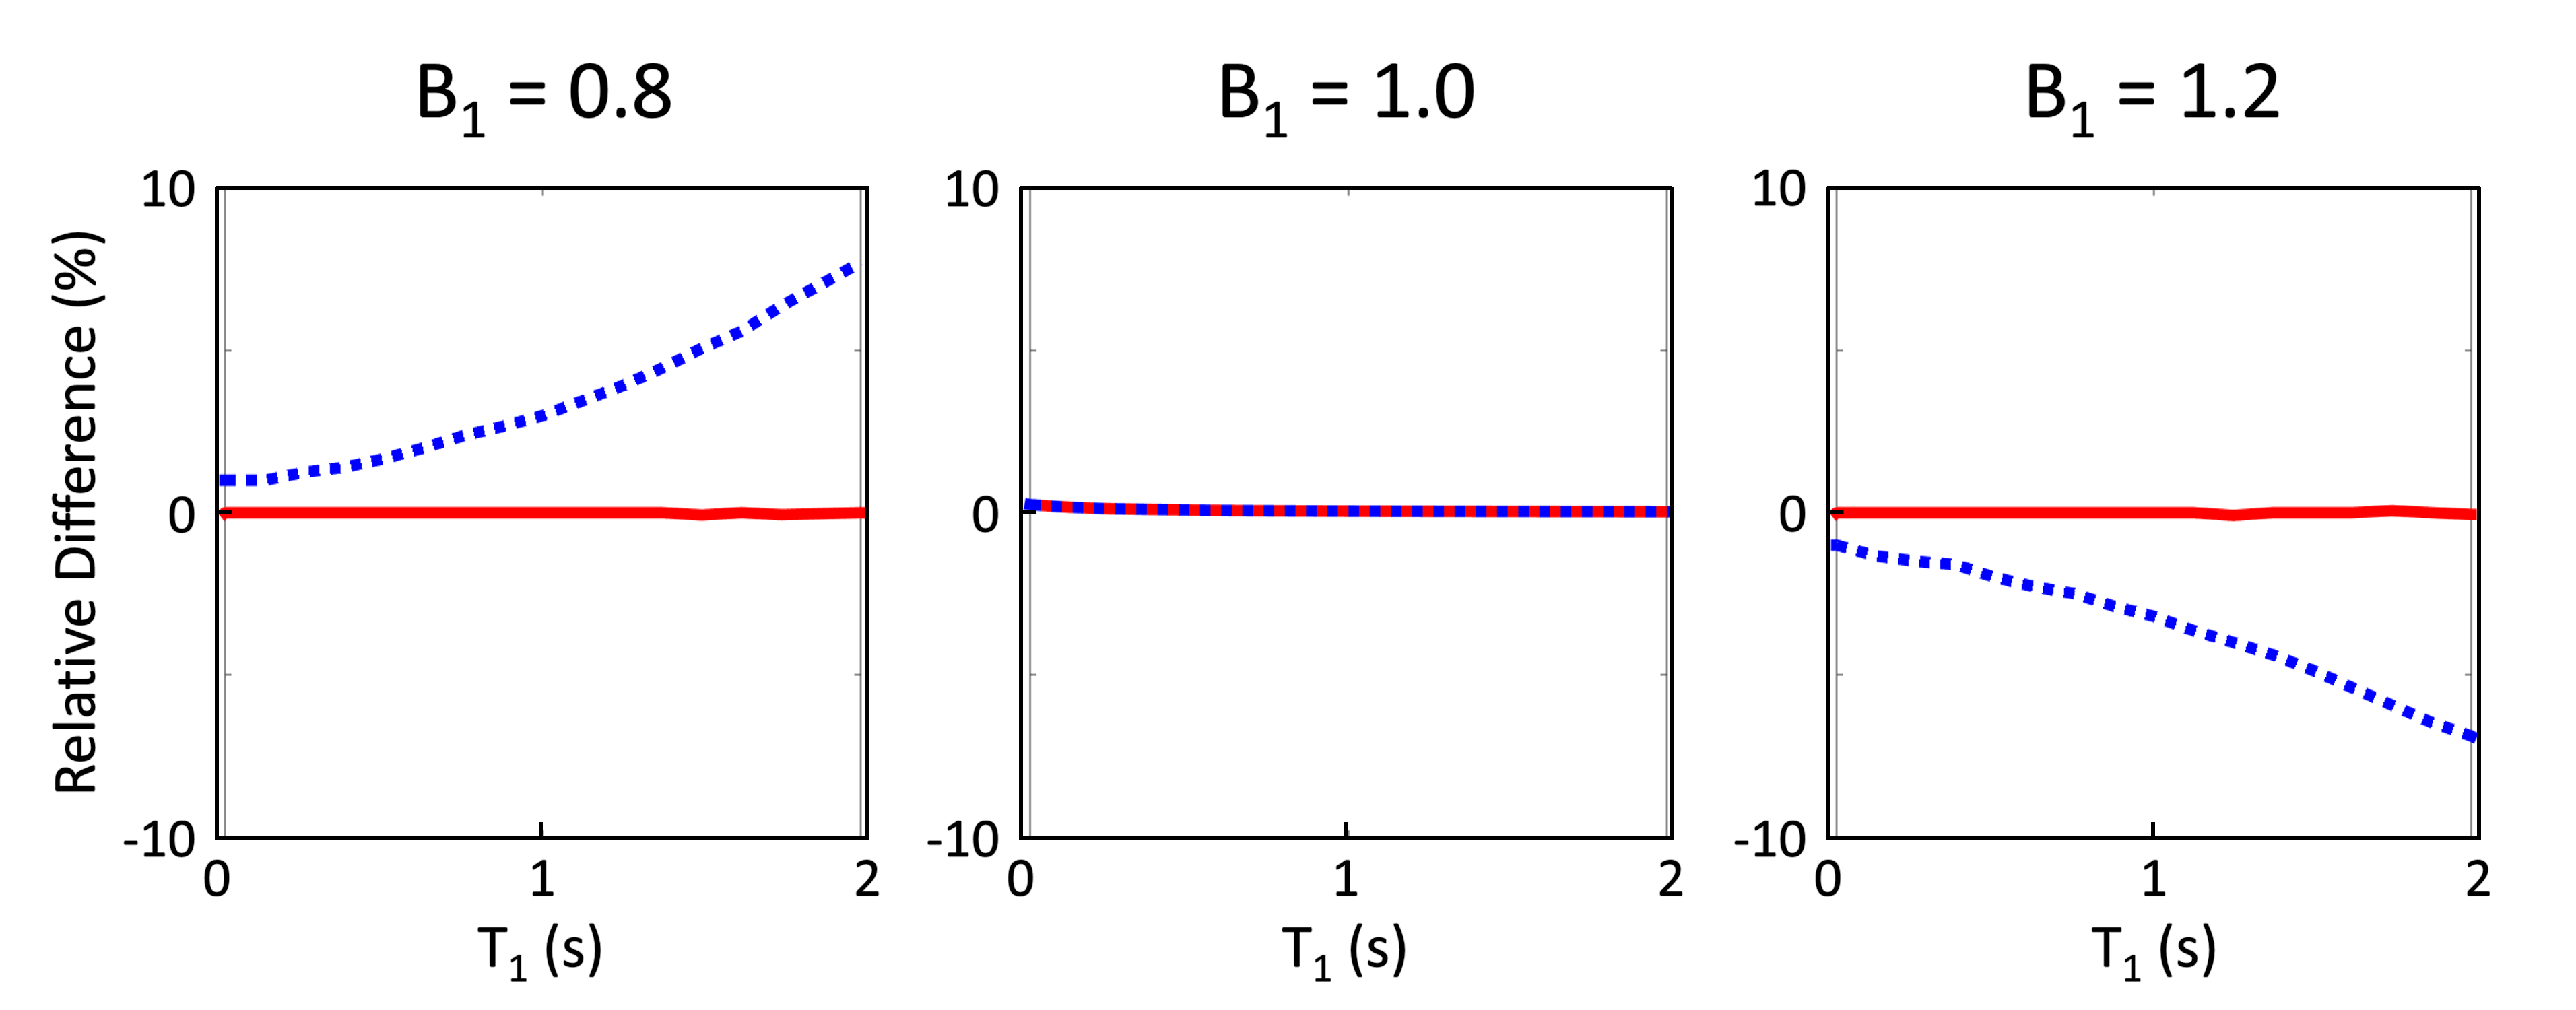
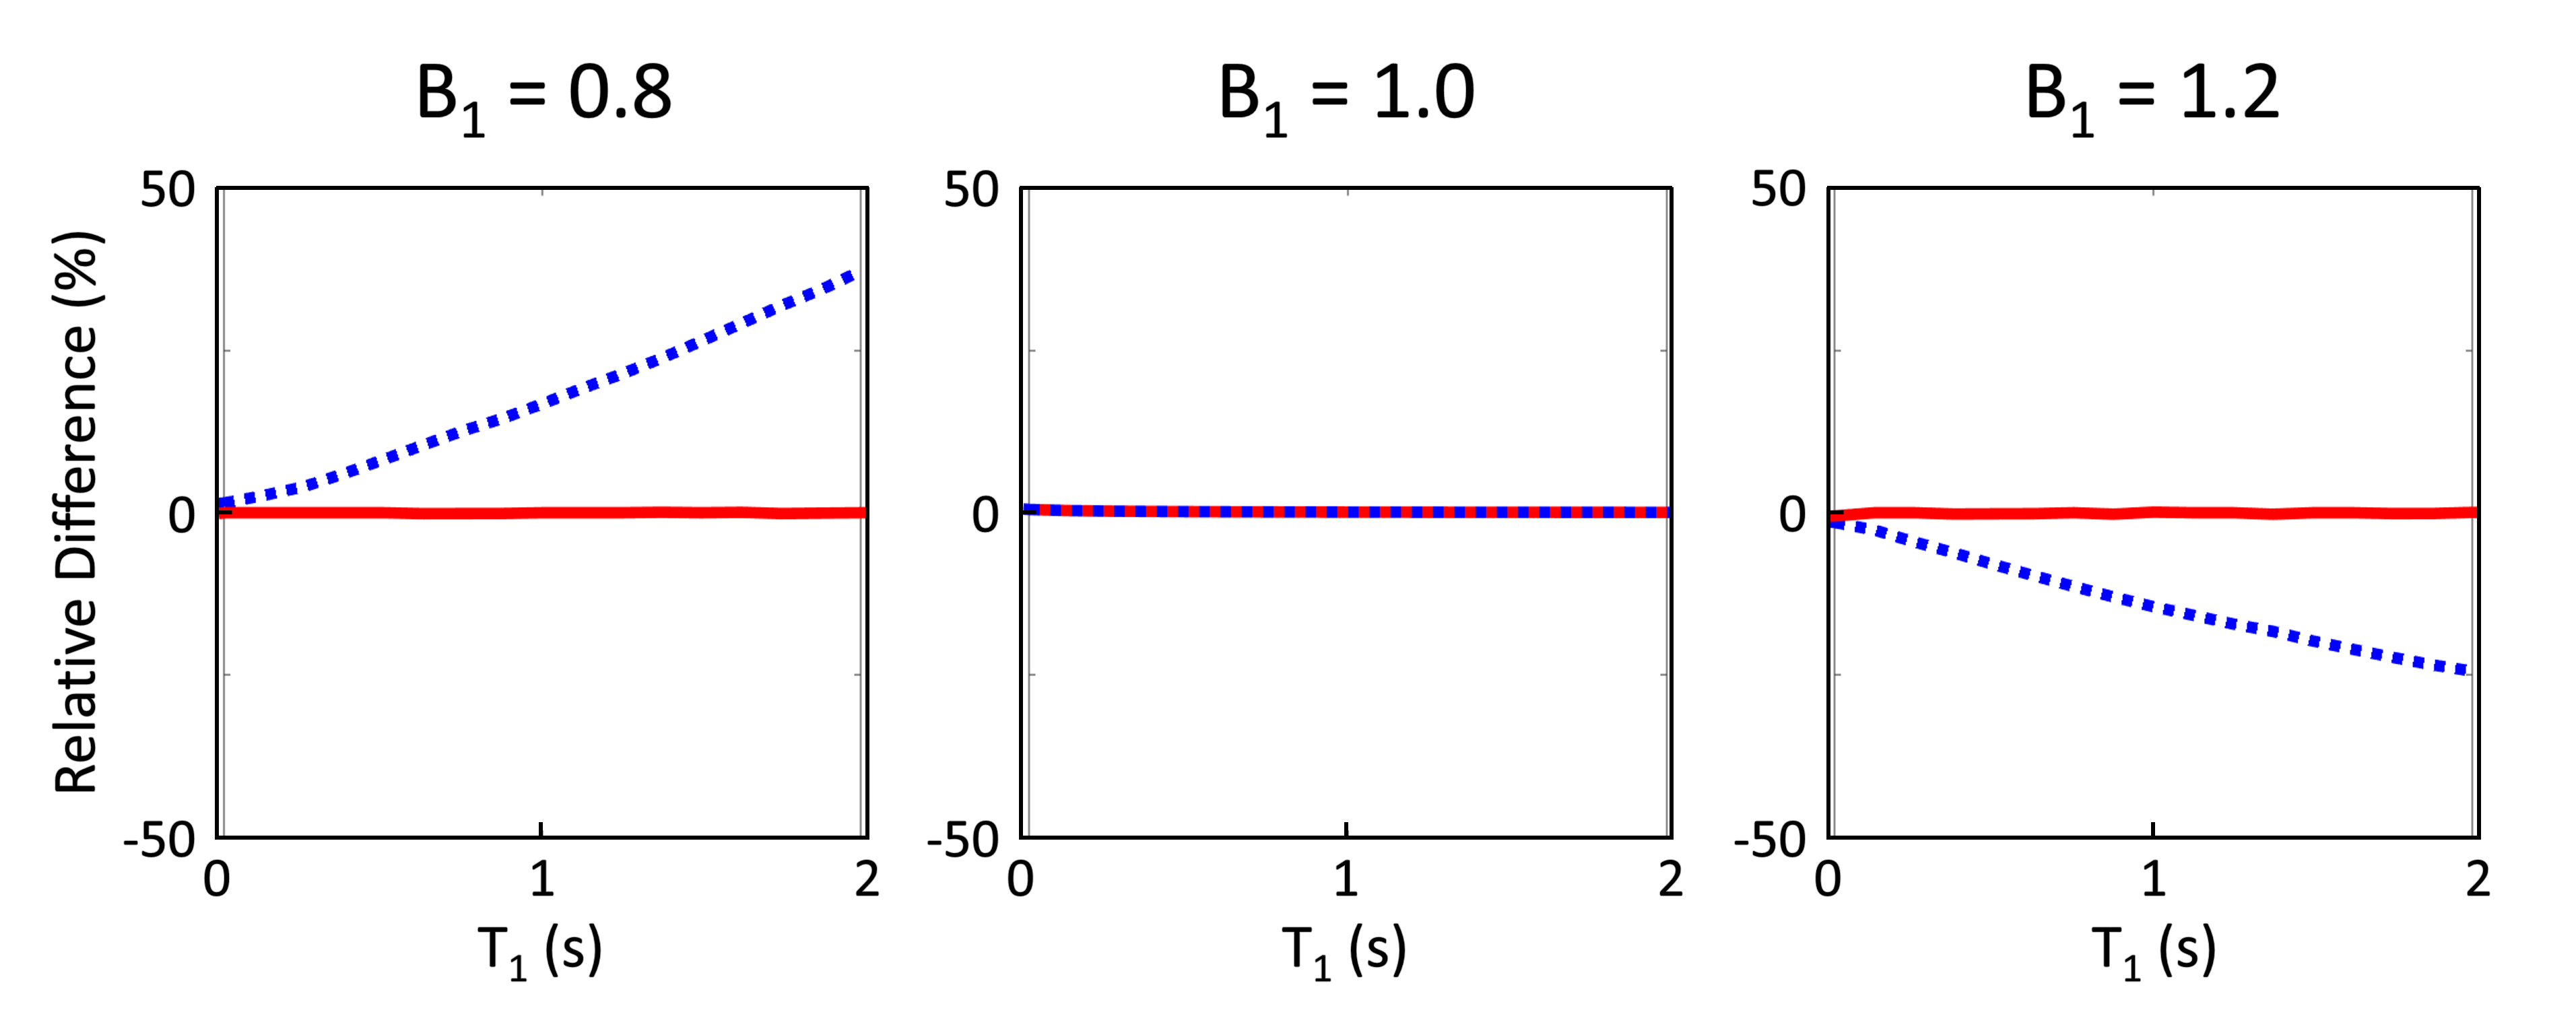
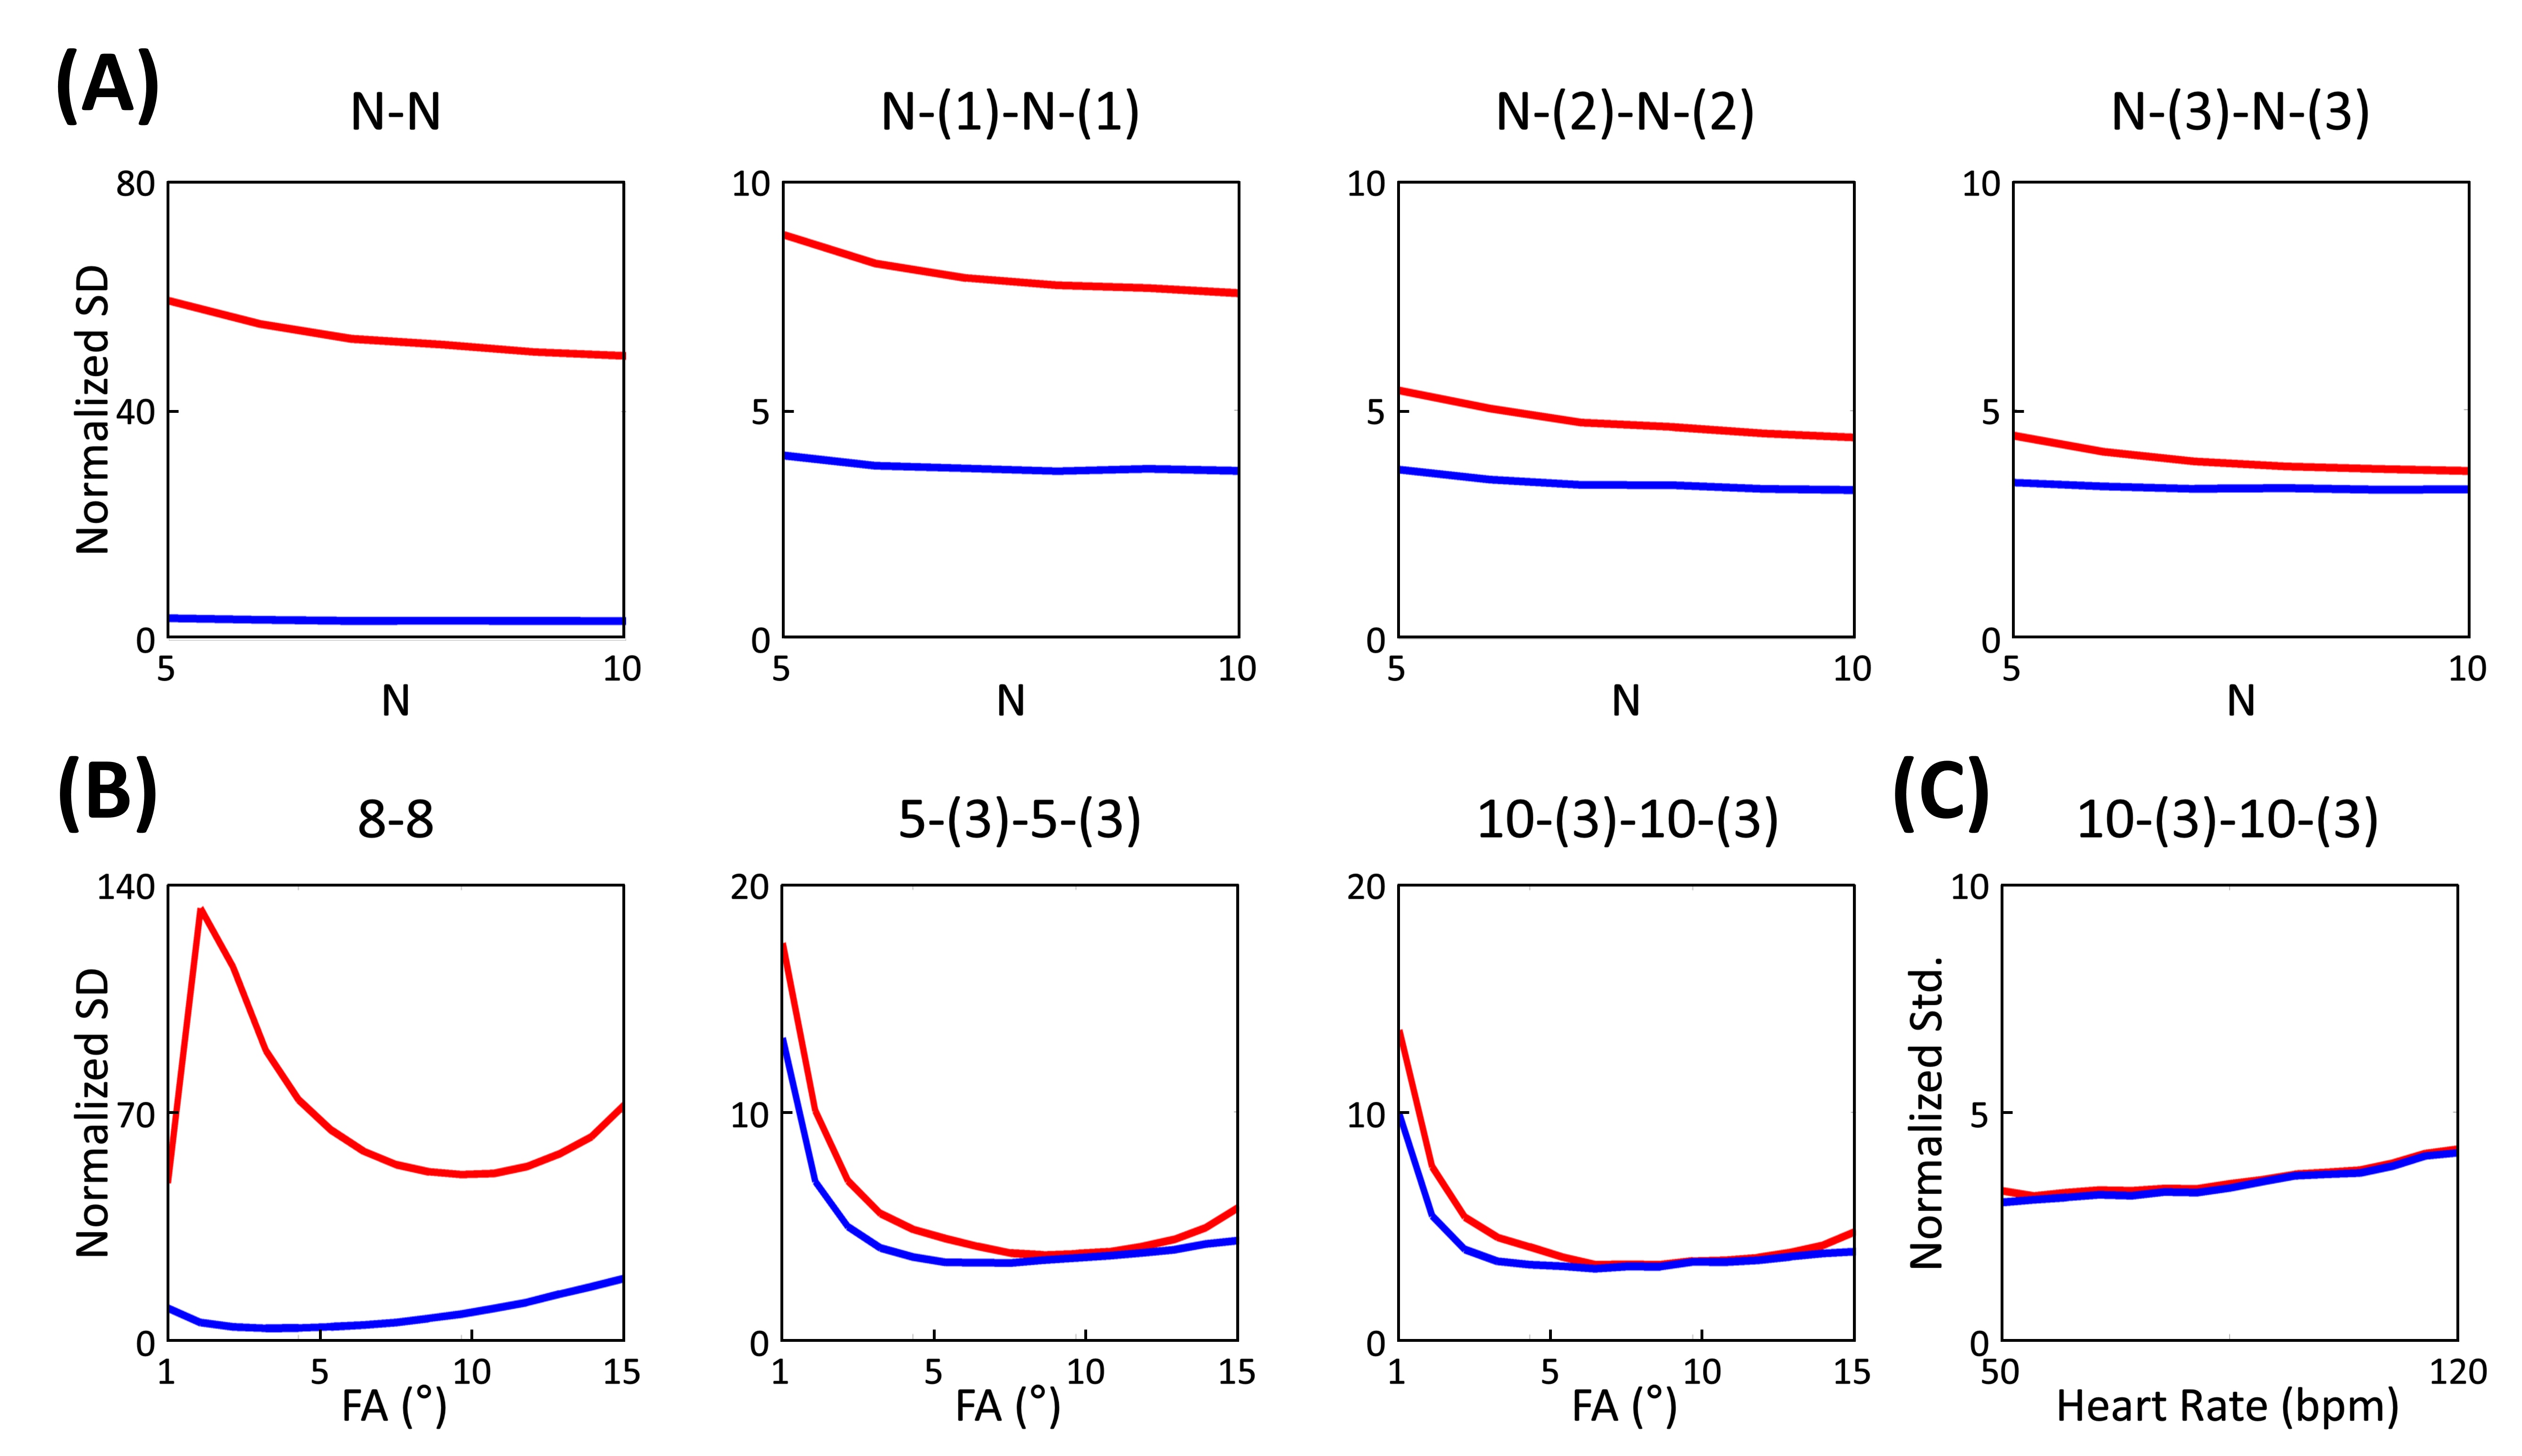
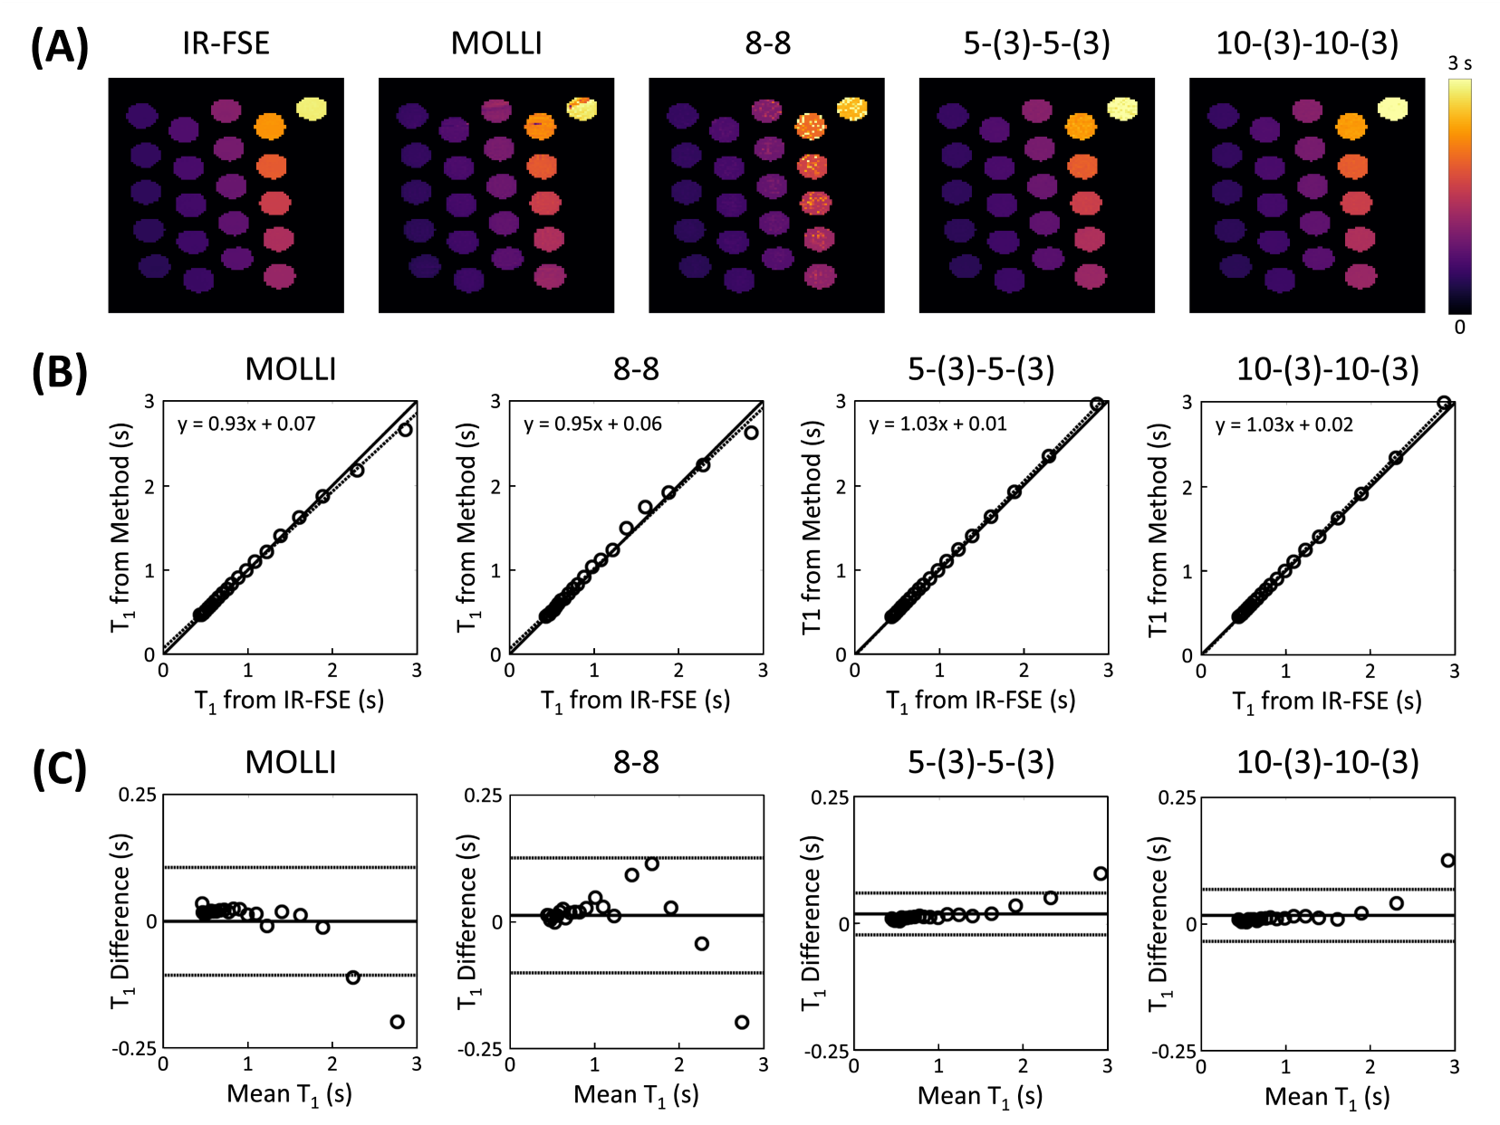
Simulations from the noiseless case showed bias in T1 estimation for 5-(3)-5-(3) and 8-8 schemes in the presence of B1 inhomogeneity (Figs.1A and 2A). This bias was significantly reduced when B1 inhomogeneity was considered in the model for fitting (Figs.1B and 2B). Simulations with noise showed that normalized SD increased when considering B1 inhomogeneity in the model for T1 estimation (Fig.3A). Increasing the period for signal recovery between acquisitions decreased normalized SD, to the level similar to the T1 estimation case without consideration of B1 (Fig.3A). 5-(3)-5-(3) and 10-(3)-10-(3) schemes showed overall lower normalized SD compared to the 8-8 scheme, with lowest normalized SD observed for flip angle value around 9° (Fig.3B). For the 10-(3)-10-(3) scheme, similar levels of normalized SD were observed for heart rate variations ranging from 50-120 bpm, for both cases with and without consideration of B1 inhomogeneity during T1 estimation (Fig.3C).Phantom results showed noticeable bias in the estimated T1 from MOLLI (Fig.4). Overall lower bias and variance was observed in the estimated T1 from all vials for 5-(3)-5-(3) and 10-(3)-10-(3) schemes using spoiled GRE acquisition compared to MOLLI and the 8-8 scheme (Fig.4). In vivo results showed reconstruction of 3D T1 maps from 5-(3)-5-(3) schemes using spoiled GRE acquisition with myocardial T1 comparable to MOLLI (Fig.5).
Conclusion
The accuracy of ECG-gated IR schemes with spoiled GRE readout can be improved by incorporating B1 into models for T1 estimation. The precision of ECG-gated IR schemes with spoiled GRE readout can be improved by utilizing an appropriate recovery period.Acknowledgements
This work was supported in part by the National Institutes of Health (P41EB022544, R01CA165221, R01HL137230, R01HL118261, T32EB013180, and K01EB030045).References
1. Messroghli DR et al. "Clinical recommendations for cardiovascular magnetic resonance mapping of T1, T2, T2* and extracellular volume: a consensus statement by the Society for Cardiovascular Magnetic Resonance (SCMR) endorsed by the European Association for Cardiovascular Imaging (EACVI)." Journal of Cardiovascular Magnetic Resonance. 2017; 19(1):1-24.
2. Kellman P and Hansen MS. "T1-mapping in the heart: accuracy and precision." Journal of Cardiovascular Magnetic Resonance 2014; 16(1):2.
3. Kellman P et al. “Extracellular volume fraction mapping in the myocardium, part 1: evaluation of an automated method”. Journal of Cardiovascular Magnetic Resonance 2012; 14(1):1-11.
4. Han, Paul K., et al. "Free-Breathing Three-Dimensional T 1 Mapping of the Heart Using Subspace-Based Data Acquisition and Image Reconstruction." 2019 41st Annual International Conference of the IEEE Engineering in Medicine and Biology Society (EMBC). IEEE, 2019.
Figures