3287
Accelerated 3-Tesla Cardiac T2-Mapping at End-Systole for Improved Transmural Map Consistency and Accuracy1MRI Research Center, Auburn University, Auburn University, AL, United States
Synopsis
CMR T2-mapping is needed to assess myocardial edema after such events as acute myocardial infarction, myocarditis and tako-tsubo cardiomyopathy. Many T2mapping sequences have been developed, but most suffer from design shortcuts that degrade their accuracy, consistency and prognostic value. T2maps from four-point T2 curve-fits at end-systole (ES) would have maximum wall thickness and fewest artifacts for better prognostic value. We present a new sequence that produces accurate four-point T2maps at ES within a 24-second breathhold at 3T. This sequence was tested on phantoms and healthy human volunteers to present superior results.
Introduction
Cardiac MRI (CMR) sequences must provide maximum diagnostic information with minimum operator effort, time and cost1. CMR T2-mapping is needed to assess myocardial edema after such events as myocardial infarction, myocarditis and tako-tsubo cardiomyopathy2. Many T2mapping sequences have been developed, but with error-inducing design shortcuts including: 1) Imaging immediately after R-wave trigger during end-diastole (ED) to produce left ventricle (LV) images of thinnest transmural wall thickness. 2) Included only three T2/TE imaging time-points that create poor T2 three-point curve fit. 3) Included poorly justified no-T2prep, time-zero image that further corrupts the three-point T2 curve-fit. While these designs primarily shorten the scan time, they also degrade the accuracy, consistency and prognostic value of T2map results. Improved CMR T2mapping is needed that corrects these shortcomings while keeping a fast scan. Ideally, T2maps generated at end-systole (ES) would have maximum wall thickness and minimum interventricular blood pool to reduce partial-volume and other artifacts at the LV epi and endocardial boundaries. True four-point T2maps would also promote higher accuracy T2 curve-fit results. Here we present a x4-accelerated sequence that produces accurate four-point T2maps at ES within a 24-second breathhold at 3T. T2 accuracy was verified in phantom tests and in vivo performance tested on three healthy volunteers.Methods
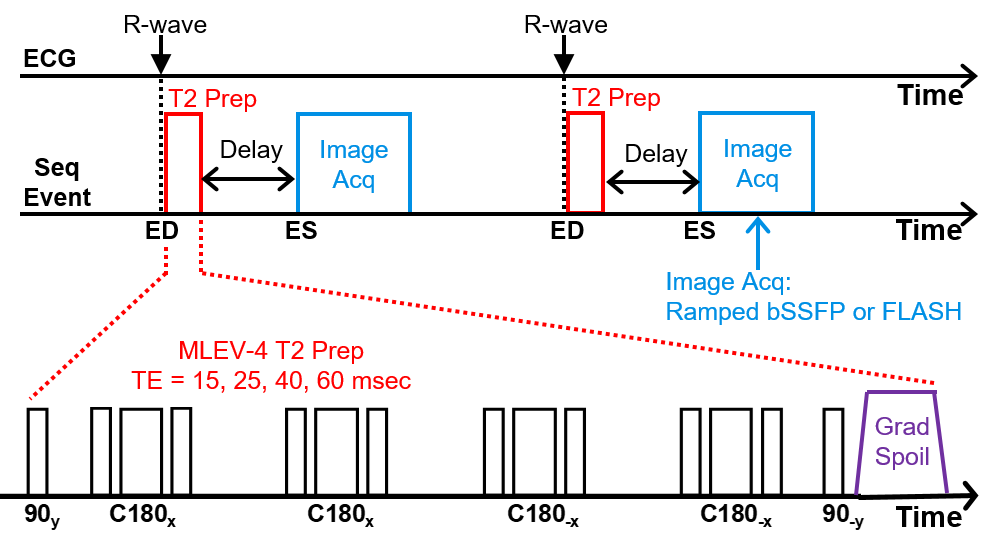
A prospectively ECG-triggered sequence with a T2prep module and ramped flip angle readout module with GRAPPA was developed for use at 3T (see Figure 1). The readout module acquires four successive images as a mini-cine and was selectable between balanced steady-state (bSSFP) or fast low-angle shot (FLASH) methods. The T2prep module employed hard composite RF pulses (four refocussing) with both Malcolm Levitt (MLEV-4) and CPMG phase-weighting3. The T2prep method was ideal as it stores the T2-prepared magnetization in the longitudinal axis until delayed readout. The T2prep ran immediately after ECG trigger and a selectable time-delay placed the readout to run at LV ES. Preliminary T2 accuracy tests were run on a agar phantom and compared to conventional T2 spin-echo (SE) on the same phantom. A second phantom test compared the T2 results between zero versus 300 ms delay between the T2prep and readout. In vivo test scans were run on three healthy volunteers with informed consent. All scans were run on a Siemens 3T Verio scanner with a 32-chan anterior/posterior RF coil array. T2 mapping and curve-fitting analysis was performed offline using custom Matlab programs. The T2Prep image from the shortest TE time (TEmin=15ms), with its good blood/tissue contrast, was used to manually segment the LV epi and endocardial boundaries, thus defining the total LV myocardial ROI within the resulting T2map. These ROI were analyzed by the Neider-Mead Simplex Method to per-pixel curve-fit the four T2prep time-points into T2 mean and standard deviation within the slice and across the three volunteers. Imaging parameters: T2prep TE times = 15, 25, 40, 60 ms; T2prep to Readout Delay = 0.325 x ECG RR (typically 276 ms); FOV = 264x246 mm; Pixel size = 2.75x2.75 mm; Matrix = 96x96 (interpolated to 128x128); Slice thickness = 8 mm; GRAPPA acceleration = x4; Flip angle = 30°/10° (bSSPF/FLASH); TE=1.62 ms, TR = ECG RR (typically 850 ms); Bandwidth = 1041 Hz/Pixel; Averages = 1. For in vivo, after preliminary scout scans, three mid-LV short-axis T2mapping slices, with 8 mm gap, were sequentially scanned in each volunteer.Results
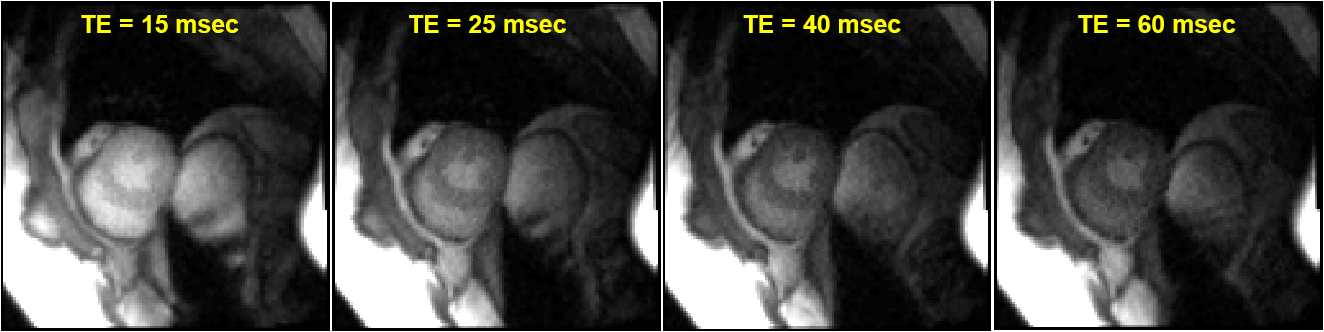
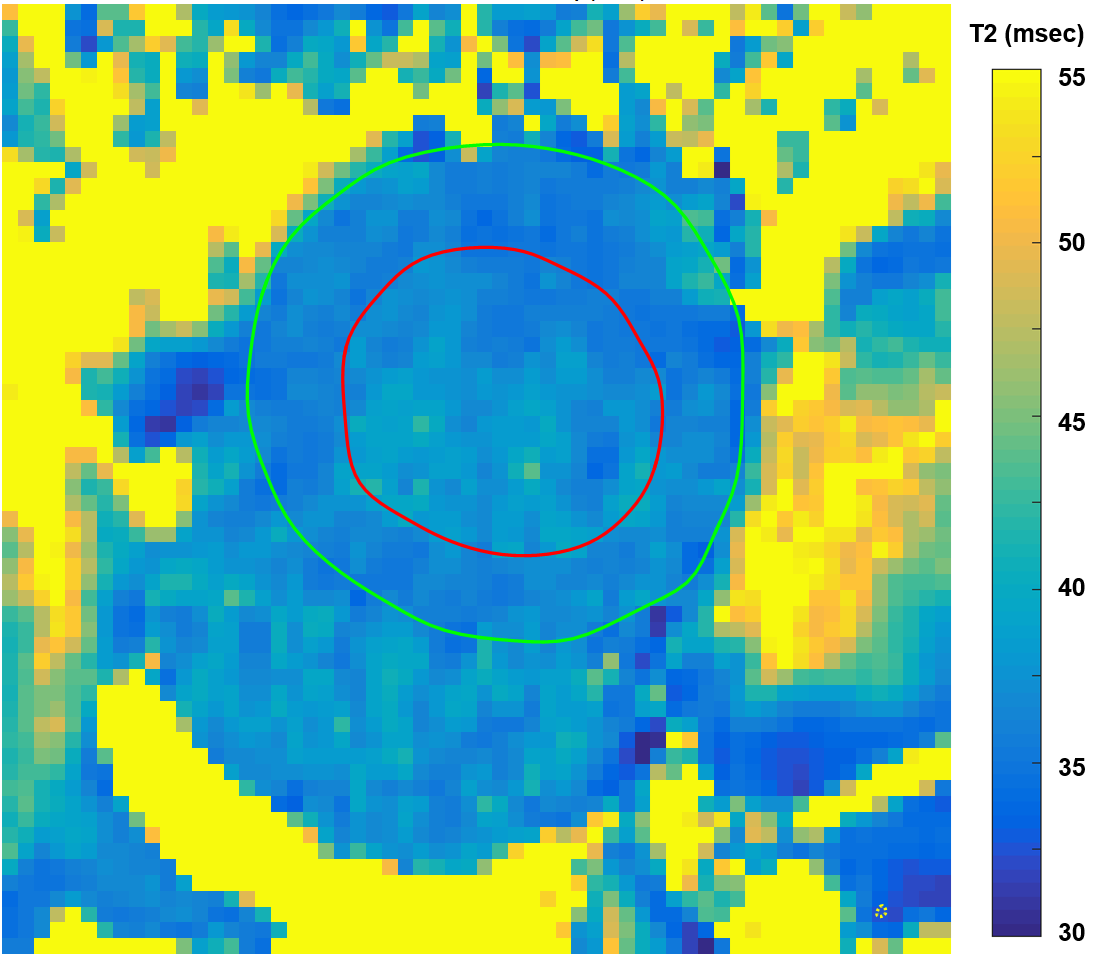
The preliminary T2 measurements on the agar phantom gave T2 = 40.9±1.5 ms and 43.2±3.9 ms (Mean±StdDev) respectively for the T2 SE versus T2prep. Assuming T2 SE as the accurate reference, this made the T2prep result a +5.6% error. The phantom test of T2 difference between zero delay versus 300 ms delay showed a T2 increase of 1.13 ms at 300 ms delay. All three volunteers completed successful T2prep mapping scans as three slices per subject for a total of nine slices. Each T2map was acquired within a 24 second breathhold. Figure 2 presents representative result T2prep images at the four TE times where the image magnitudes shows obvious decline as the TE time increased. Figure 3 presents a representative result mid-LV T2map image with LV segmentation lines (green and red) transferred after being drawn on a T2Prep TEmin=15 ms image. The maps showed good consistency and minimal “bad” mapping pixels. The three-slice mean T2 results for the three volunteers were 42.8±6.8, 38.5±11.1 and 39.8±7.9 ms and the total for all nine slices of all three volunteers as 40.4±8.8 ms.Discussion
The T2prep phantom test results as +5.6% higher than T2 SE are acceptable to validate the T2prep sequence T2 accuracy. The T2 increase of only 1.13 ms from a 300 ms delay to readout was also acceptable. The result T2maps with thickened walls at ES were easier to interpret compared to thin-walled ED maps. Interestingly, the T2prep in vivo T2 results of 40.4±8.8 ms are noticeably lower than the 50-55 ms range reported in previous literature. Many of the design shortfalls discussed in this abstract would/could (arguably) increase cause those higher T2 results.Conclusion
This new T2prep CMR T2mapping sequence creates sufficiently accurate and consistent T2maps at end-systole that may have improved prognostic value. Further work is needed to further verify its T2 accuracy under varying conditions.Acknowledgements
Special thank you for programmatic and volunteer support goes to Julie Rodiek, Adam Davila and Julio Yanes.References
1. Edelstein WA, et al “MRI: Time Is Dose—and Money and Versatility”, J Am Coll Radiol 2010;7(8): 650–2.
2. Giri S, et al "T2 quantification for improved detection of myocardial edema", JCMR 2009; 11(56).
3. Beyers RJ, et al "T2-weighted MRI of post-infarct myocardial edema in mice", MRM 2012; 67(1)
Figures