3286
Simultaneous arterial and venous imaging and 3D quantitative parameter mapping with RF-spoiled gradient echo1Healthcare Business Unit, Hitachi, Ltd., Tokyo, Japan
Synopsis
We proposed a method to acquire venous and arterial image in addition to maps of multiple MR parameters (T1, T2*, proton density, and susceptibility) at the same time. The method applies venous extraction to susceptibility map obtained in previously developed multiple parameter mapping method using RF-spoiled gradient echo. The venous image of the proposed method were similar to those of conventional method. The result suggests that the proposed method enables simultaneous acquisition of arterial and venous images with quantitative MR parameter maps, and it may contribute to more efficient MR examination.
Introduction
A number of methods have been proposed for acquiring multiple magnetic resonance (MR) parameters such as T1 and T2 simultaneously1. Such MR parameter mapping methods should enable fast and quantitative MR examination. Previously, we developed a method of obtaining T1, T2*, proton density (PD), and susceptibility maps simultaneously by fitting a signal equation to RF-spoiled gradient echo images2. The method can also obtain an image of arteries by postprocessing3. However, venous images were not obtained using the method. A venous image can be obtained from a susceptibility map and provide important information for diagnosis, such as oxygen extraction fraction in a brain4. Therefore, in this study, we evaluate the venous images obtained from our multiple parameter mapping methods to show that arterial and venous images can be obtained in addition to T1, T2*, PD, and susceptibility maps.Method
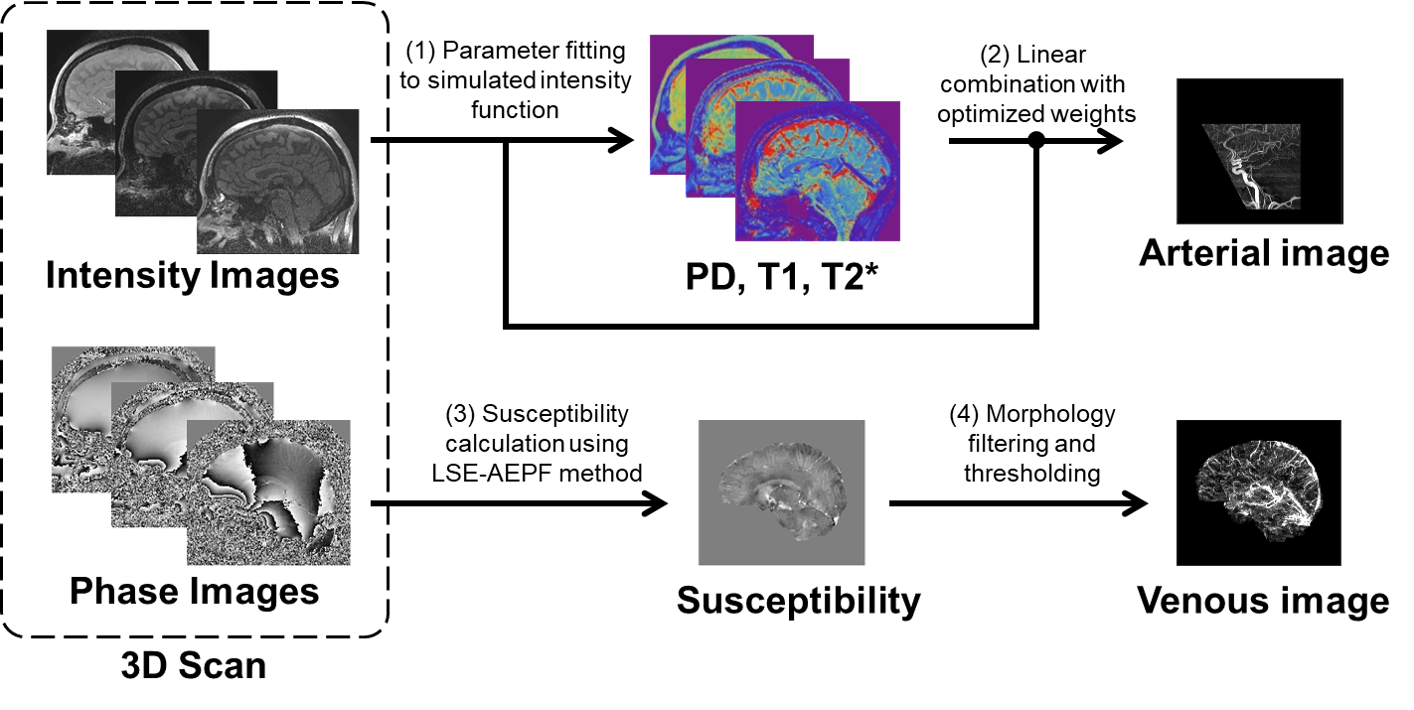
A three-dimensional RF-spoiled gradient echo sequence was performed on five healthy volunteers using a 3T MRI system (Hitachi, Ltd., Japan) and a 32-channel head coil. Seventeen images were obtained with different scan parameters (FA, TR, TE, and phase increment of RF (θ) ), as shown in Table 1. The other parameters were matrix: 256×256×160, resolution: 0.84×0.84×1.2 mm3, and total acquisition time: 15 min 56 s. The data obtained from the volunteers adhered to the standards of the internal review board of the Healthcare Business Unit, Hitachi, Ltd. following receipt of written informed consent.Quantitative parameter maps, arterial images, and venous images were calculated from the scanned images by following the steps shown in Figure 1. (1) PD, B1, T1, and T2* maps were obtained from the scanned images using the method of least squares to fit a signal equation based on a Bloch simulation2. (2) An arterial image of one subject were obtained by calculating the linear combination of the scanned images and the quantitative maps3. The weight of the linear combination was optimized using the data of the four other subjects to make the arterial blood vessels high-intensity. (3) Susceptibility maps were calculated form the phase images of scan No. 1 in Table 1 using a least-squares estimation with an adaptive edge preserving filtering (LSE-AEPF) method5. (4) Venous images were obtained by applying a morphological edge-enhancing filter to the susceptibility map.
For evaluation, we compared the proposed method with conventional high-resolution quantitative susceptibility mapping that used another RF-spoiled gradient echo sequence with a phase increment of 117 degrees. Reference venous images were calculated from the conventional susceptibility map with the same morphological filter used in the proposed method. The correlation coefficient of susceptibility in a slice and the maximum intensity projection (MIP) image of venography were calculated.
Results
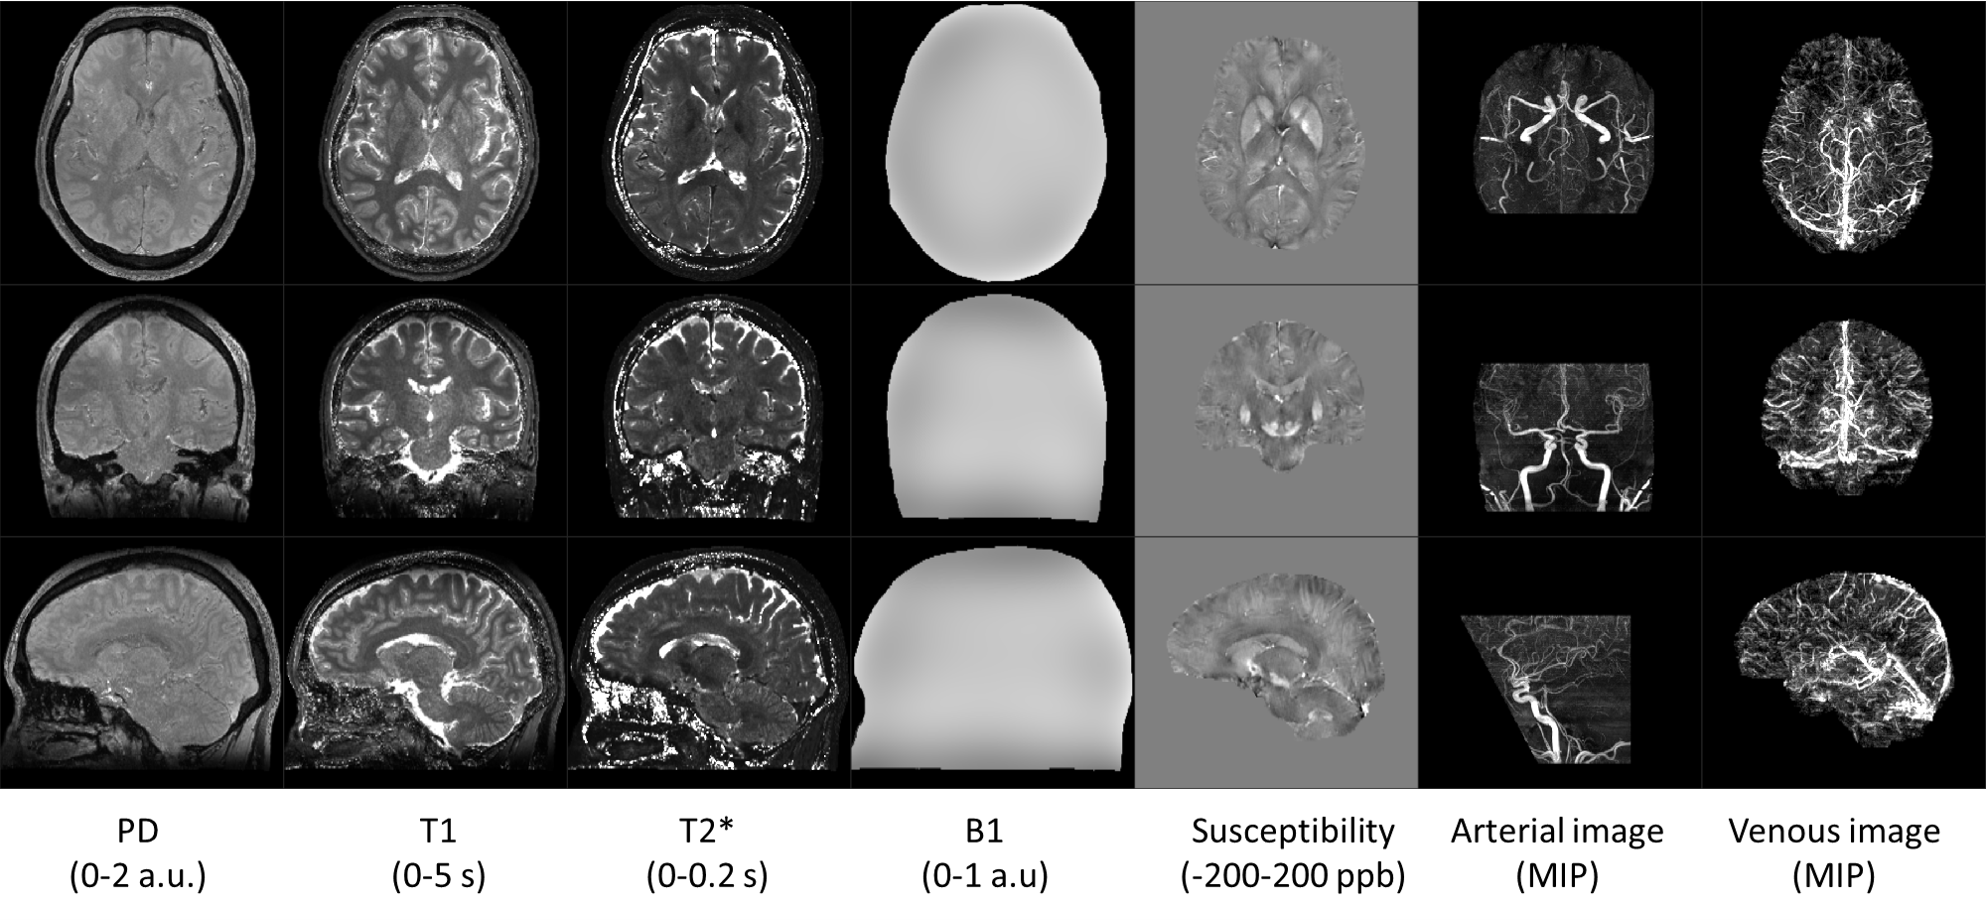
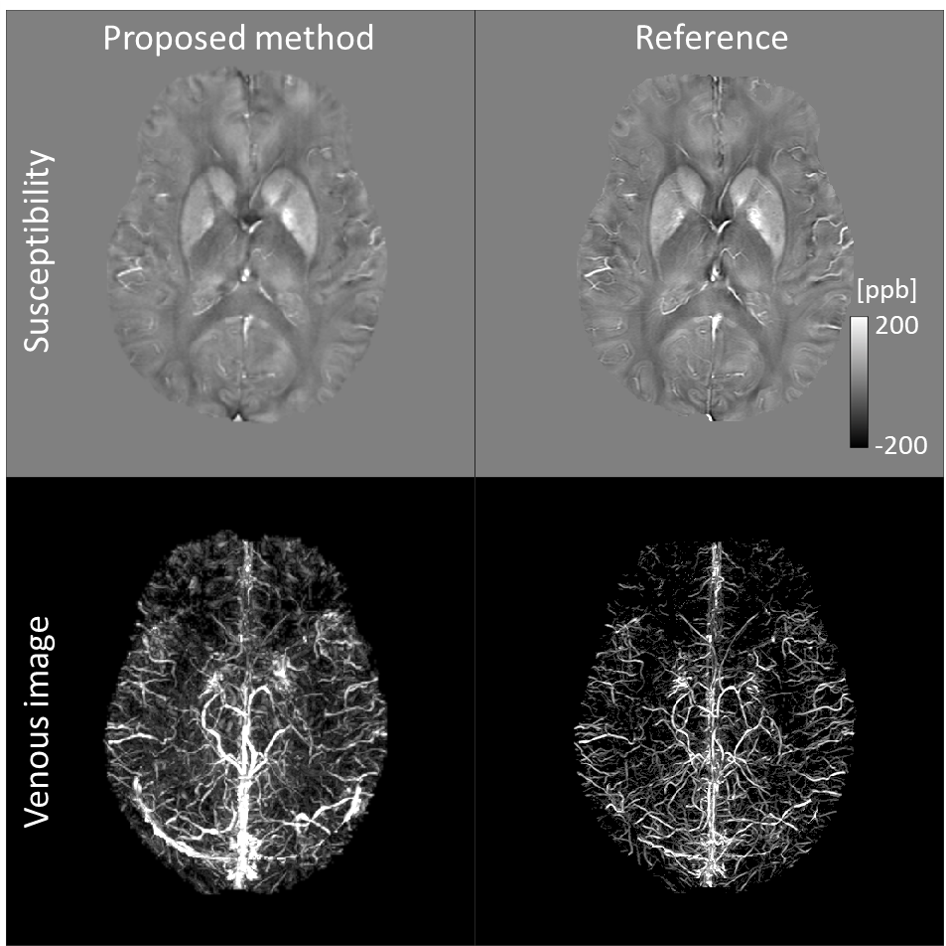
Figure 2 shows the obtained quantitative parameter maps (PD, T1, T2*, B1, and susceptibility) and the calculated arterial and venous images. The maps and images were obtained without large artifacts. Figure 3 shows the susceptibility map and venous image of the proposed method and the conventional high-resolution sequence. They were visually similar, and the correlation coefficients were 0.82 for susceptibility and 0.65 for the venous image.Discussions
Venous images were successfully acquired using the proposed method as shown in Figure. 3, suggesting that our proposed quantitative parameter mapping method can provide arterial and venous images in addition to parameter maps. It could be useful for diagnosis of diseases of brain vessels or evaluation of brain functions such as oxygen extraction fraction. A lower signal-to-noise ratio may have caused the background noise, and the lower resolution may have caused the blurring in the venous images of the proposed method. Further study is required to optimize the morphological filter to extract the veins more accurately.Conclusions
To acquire venous and arterial images and multiple MR parameter maps simultaneously, we proposed a method of applying venous extraction to susceptibility maps obtained by a previously developed multiple parameter mapping method that uses an RF-spoiled gradient echo. The venous images of the proposed method were similar to those of the conventional method, suggesting that the proposed method enables simultaneous acquisition of arterial and venous images with quantitative MR parameter maps and may help make MR examinations more efficient.Acknowledgements
No acknowledgement found.References
1. Warntjes JBM, Leinhard OD, West J, Lundberg P. Rapid magnetic resonance quantification on the brain: optimization for clinical usage. Magn Reson Med. 2008;60(2):320-329.
2. Taniguchi Y, Yokosawa S, Shirai T, et al., Fast 3D Multi-Parameter Mapping of Relaxation Times and Susceptibility Using Partially RF-Spoiled Gradient Echo at 3T, Proc. ISMRM. 2018; 5630.
3. Amemiya T, Yokosawa S, Taniguchi Y, et al., Simultaneous acquisition of MR angiography and 3D quantitative MR parameter maps, Proc. ISMRM. 2018; 2776.
4. Kudo K, Liu T, Murakami T, et al., Oxygen extraction fraction measurement using quantitative susceptibility mapping: comparison with positron emission tomography, J. Cereb. Blood Flow Metab. 2016;36(8):1424-1433.
5. Shirai T, Sato R, Taniguchi Y, et al., Quantitative Susceptibility Mapping Using Adaptive Edge-Preserving Filtering. Proc. ISMRM. 2015; 3319.
Figures
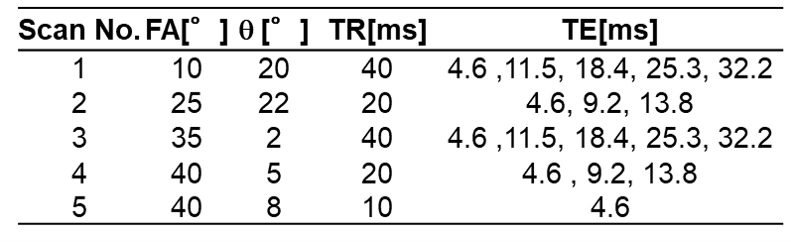
Table 1. Scan parameters