3285
A method to rapidly quantify whole-organ metabolic rate of O2 with interleaved background-suppressed T2-oximetry and blood flow measurement1Dept. of Bioengineering, University of Pennsylvania, Philadelphia, PA, United States, 2Dept. of Radiology, University of Pennsylvania, Philadelphia, PA, United States
Synopsis
A T2-based oximetry pulse sequence has been developed by interleaving a phase-contrast module preceding a background-suppressed T2-prepared echoplanar imaging readout. The method enables rapid simultaneous measurement of blood flow velocity and T2 of blood water protons from a single anatomic location in 18 seconds scan time. The pulse sequence improves on T2-based oximetry methods, including T2-relaxation-under-spin-tagging (TRUST), by incorporating background-suppression to eliminate the need for “control” and “label” images. The pulse sequence also interleaves phase-contrast MRI so that a separate measurement of blood flow velocity is not required to quantify whole-organ metabolic rate of oxygen.
INTRODUCTION
T2-based MRI oximetry (T2O) measures T2 of venous blood water protons, followed by a conversion to SvO2 via a calibration curve [1, 2]. To quantify metabolic rate of O2 (MRO2), an additional measurement of blood flow velocity is required. T2-relaxation-under-spin-taggging (TRUST) is a well-established T2O method for quantifying whole-brain SvO2 by measuring T2 in the superior sagittal sinus of the brain [2]. However, TRUST is sensitive to physiologic motion because two scans, a “control” and a “label,” are required to remove stationary background tissue and isolate intravascular blood signal. Moreover, it is important to minimize the TE in TRUST because venous blood and tissue accrue phase at different rates. This can contribute to the persistence of background tissue despite subtraction between “control” and “label” images. TRUST also requires a separate measurement of blood flow velocity to quantify MRO2 [3]. Here, a T2O method is reported that interleaves phase-contrast before background-suppressed T2-prepared echoplanar imaging (EPI). Background-suppression reduces signal from stationary tissue while inflowing venous blood will provide signal from which T2 (and SvO2) can be determined. Importantly, the proposed method interleaves phase-contrast MRI to simultaneously estimate SvO2 and blood flow velocity, which are both required to quantify MRO2.METHODS
The pulse sequence begins by resetting the magnetization with a global saturation, followed by radial phase-contrast MRI and background-suppressed T2-prepared EPI modules. Background-suppression significantly reduces the partial volume effect by suppressing static tissue signal and takes advantage of signal enhancement from inflowing blood with a combination of slice-selective and non-selective adiabatic inversion pulses [4, 5]. T2-preparation consists of an MLEV-4 scheme to provide T2-weighting with five TE's (0/48/96/144/192ms) [6]. In each of the five TE's, 55 interleaved velocity-encoded radial views are acquired. A golden-angle radial acquisition was used because each view passes through the center of k-space, which increases robustness to motion. The total acquisition time is approximately 18 seconds. The pulse sequence timeline is shown in Figure 1.The velocity-encoding module comprises the following parameters: VENC=60cm/s, golden-angle increment=111.3°, TR/TE=9/5.8ms, 55 views per interleave, and voxel size=0.67x0.67x5 mm3. Background-suppression is achieved with the following RF pulses: a slice-selective 90° saturation pulse, two slice-selective adiabatic inversion pulses, and two non-selective adiabatic inversion pulses. The EPI module comprises the following parameters: 5/8th partial Fourier, flip angle of 90°, voxel size=3.2x3.2x5 mm3, and includes a calibration scan for phase correction. Radial reconstruction is performed by combining the sets of 55 radial views from the five interleaves, for a total of 275 radial views. The pulse sequence results in five images of varying T2-weighting and one velocity map. Pulse sequence parameters are summarized in Table 1.
The pulse sequence was tested in two healthy subjects, ages 24.7 and 23.9 years. After informed consent was obtained, the subjects were imaged at 3 T (Siemens Prisma) using a 20-channel head and neck coil, at a slice in the neck transecting the internal carotid and vertebral arteries and internal jugular vein. The pulse sequence was repeated six times. Data are reported as an average of the six repetitions.
Cerebral MRO2 (CMRO2) was quantified on the basis of the conservation of mass equation (Fick’s Principle): $$$CMRO_2=C_{RBC}\cdot Hct\cdot tCBF\cdot (SaO_2-SvO_2)$$$ [7]. CRBC is 22.02 μmol O2/mL RBC [8], the O2 carrying capacity of a red blood cell (RBC). Hct represents hematocrit and is determined by finger prick (Hb 201+, Hemocue, Sweden). tCBF is total blood flow rate normalized by brain mass. Velocity-encoded images were generated by phase difference, from which tCBF was determined by integrating blood flow velocity over vessel area (internal carotid and vertebral arteries). Brain mass was computed by estimating brain volume with a T1-weighted MPRAGE sequence [9] and applying a density of 1.05g/mL. SaO2 and SvO2 are arterial and venous oxygen saturation, respectively. SaO2 was assumed to be 98%. T2 of the blood water protons in the internal jugular vein was estimated and converted to SvO2 via a calibration curve [10]. Figure 2 illustrates the workflow.
RESULTS
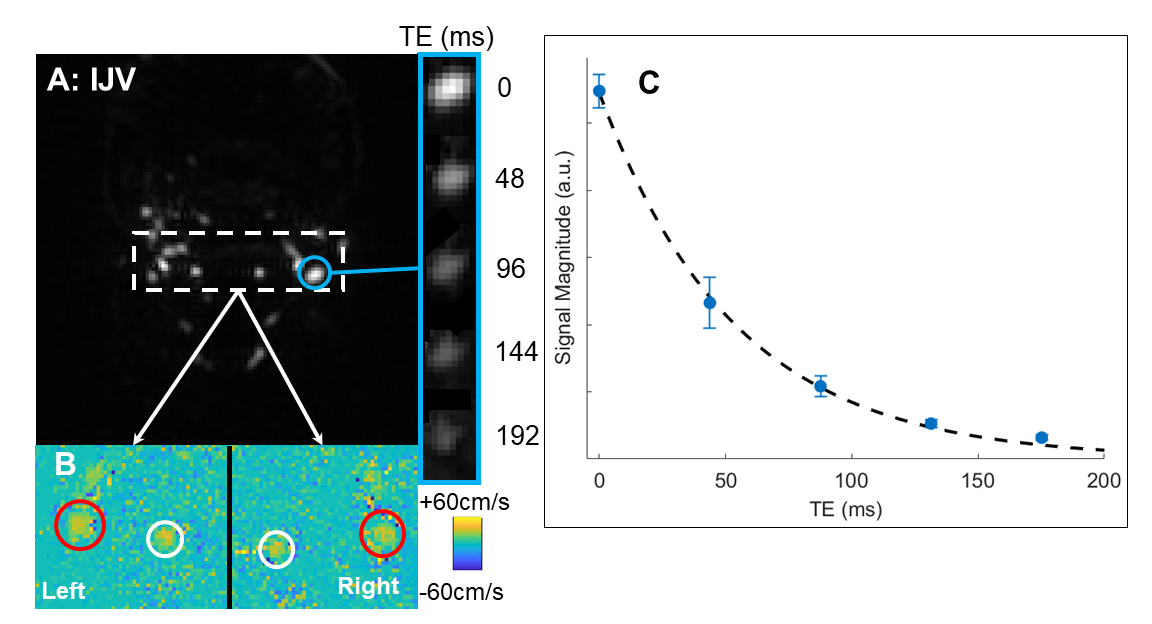
Table 2 lists the physiologic parameters obtained in the two test subjects, yielding CMRO2 of 127±14 and 132±12 μmol/min/100g obtained via Fick’s Principle. Figure 3 shows a representative background-suppressed magnitude image of the internal jugular vein at TE=0ms, a panel of the internal jugular vein at increasing T2-weighting, and an inset of a phase-contrast velocity image of the feeding arteries, and a graph of the T2-relaxation curve.DISCUSSION & CONCLUSION
The pulse sequence quantified CMRO2 values that are comparable to those reported in literature (132±20[3], 127±7[11] μmol/min/100g). T2-based oximetry at the neck allows for measuring total blood flow velocity from the internal carotid and vertebral arteries and SvO2 from the internal jugular vein at a single location. Acquisition at the neck also enables direct measurement of total cerebral blood flow, whereas methods at the superior sagittal sinus often use flow-upscaling to estimate total cerebral blood flow [12]. In conclusion, this rapid pulse sequence simultaneously acquires the key physiological parameters (SvO2 and blood flow velocity) to quantify whole-organ MRO2 in 18 seconds scan time. Further work will systematically validate and compare this pulse sequence to other oximetry methods, including TRUST and susceptometry-based oximetry. This method should lend itself for deriving MRO2 in abdominal organs, including liver and kidney.Acknowledgements
This work was supported by NIH Grant T32 EB020087.References
1. Wright, G.A., B.S. Hu, and A. Macovski, 1991 I.I. Rabi Award. Estimating oxygen saturation of blood in vivo with MR imaging at 1.5 T. J Magn Reson Imaging, 1991. 1(3): p. 275-83.
2. Lu, H. and Y. Ge, Quantitative evaluation of oxygenation in venous vessels using T2-Relaxation-Under-Spin-Tagging MRI. Magn Reson Med, 2008. 60(2): p. 357-63.
3. Xu, F., Y. Ge, and H. Lu, Noninvasive quantification of whole-brain cerebral metabolic rate of oxygen (CMRO2) by MRI. Magn Reson Med, 2009. 62(1): p. 141-8.
4. Maleki, N., W. Dai, and D.C. Alsop, Optimization of background suppression for arterial spin labeling perfusion imaging. MAGMA, 2012. 25(2): p. 127-33.
5. Cheng, C., et al. Simultaneous measurements of blood flow and blood water T2: a general-purpose sequence for T2-based measurement of whole-organ O2 consumption. in ISMRM. 2020. Virtual.
6. Levitt, M.H. and R. Freeman, Compensation for pulse imperfections in NMR spin-echo experiments. Journal of Magnetic Resonance (1969), 1981. 43(1): p. 65-80.
7. Kety, S.S. and C.F. Schmidt, The Effects of Altered Arterial Tensions of Carbon Dioxide and Oxygen on Cerebral Blood Flow and Cerebral Oxygen Consumption of Normal Young Men. J Clin Invest, 1948. 27(4): p. 484-92.
8. Yablonskiy, D.A., A.L. Sukstanskii, and X. He, Blood oxygenation level-dependent (BOLD)-based techniques for the quantification of brain hemodynamic and metabolic properties - theoretical models and experimental approaches. NMR Biomed, 2013. 26(8): p. 963-86.
9. Mugler, J.P., 3rd and J.R. Brookeman, Three-dimensional magnetization-prepared rapid gradient-echo imaging (3D MP RAGE). Magn Reson Med, 1990. 15(1): p. 152-7.
10. Lu, H., et al., Calibration and validation of TRUST MRI for the estimation of cerebral blood oxygenation. Magn Reson Med, 2012. 67(1): p. 42-9.
11. Jain, V., M.C. Langham, and F.W. Wehrli, MRI estimation of global brain oxygen consumption rate. J Cereb Blood Flow Metab, 2010. 30(9): p. 1598-607.
12. Rodgers, Z.B., et al., High temporal resolution MRI quantification of global cerebral metabolic rate of oxygen consumption in response to apneic challenge. J Cereb Blood Flow Metab, 2013. 33(10): p. 1514-22.
Figures
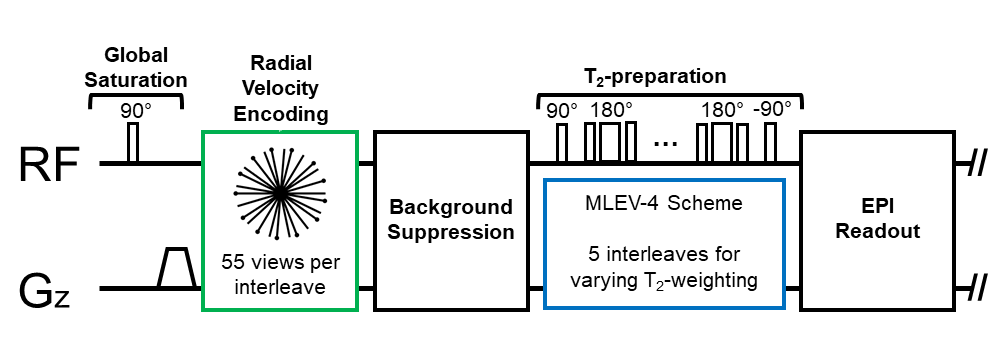
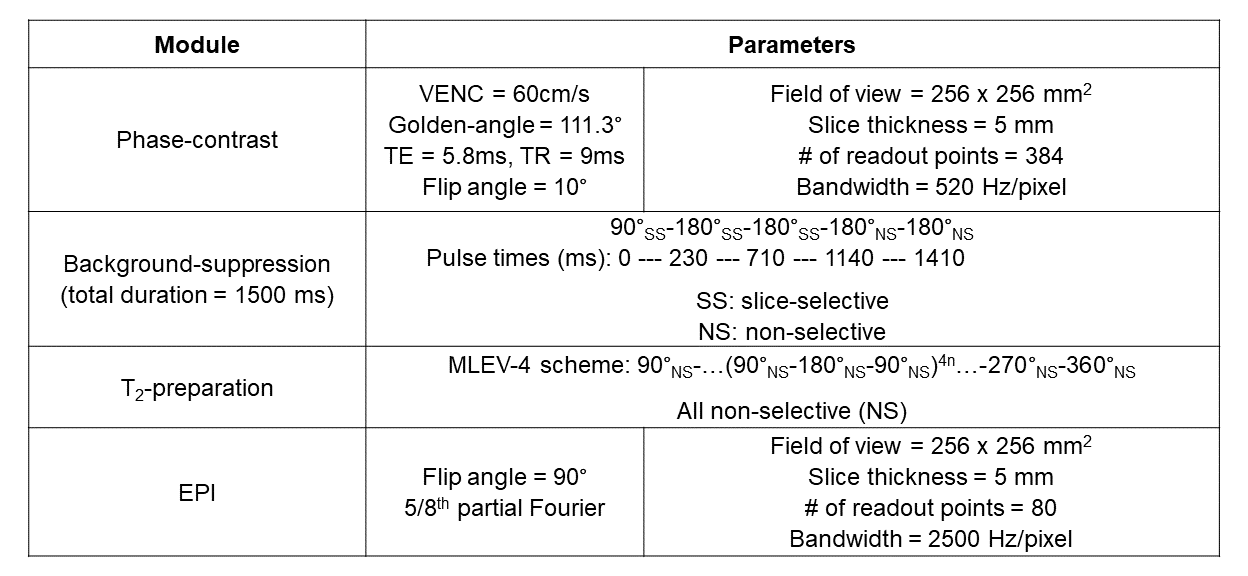
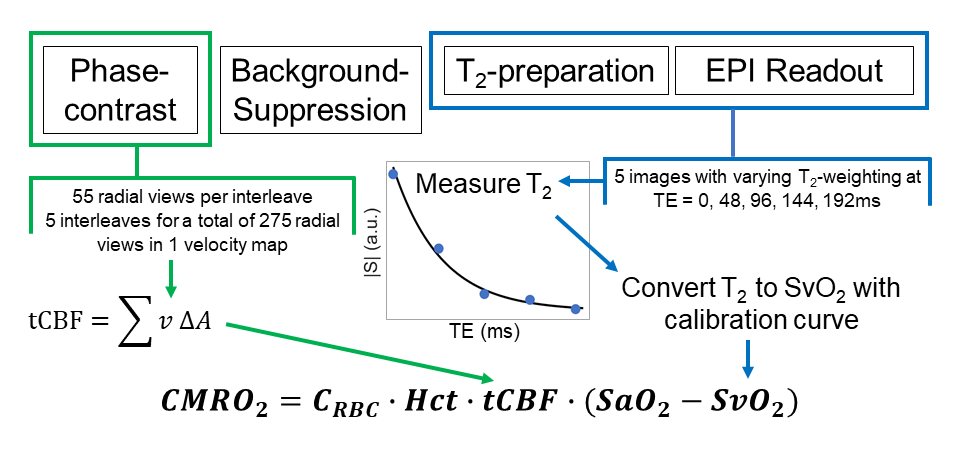
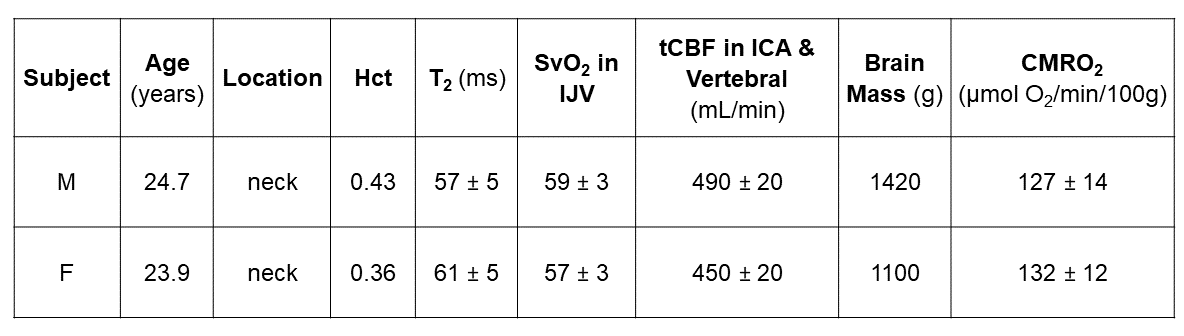
Table 2: Results of the T2-based oximetry pulse sequence at the neck level and quantification of cerebral metabolic rate of O2 (CMRO2) in two healthy subjects. Data are reported as an average of the six repetitions (mean ± S.D.).
Hct: hematocrit, SvO2: venous blood oxygen saturation, IJV: internal jugular vein, tCBF: total cerebral blood flow, ICA: internal carotid artery,