3282
EVALUATION OF A CONVOLUTIONAL NEURAL NETWORK FOR AUTOMATED SEGMENTATION OF LOW-GRADE GLIOMAS1I2FH , Neuroradiology, CHU Montpellier, Montpellier University, France, Montpellier, France, 2Siemens Healthcare, Saint Denis, France, 3Laboratoire Charles Coulomb, University of Montpellier, France, Montpellier, France, 4Advanced Clinical Imaging Technology, Siemens Healthcare AG, Lausanne, Switzerland, 5LTS5, Ecole Polytechnique Fédérale de Lausanne, Lausanne, Switzerland, 6Radiology Department, Lausanne University Hospital and University of Lausanne, Switzerland, Lausanne, Switzerland
Synopsis
Tumor growth exceeding 8mm/year is the main indication for surgical intervention in low-grade gliomas (LGG). As manual growth assessment is very time-consuming, automated segmentation is desirable. We trained a Convolutional Neural Network (CNN) to segment LGG on 277 MRI-exams (T1+T2-FLAIR) and tested its performance on 9 unknown exams. The mean Dice Similarity Coefficient for automated segmentation was 0.72. The algorithm correctly segmented low T1 and high FLAIR values but tended to underestimate heterogeneous gliomas. Results were independent of cavity or tumor volume. Automated segmentation using CNNs seems promising for clinical practice. Performance might be improved using 3D FLAIR sequences.
Introduction
Gliomas account for up to 80% of all brain tumors and always evolve to an aggressive form [1]. The cut-off for malignant transformation is a diameter increase of more than 8mm/year [2]. Manual tumoral volume assessment as a mean to estimate tumoral diameter remains the gold standard to quantify tumoral growth [3], but is very time-consuming in clinical practice. Multiple automated segmentation techniques were developed using convolutional neural network (CNN) on high-grade gliomas. However, low-grade gliomas (LGG) segmentation can be challenging due to diffuse and less clearly delineated tumor boundaries. This study investigated the feasibility of automated LGG segmentation.Methods
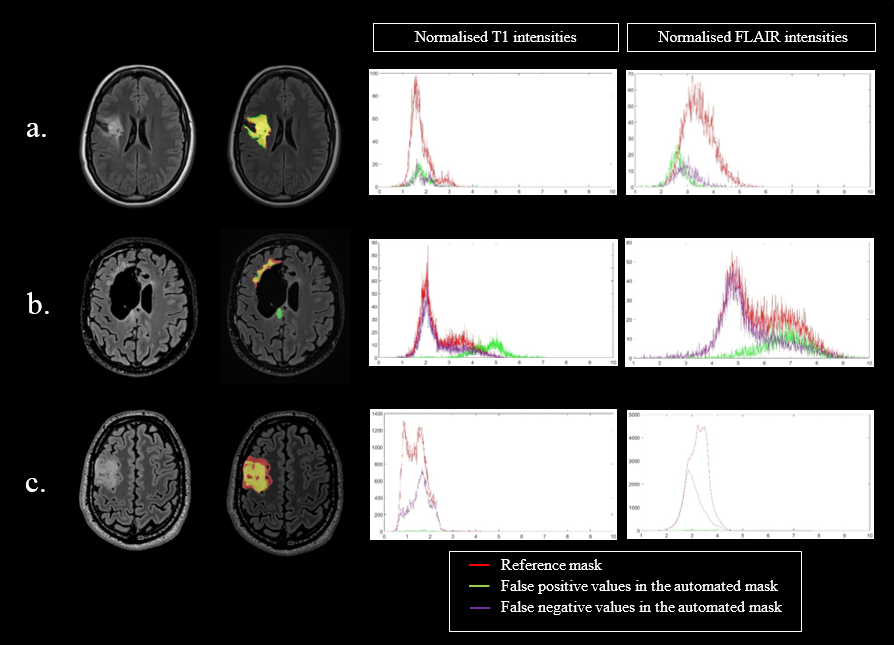
A 3D CNN [4] was trained for fully automated tumor segmentation. For training, 3D T1-weighted and T2FLAIR 2D (88%) or 3D (12%) series from 277 MRI exams of 30 LGG patients were used with manually delineated tumor masks in the FLAIR space. Data were acquired at 1.5T (MAGNETOM Avanto and Aera, Siemens Healthcare; Optima MR450w, GE healthcare; Intera, Philips healthcare) and 3T (MAGNETOM Skyra, Siemens healthcare) scanners. 242 T1/FLAIR image pairs were used for training and 35 for validation of the CNN. Prior to CNN processing, T1 volumes were resampled and zero-padded to a uniform matrix size of 256x256x88 with a voxel size of 1x1x2mm3. FLAIR volumes and corresponding manual ground truth segmentation masks were then affinely registered to the resampled T1 volumes using Elastix [5,6]. Subsequently, T1 and FLAIR intensities were normalized using z-score normalization. For testing, nine 3D T1 and 2D/3D FLAIR datasets of four independent patients were used. In a post-processing step, the automatically generated segmentation masks (AM) and all MRI images were transformed into FLAIR space. Referential tumor (RM) and resection cavity masks were manually extracted from FLAIR images. Sensitivity, specificity, and Dice similarity coefficient (DSC) of the segmentation results were calculated with regard to the RM. Correlation between DSC results and tumoral as well as cavity volume were calculated with a Kendall test. Histograms of T1 and FLAIR image intensities were plotted for RM and AM. The intensity values in true positives, false negatives and the false positives were plotted to illustrate various segmentations results.Results
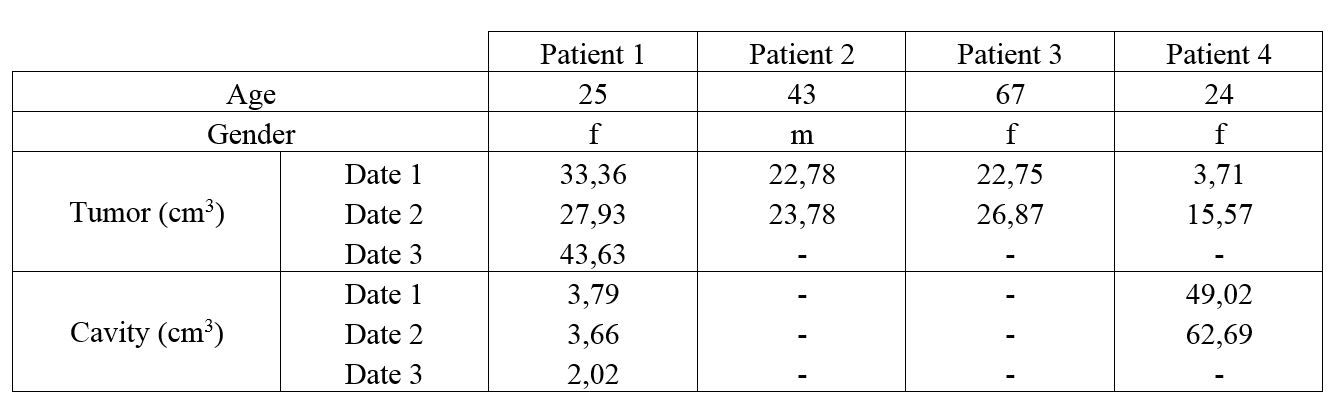
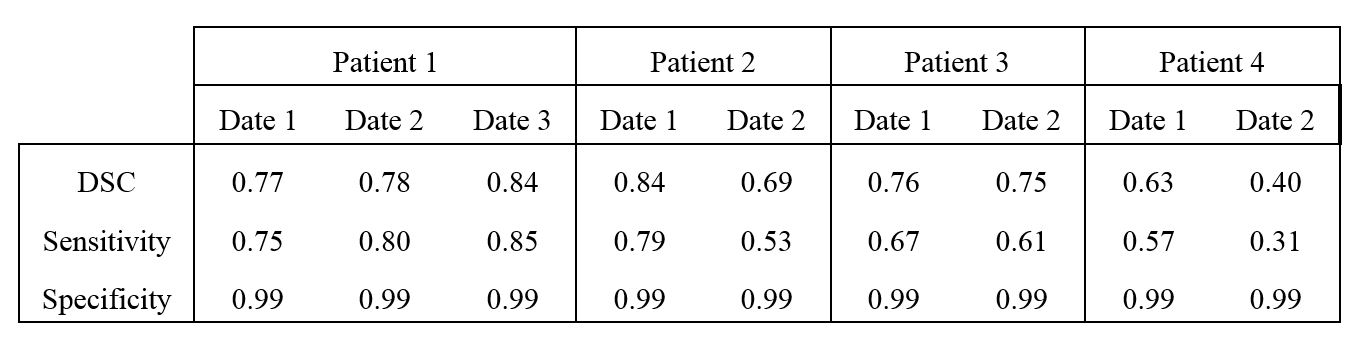
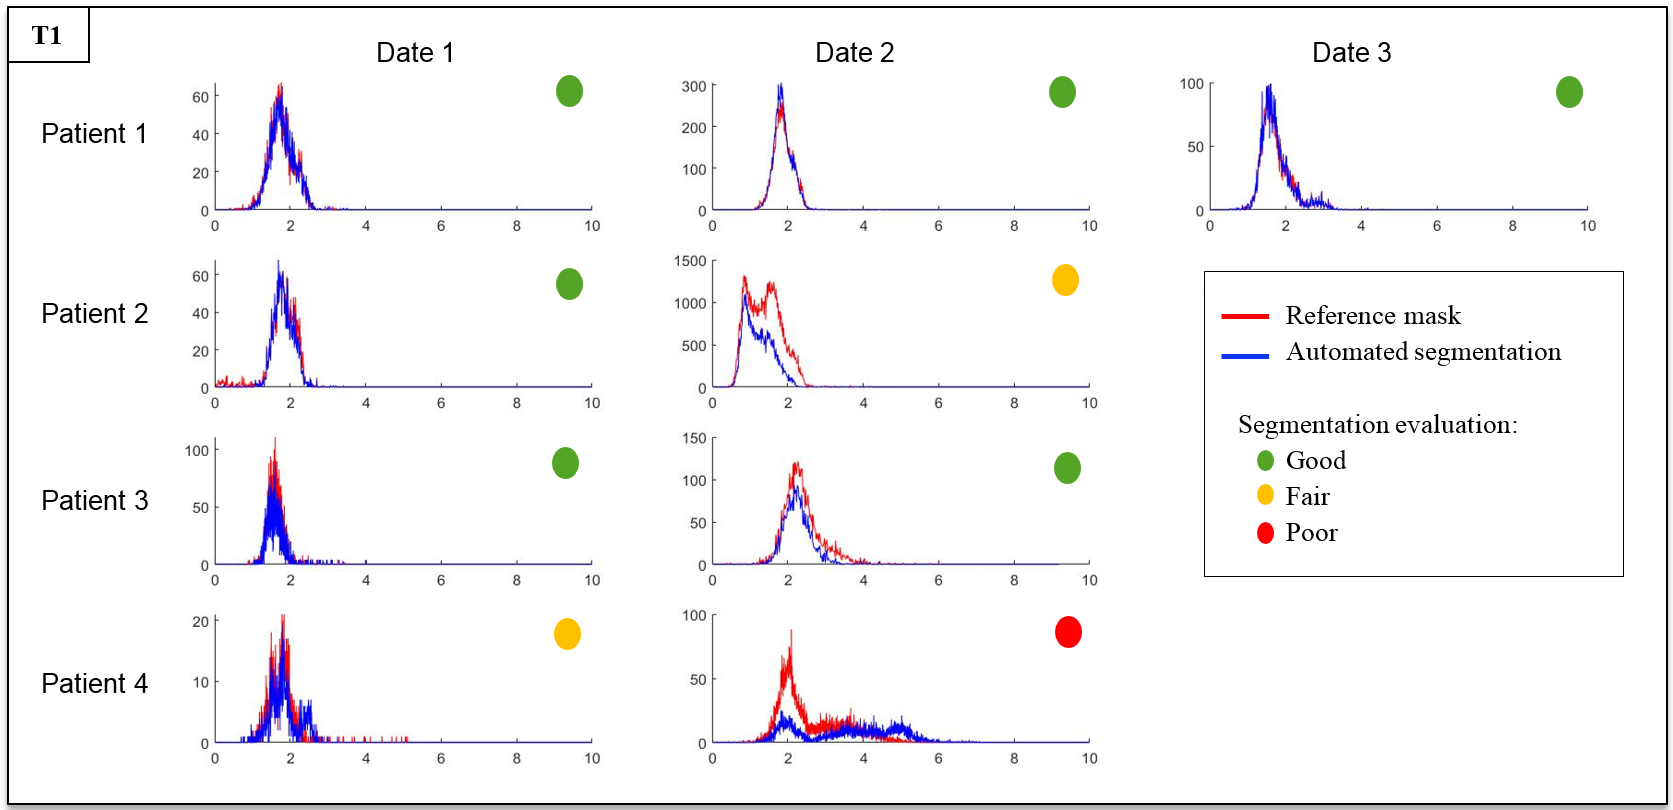
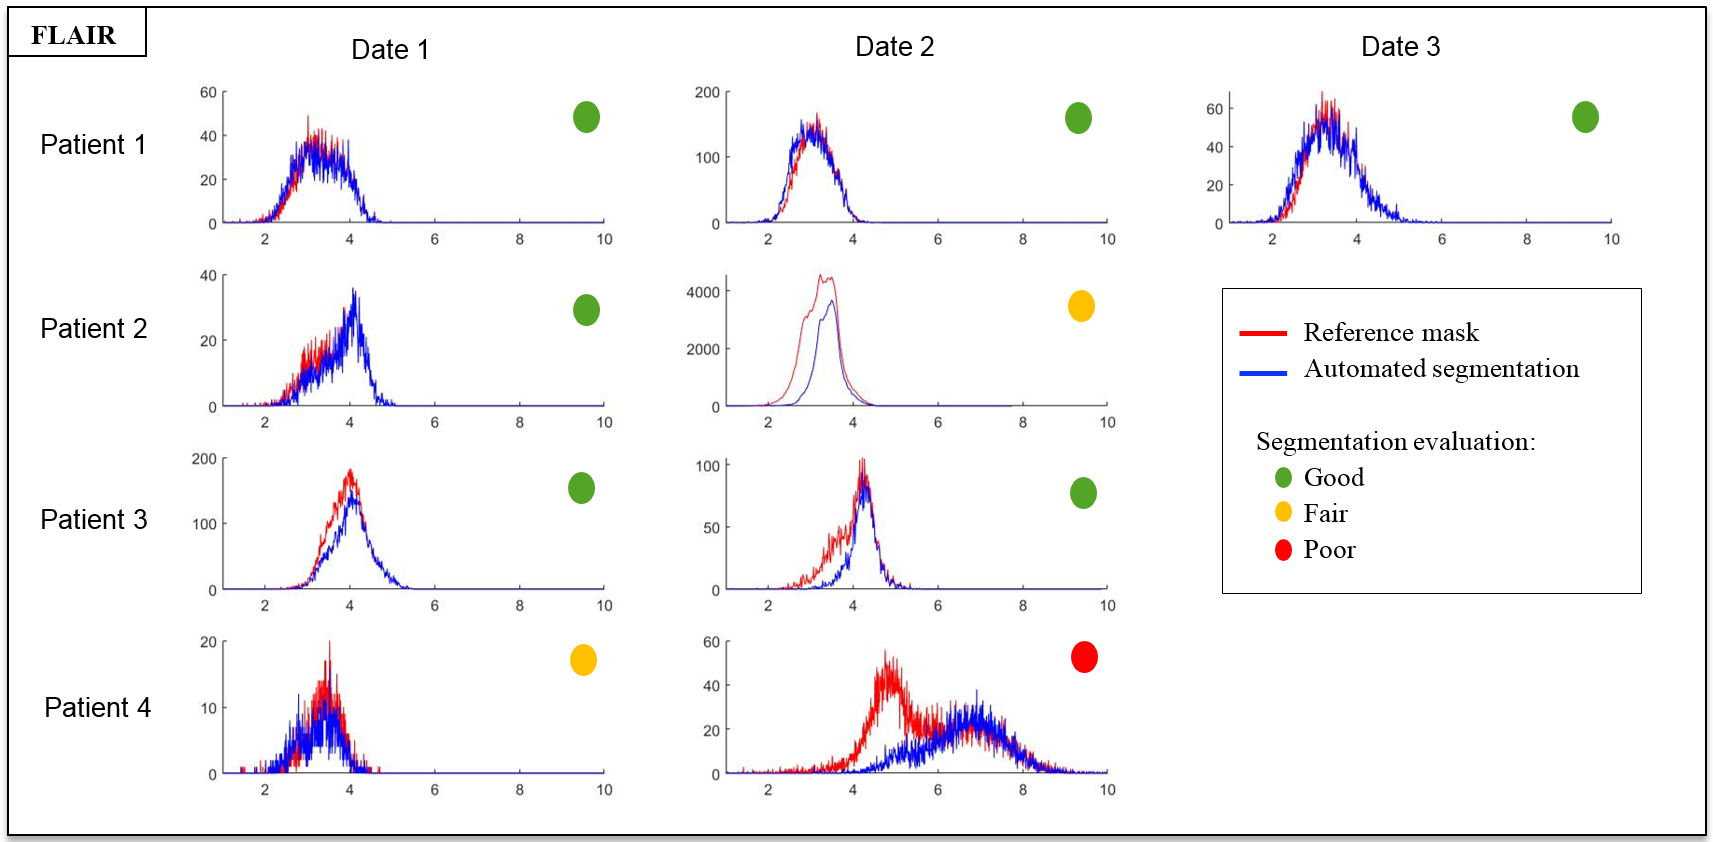
In the testing set (table 1), mean tumor and cavity volumes were respectively 24.49cm3 (3.72-43.64cm3) and 13.47cm3 (0-62.69cm3). The CNN had a sensitivity of 0.65 +/- 0.17 and a specificity of 0.99 +/- 0.0004. The mean DSC was 0.72+/-0.14 (table 2). The DSC was not significally correlated with both tumor volume (p=0.07, t=0.50) and cavity volume (p=0.24 t=-0.36). AM results were visually evaluated by an experienced neuroradiologist, identifying good, fair and poor results. Patient 1, patient 2 date 1 and patient 3, were rated as good segmentations (average DSC 0.79 (0.75-0.84), average sensitivity 0.74 (0.61-0.85)). Segmentation performance was fair for patient 2 date 2 and patient 4 date 1 (average DSC 0.66 (0.63-0.69), average sensitivity 0.55 (0.53-0.57)). Patient 4 date 2 showed poor segmentation result (DSC 0.40, sensitivity 0.31). All AM segmentations rated as good were similar to RM regarding their T1 intensity histograms (fig.1). In contrast, AM segmentation rated fair had either a lower T1 intensity range compared to RM (patient 2 date 2) or a supplementary peak at higher intensity values that was not identified on RM (Patient 4 date 1). Poor AM segmentation showed a wide intensity range, with values higher than RM. FLAIR intensity plots (fig.2) confirmed a good match between AM and RM histograms for patient 1, patient 2 date 1, patient 3 date 1 and patient 4 date 1. For patients 2 and 3 ,date 2, AM segmented higher values. Poor FLAIR-AM segmentation extracted even higher values for patient 4 date 2. The best segmentation (fig.3a) had a DSC value of 0.84 with false positive located in low FLAIR signal intensities. The poorest segmentation (fig.3b) had a DSC value of 0.40, with false positives located in both high T1 and FLAIR signal intensities, while false negative followed the RM intensities range. We also identified a moderate AM segmentation, DSC of 0.69 (fig.3c), with very few false positive but high number of false negative values located in high T1 and low FLAIR signal intensities.Discussion
The four test patients were selected based on their common clinical profiles, including strongly diffuse LGG and surgical resection. The mean DICE score (0.72) was slightly lower compared to the AM of studies focusing on high-grade gliomas or low-grade gliomas without cavities [4,7]. As expected, the algorithm learned to segment low T1 and high FLAIR intensities. However, segmentation failed when the glioma had a heterogeneous profile, with multiple intensity levels. The AM mainly missed LGG boundaries that showed lower intensities in FLAIR and higher intensities in T1 images compared to LGG core intensity. Segmentation errors could be explained by the fact that FLAIR images used for the training were mainly 2D with high slice thickness and by the low number of unique subjects in the training set each with multiple exams resulting in limited heterogeneity. Our data, stemming from routine clinical activity, only included few 3D-FLAIR acquisitions, but this sequence is now becoming the new standard in clinical practice. We believe that use of 3D-FLAIR will benefit automated tumor segmentation.Acknowledgements
No acknowledgement found.References
[1] « Genetics of adult glioma », Cancer Genet., vol. 205, no 12, p. 613‑621, déc. 2012, doi: 10.1016/j.cancergen.2012.10.009.
[2] J. Pallud et al., « Velocity of tumor spontaneous expansion predicts long-term outcomes for diffuse low-grade gliomas », Neuro-Oncol., vol. 15, no 5, p. 595‑606, mai 2013, doi: 10.1093/neuonc/nos331.
[3] C. Gui, J. C. Lau, S. E. Kosteniuk, D. H. Lee, et J. F. Megyesi, « Radiology reporting of low-grade glioma growth underestimates tumor expansion », Acta Neurochir. (Wien), vol. 161, no 3, p. 569‑576, 2019, doi: 10.1007/s00701-018-03783-3.
[4] K. Kamnitsas et al., « Efficient multi-scale 3D CNN with fully connected CRF for accurate brain lesion segmentation », Med. Image Anal., vol. 36, p. 61‑78, févr. 2017, doi: 10.1016/j.media.2016.10.004.
[5] « Klein S, Staring M, Murphy K, Viergever MA, Pluim JPW. elastix: a toolbox for intensity-based medical image registration. IEEE Trans. Med. Imaging 2010;29:196–205 doi: 10.1109/TMI.2009.2035616. »
[6] D. P. Shamonin et al., « Fast parallel image registration on CPU and GPU for diagnostic classification of Alzheimer’s disease », Front. Neuroinformatics, vol. 7, p. 50, 2013, doi: 10.3389/fninf.2013.00050.
[7] M. A. Naser et M. J. Deen, « Brain tumor segmentation and grading of lower-grade glioma using deep learning in MRI images », Comput. Biol. Med., vol. 121, p. 103758, juin 2020, doi: 10.1016/j.compbiomed.2020.103758.
Figures