3281
Use scout models for effective dimension reduction and feature selection in radiomics study1Shanghai Key Laboratory of Magnetic Resonance, East China Normal University, shanghai, China, 2Department of Radiology, Huashan Hospital, Fudan University, shanghai, China
Synopsis
Radiomics has been used widely in image-based diagnosis and prognosis. Since radiomics studies often involve a small number of samples, effective dimension reduction and feature selection are crucial to the successful modeling. In this study, we proposed a heuristic method for effective dimension reduction and feature selection, which built a scout model for each category of features to select features from the category for the final model building. The approach was applied to the modeling with two different datasets, including the BraTS 2019 open data, and achieved results better than those of traditional methods on both datasets.
Introduction
Radiomics has been successfully used in image-based diagnosis, prognosis etc1. While high dimension data can be used to reveal information hard to notice with naked eye and improve imaging-based diagnosis, it comes with the so-called curse of dimensionality. Dimension reduction and feature selection are used to remove irrelevant or redundant features and are crucial to the performance of radiomics models. While many algorithms have been proposed for dimension reduction and feature selection, for example, PCC, LDA, RFE2, ANOVA3, RELIEF4 and KW(Kruskal-Wallis)5, none of them can guarantee the best performance of the final model. In this study, we proposed a heuristic approach for dimension reduction/feature selection, which divided features into subsets and used features from each subset to build a scout model in order to select features in that subset.Methods
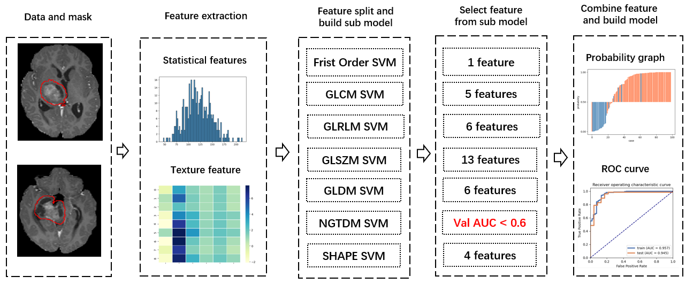
Two datasets were used to demonstrate the proposed approach: T1CE MRI images from the training set of BraTS 2019 open data of glioblastoma (GBM/HGG, n = 259) and lower grade glioma (LGG, n = 76), and a FS-PD MRI dataset consists of 215 cases chronic lateral ankle instability (CAI) and 186 normal controls (NC), retrospectively collected from Huashan Hospital of Fudan University. A same pipeline was applied to both datasets for model building and evaluation (Figure 1).Firstly, the dataset was randomly split into a training and a test dataset with a ratio of 7:3. The ratio of positive to negative will be kept the same in the two datasets. Secondly, different categories of features were extracted with pyradiomics from ROIs on the MRI images, and their transformation, including wavelet transform and Laplacian of Gaussian filtered images. Altogether, 1130 features were extracted, including shape (14), first-order (216), and texture features based on GLCM (228), GLDM (168), GLRLM (192), GLSZM (192),and NGTDM (60). Then, each group of features were used to build a scout model with the training data using a standard process described later. The scout model with a low cross-validation AUC (the threshold was set to 0.6 in this study) would be ignored, while features retained in the remaining models would be combined to build the final model using the same process as the one used in scout model building. Finally, the performance of the final model was evaluated using the test dataset with ROC (receiver operating characteristic) analysis, and radiomics score plot etc.
For standard radiomics model building, features were normalized by subtracting mean and divided by the range and Pearson correlation coefficient was used to remove redundant features. Then a k-fold cross-validation process was used to select the best model with optimal hyper-parameters. In each fold, the training data was balanced using either upsampling or SMOTE algorithm. RFE, Relief, ANOVA or KW was used for feature selection and SVM or LR was used as classifier. All the above process was implemented with an open-source software FeatureExplorer6, which can automatically try out combinations of different algorithms selected by users for each step of radiomics pipeline to find the best model. For comparison, radiomics models were also built with all the features, using different dimension reduction / feature selection algorithms.
Results
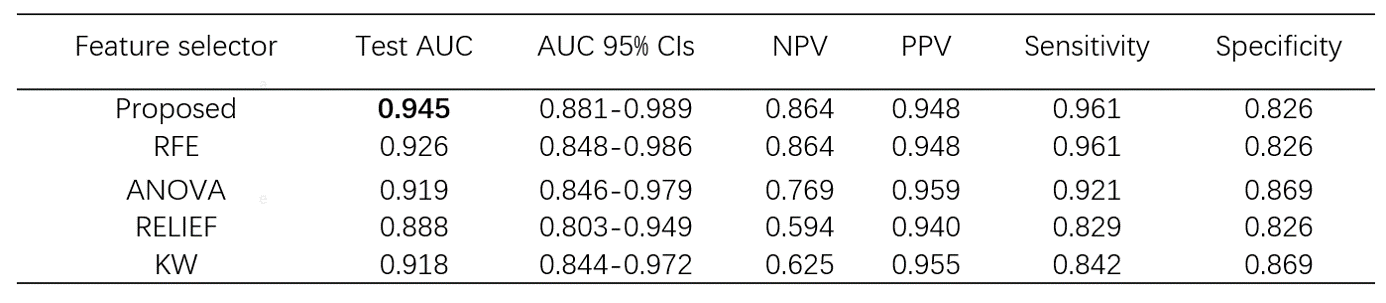
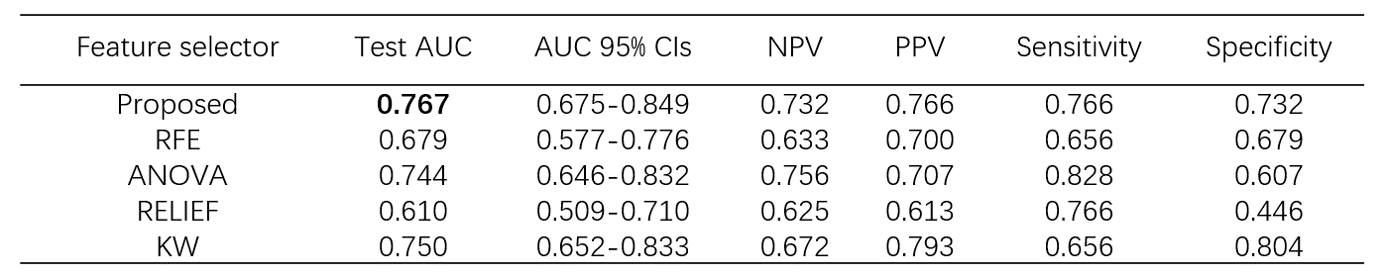
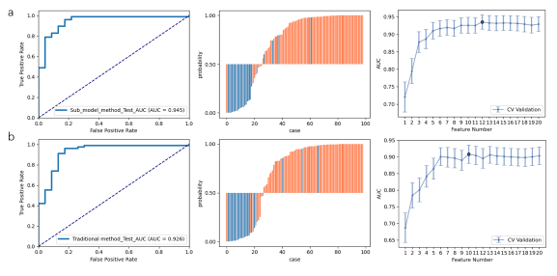
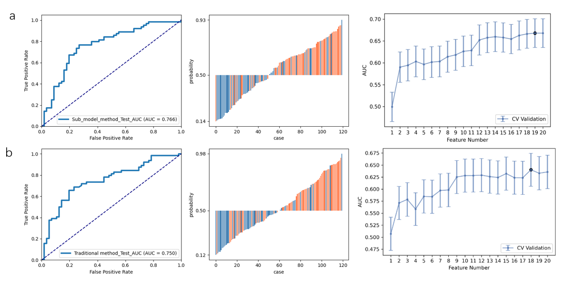
The performances of the radiomics models using different feature selectors over BraTS 2019 and CAI dataset are compared in Table 1 and Table 2, respectively. It can be seen that the proposed approach exhibited the best performance on both datasets. This is also demonstrated in the ROC curves and radiomics score plots shown in Figure 2 and Figure 3, in which the performance of the proposed approach is compared with the best feature selector.Discussion and Conclusion
Our approach achieved the best performance on both the open BraTS 2019 data and CAI dataset, suggesting a new alternative for dimension reduction and feature selection. It should be noted that this approach is heuristic and cannot guarantee the best performance. Also, it uses other feature selectors in the process of scout model building wherever too many candidate features are involved. The proposed approach has an extra advantage over the traditional approach of feeding all the features into a single model building: with the building of scout model for subsets of features, we can know more about the expected contributions of each subsets to the classification, and excluded a whole subset from the final model building, which can effectively reduce the dimension of the feature space. This will be especially useful when we are building radiomics models This approach also has some limitations. First, it still needs to be validated in more projects. Besides, it makes the model building process more complicated, so it will be helpful to implement it as an automated process pipeline in open-source software like FeatureExplorer. In summary, scout models can be built for different categories of radiomics features to find useful combinations of features and use them in the final radiomics model building. This can be used as an alternative to the classic dimension reduction and feature selection algorithms.Acknowledgements
No acknowledgement found.References
1. R.W.Y. Granziera, T.J.A. van Nijnatten, H.C. Woodruff et al. Exploring breast cancer response prediction to neoadjuvant systemic therapy using MRI-based radiomics: A systematic review. European Journal of Radiology, 2019, (121)108736.
2. Shahnorbanun Sahrana, Dheeb Albashishb, Azizi Abdullaha et al. Absolute cosine-based SVM-RFE feature selection method for prostate histopathological grading. Artificial Intelligence in Medicine, 2018, (87)78-90.
3. Mukesh Kumar, Nitish Kumar Rath, Amitav Swain et al. Feature Selection and Classification of Microarray Data using MapReduce based ANOVA and K-Nearest Neighbor. Procedia Computer Science, 2015, (54)301-310.
4. Ryan J. Urbanowicz, Melissa Meeker, William La Cava et al. Relief-based feature selection: Introduction and review. Journal of Biomedical Informatics, 2018, (85)189-203.
5. Suxin Guo, Sheng Zhong, Aidong Zhang. Privacy-preserving Kruskal–Wallis test. Computer Methods and Programs in Biomedicine, 2013, (112)135-145.
6. Song Y, Zhang J, Zhang YD et al. FeAture Explorer (FAE). A tool for developing and comparing radiomics models. A tool for developing and comparing radiomics models. PLoS One, 2020, 15(8): e0237587.
Figures