3274
Exploring Brain Regions Involved in Working Memory using Interpretable Deep Learning1Biomedical Engineering, Stony Brook University, Stony Brook, NY, United States, 2Psychiatry, Renaissance School of Medicine at Stony Brook University, Stony Brook, NY, United States, 3Radiology, Renaissance School of Medicine at Stony Brook University, Stony Brook, NY, United States
Synopsis
Although deep learning algorithms are a novel method for neuroimage analysis, at times they are used as a “black box” for classification task. Therefore, it is crucial to develop methods to comprehend the abstract features used for prediction. We have developed an interpretable deep learning algorithm to predict working memory scores from fMRI data; wherein prediction performance was compared to Kernel Ridge Regression, a traditional machine learning approach. Across all metrics of evaluation, our method outperformed KRR. Moreover, our method was able to create averaged saliency maps highlighting regions most predictive of working memory scores.
Introduction
The Deep Learning (DL) revolution has provided novel solutions to many different problems. Specifically, Convolutional Neural Network (CNN) is a novel and robust method for neuroimage analysis1-3. Unfortunately, many DL algorithms have been used as a “black box” for classification tasks on a myriad of subject data. Although results from these DL-based approaches are encouraging, it is more important to understand the underlying information that the algorithm is using to infer the classification.We have developed an interpretable deep learning algorithm to predict working memory (WM) subconstruct scores using fMRI data from a working memory task. This CNN network allows us to predict subject’s working memory scores based off of cortical activation data which outperforms traditional machine learning approach. Moreover, this pipeline allows us to synthesize saliency maps that highlight regions that were most predictive of the outcome measure.
Methods
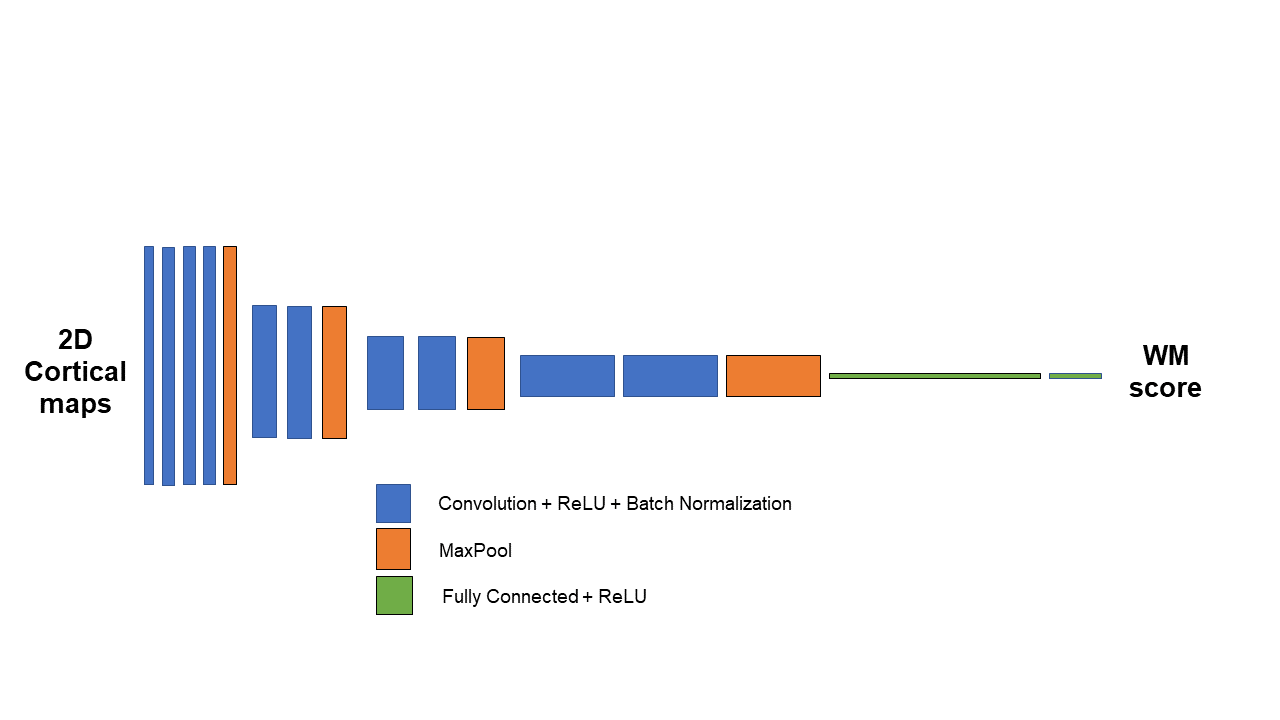
420 fMRI datasets from the Human Connectome Project (HCP)4 were used in this analysis. Cortical activation maps from a 2-back WM task were used as input to the CNN network. This data was used to predict WM score. Our CNN network consisted of 4 convolutional blocks (Figure 1). Each block consisted of various 2D convolutional layers with kernel size 3 x 3 ending with a rectified linear unit (ReLU). Batch normalization was used after each convolutional layer and an L2 regularization with lambda equal to 0.5 was used. Filters were initialized at 16 and were doubled each convolutional block. 2D Maxpooling was conducted at the end of each convolutional block. After the 4th convolutional block, the data was flattened and fully connected. Dropout layers were used as a method for regularization. Final output was a single regression value predicting the WM score of the subject with an L2 loss function. ADASYN weighted distribution algorithm was used to assist the network in learning with an imbalanced dataset5. The network was trained/validated/tested on 135/50/235 subjects. Kernel Ridge Regression (KRR), a traditional machine learning approach, was used as a comparison. The prediction performance was evaluated using R-square, mean absolute error (MAE), mean absolute percent error (MAPE) and root mean square error (RMSE). An average saliency map indicating the cortical regions most predictive for the outcome measure was generated using testing set only along with the trained network.Results
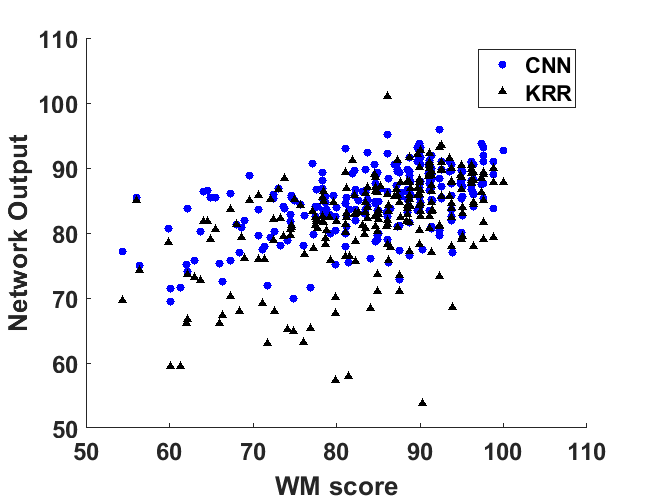
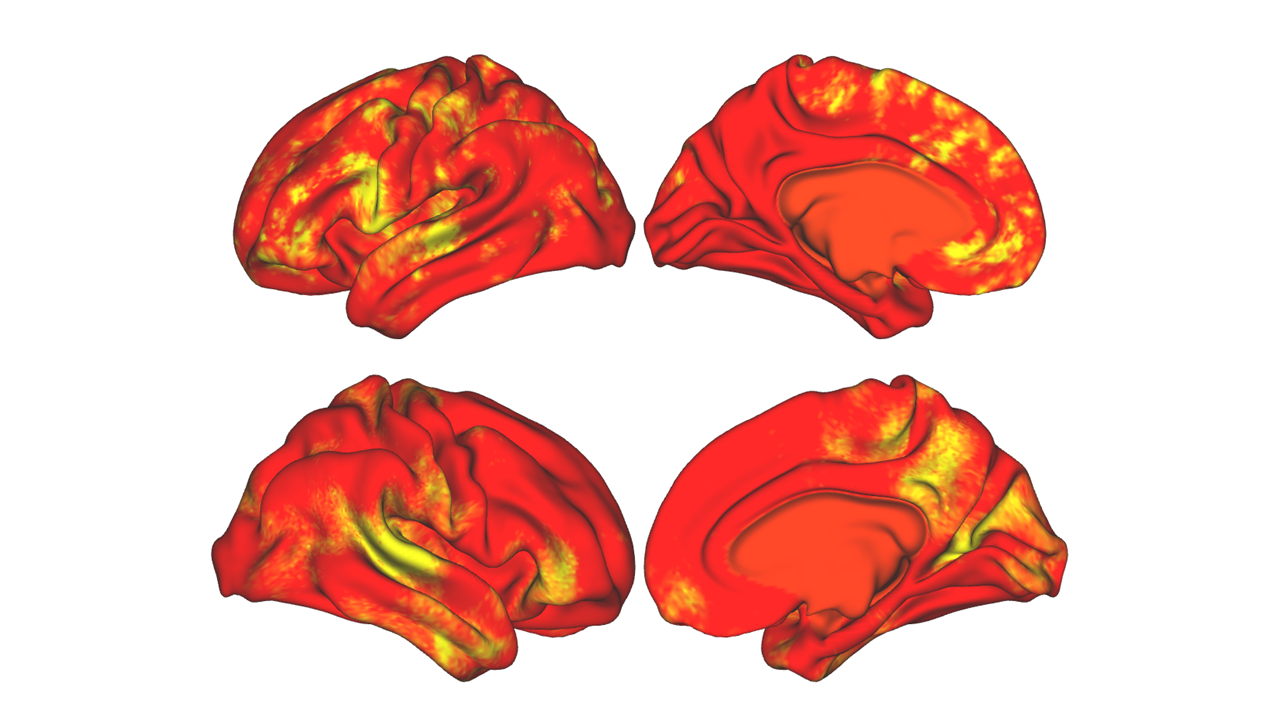
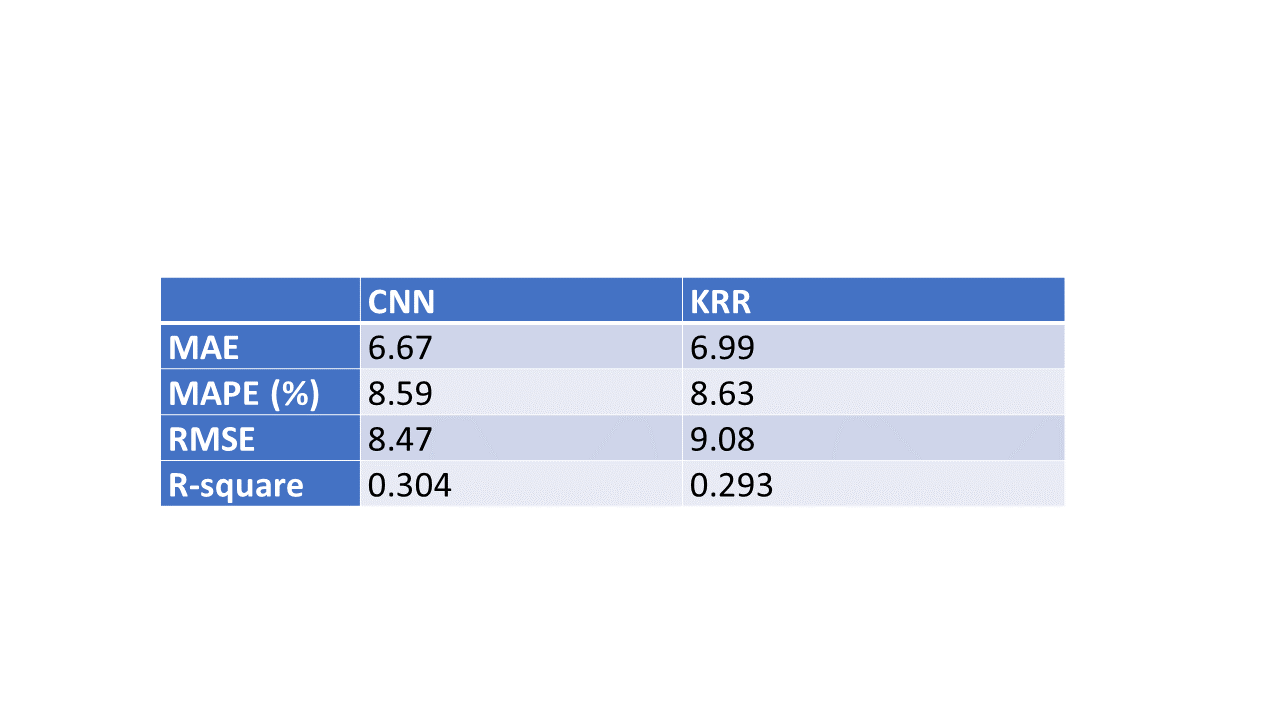
Across all metrics, CNN outperformed KRR in predicting WM scores from cortical 2-back fMRI activation map. As shown in Table 1, these metrics show that CNN had an R-square of 0.304 compared to KRR’s R-square of 0.293. CNN also outperformed KRR in MAE (6.67 vs. 6.99), MAPE (8.59% vs. 8.63%), and RMSE (8.47 vs. 9.08). Figure 2 shows ground-truth WM scores vs. predictions by CNN and KRR models. Average saliency map was obtained from the CNN model and shown in Figure 3.Discussion
We have developed an interpretable deep learning model with cortical activation maps from 2-back task as input to predict WM scores. Besides the proposed network, we optimized a KRR model as comparison. Across all quantitative metrics, our CNN model outperformed KRR. Moreover, since CNN directly takes cortical activation maps as input, it was able to create interpretable saliency maps that pinpoint specific cortical regions most predictive of the outcome measure. As shown in Figure 2, these saliency maps highlight voxels that agree well with the known neurocircuit that comprises working memory tasks: left dorsal lateral PFC, medial PFC and intraparietal sulcus6; further indicating that interpretable deep learning based predictive models can feasibly identify mechanisms and neurocircuits responsible for a given task. Additionally, it can be seen that regions such as isthmus cingulate had significant contribution to the making of the prediction but have not been previously associated with WM. Therefore, it would be of interest to conduct additional analysis to see if CNN saliency maps reveal new regions associated with WM.Conclusion
This interpretable deep learning algorithm has shown to outperform KRR in predicting WM scores from cortical activation maps in 2-back WM task. More importantly, the model allows to generate saliency maps to localize regions that are most predictive of the outcome measure. Therefore, this interpretable model provides a fully data-driven method for identifying potential cortical regions underlying cognitive subconstructs.Acknowledgements
No acknowledgement found.References
1. Spuhler KD, Ding J, Liu C, et al. Task‐based assessment of a convolutional neural network for segmenting breast lesions for radiomic analysis. Magnetic resonance in medicine. 2019.
2. Xu J, Gong E, Pauly J, Zaharchuk GJapa. 200x Low-dose PET reconstruction using deep learning. 2017.
3. Cui J, Gong K, Guo N, et al. PET image denoising using unsupervised deep learning. European Journal of Nuclear Medicine and Molecular Imaging. 2019;46(13):2780-2789.
4. Van Essen DC, Ugurbil K, Auerbach E, et al. The Human Connectome Project: a data acquisition perspective. Neuroimage. 2012;62(4):2222-2231.
5. He H, Bai Y, Garcia EA, Li S. ADASYN: Adaptive synthetic sampling approach for imbalanced learning. Paper presented at: 2008 IEEE international joint conference on neural networks (IEEE world congress on computational intelligence)2008.
6. Curtis CE, D'Esposito M. Persistent activity in the prefrontal cortex during working memory. Trends in cognitive sciences. 2003;7(9):415-423.
Figures