3271
Pattern-based features extraction algorithm in the diagnosis of neurodegenerative diseases from diffusion MRI
Sung-han Lin1, Chih-Chien Tsai1, Yi-Chun Chen2,3, and Jiun-Jie Wang1
1Department of Medical Imaging and Radiological Sciences, Chang-Gung University, TaoYuan, Taiwan, 2Department of Neurology, Chang Gung Memorial Hospital Linkou Medical Center, TaoYuan, Taiwan, 3College of Medicine, Chang Gung University, TaoYuan, Taiwan
1Department of Medical Imaging and Radiological Sciences, Chang-Gung University, TaoYuan, Taiwan, 2Department of Neurology, Chang Gung Memorial Hospital Linkou Medical Center, TaoYuan, Taiwan, 3College of Medicine, Chang Gung University, TaoYuan, Taiwan
Synopsis
Improvement of diagnosis in patients with Mild Cognitive Impairment (MCI) would help in the early diagnosis of Alzheimer's Disease (AD), since MCI was known as the transition state from normal aging to AD. We developed a novel feature extraction algorithm, which was based on the disease clinical-pathological understanding and combined with the spatial information between disease affected pattern and its surrounding regions. This novel feature set demonstrated improved diagnostic performance, compared to the conventional feature set, especially for the MCI patients. In addition, the identified disease affected pattern corresponded with the postmortem pathology of amyloid deposition in AD patients.
INTRODUCTION
Mild Cognitive Impairment (MCI) was known as the transition state from normal aging to AD 1. Improvement of diagnosis in MCI patients would help in the early diagnosis of AD. In previous machine-based diagnosis studies, the features either focused on the hippocampus and its surrounding areas 2, 3. However, AD/MCI caused neurodegeneration is subtle in multiple brain regions spontaneously 4.In the current study, we developed a feature extraction algorithm based on a clinical-pathological understanding of the disease and combined with the spatial information between disease affected pattern and its surrounding regions. Applied with the diffusion tensor imaging derived indices, the selected features would sensitively reveal subtle changes in the brain and benefit for disease diagnosis as early as possible.
METHODS
In total, 499 subjects with AD (34 men and 58 women; mean age: 71.2 ± 12.9 years), MCI (67 men and 80 women; mean age: 69.2 ± 7.7 years), and healthy controls (HC, 113 men and 147 women; mean age: 61.3 ± 8.0 years) were recruited respectively (IRB: 201601386B0). All subjects were randomly divided into the training and testing datasets with an 80:20 ratio, respectively.Images were acquired using a 3T MR scanner (MAGNETOM Trio a TIM system, Siemens, Erlangen, Germany) with T1-MPRAGE images (TR / TE = 2000 / 2.63 ms, 160 axial slices of voxel size = 1 × 1 × 1 mm3, inversion time = 900 ms, flip angle = 9º) and Diffusion-weighted images (DWI) were acquired (TR/TE = 7324 / 83 ms, 64 axial slices of voxel size = 2 × 2 × 2 mm3, b-value = 1000 s/mm2 with the 64 non-collinear diffusion-weighted gradient directions).
The primary and secondary feature sets were extracted from four diffusion tensor image (DTI) derived images (Mean Diffusivity, Fractional Anisotropy, Axial Diffusivity, and Radial Diffusivity) reconstructed from DWI. The primary feature set was extracted from the 10th, 50th, and 90th percentiles of 116 parcellated brain regions, and 1392 features were extracted (Figure 1A). The parcellation of the whole brain image would be achieved by overlaid the DTI derived indices, the parenchyma mask, and individualized Automated Anatomical Labeling (AAL) template, which was applied with the inversed transformation matrix from the individual’s non-diffusion weighted image (B0) to the standard space. The disease affected pattern was identified from the primary feature set with a statistical approach selection procedure, including the group difference selection (ANOVA) and the Correlation-Occurrence Selection (COS). In addition, the one-ROI-one-feature strategy was applied to the selected primary feature set.
The secondary features were designed to reflect slopes on the edge of affected regions. Specifically, features were achieved by calculating the quotient between the difference value and the corresponding distance between each selected primary feature and its surrounding areas (Figure 1B). Only slopes involved in the disease affected pattern were selected. An additional neighborhood selection was applied to the calculated distance matrix. The group difference filter and COS were applied to the secondary feature sets to reduce the feature dimension. The support vector machine (Matlab R2018a, The MathWorks, Natick, MA) was applied to the classification task. The diagnostic performance was evaluated by accuracy for each group in the testing dataset.
RESULTS
The selected secondary features showed significant improvement in classification accuracy in testing group, when compared to the features from the disease affected pattern (HC/MCI/AD =81.16±2.96 / 76.72±1.64 / 88.90±1.14% and 72.09±1.69 / 65.29±2.95 / 83.32±1.40% in the secondary and primary feature set, respectively). 108/1392 primary features (MD/FA/AD/RD = 29/31/25/23) were selected as the disease affected pattern and mainly found in basal portions of the bilateral frontal, temporal, and occipital lobe (Figure 2). On the other hand, 900 secondary features were derived from the disease affected pattern, and 102 features (MD/FA/AD/RD = 21/37/31/13) were selected (Figure 3).DISCUSSION
The current study demonstrated improved diagnostic performance in the disease affected pattern derived feature set, especially for HC and patients with MCI patients (approximately 10%, 11% and 6% of testing accuracy in HC, MCI, and AD, respectively). The disease affected pattern from the primary feature set corresponded with the postmortem pathology of amyloid deposition, such as the isocortex and the basal portions of the frontal, temporal and occipital lobe in patients with AD at the early stages 5. On the other hand, over 88% of selected the primary feature were extreme values since this disease would cause subtle changes in multiple brain regions is known as one of the signatures of MCI/AD 5. Most selected secondary features were links between different extreme values (such as 10th and 90th percentiles) and might effectively benefit to classification by enhancing the difference between classes.CONCLUSION
In the current study, we proposed a novel algorithm to extract image features based on the disease affected patterns. This newly developed feature set demonstrated the improvement of diagnostic performance, compared to the primary feature set. The identified pattern from the primary feature set could reflect the disease-affected pattern and be similar to the histology evidence. Additionally, visualized network from selected secondary features further acknowledged the disease affection pattern in the clinical understanding.Acknowledgements
No acknowledgement found.References
- Sabbagh MN, Lue LF, Fayard D, Shi J. Increasing Precision of Clinical Diagnosis of Alzheimer's Disease Using a Combined Algorithm Incorporating Clinical and Novel Biomarker Data. Neurol Ther. 2017;6(Suppl 1):83-95.
- Feng F, Wang P, Zhao K, Zhou B, Yao H, Meng Q, et al. Radiomic Features of Hippocampal Subregions in Alzheimer's Disease and Amnestic Mild Cognitive Impairment. Front Aging Neurosci. 2018;10:290.
- Zhao K, Ding Y, Han Y, Fan Y, Alexander-Bloch AF, Han T, et al. Independent and reproducible hippocampal radiomic biomarkers for multisite Alzheimer’s disease: diagnosis, longitudinal progress and biological basis. Science Bulletin. 2020;65(13):1103-13.
- Oxtoby NP, Alexander DC, consortium ftE. Imaging plus X: multimodal models of neurodegenerative disease. Current Opinion in Neurology. 2017;30(4):371-9.
- Braak H, Braak E. Neuropathological stageing of Alzheimer-related changes. Acta Neuropathol. 1991;82(4):239-59.
Figures
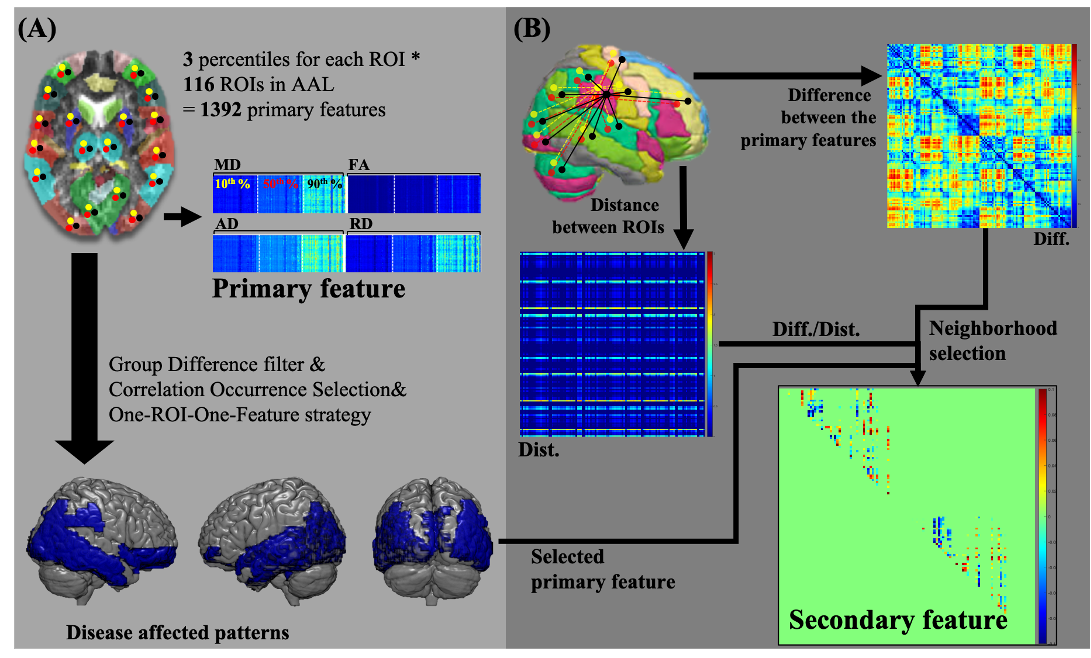
Figure 1. Flowchart of feature extraction. For all four DTI
derived indices in each subject, the feature extraction procedure can be
divided into the primary feature from each anatomical region in the brain (panel
A), and the secondary feature set (panel B), which was derived from the disease
affected pattern. The secondary features were calculated from the product of the
value difference to the distance between two primary features. Only features
were involved in the disease affected pattern and passed the neighborhood
selection were selected.
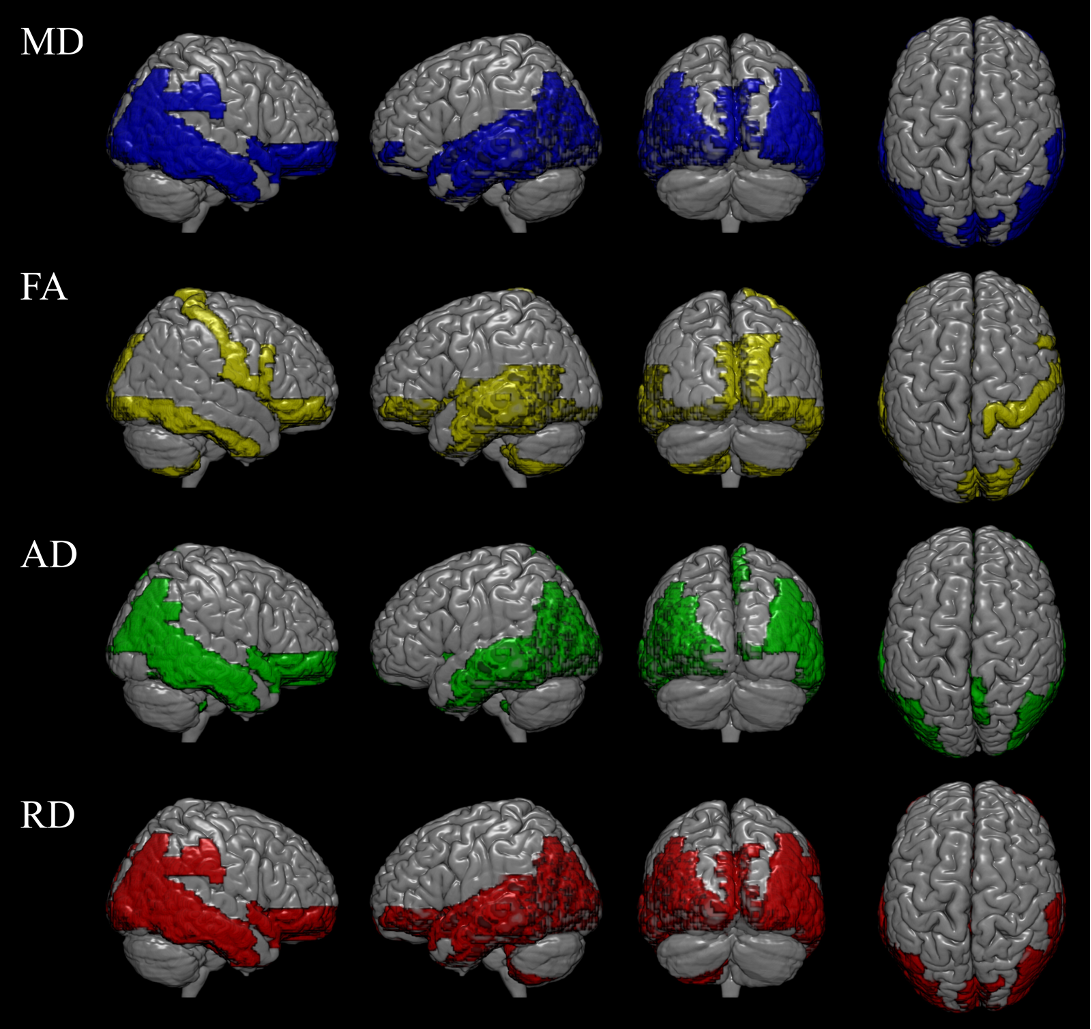
Figure 2. The disease affected pattern in four
DTI derived indices. The disease affected pattern was showed in mean diffusivity
(29/116 AAL regions), fractional anisotropy (31/116 AAL regions), axial
diffusivity (25/116 AAL regions), and radial diffusivity (23/116 AAL regions),
respectively. The affected region mainly in basal portions of the
frontal, temporal, and occipital lobe.
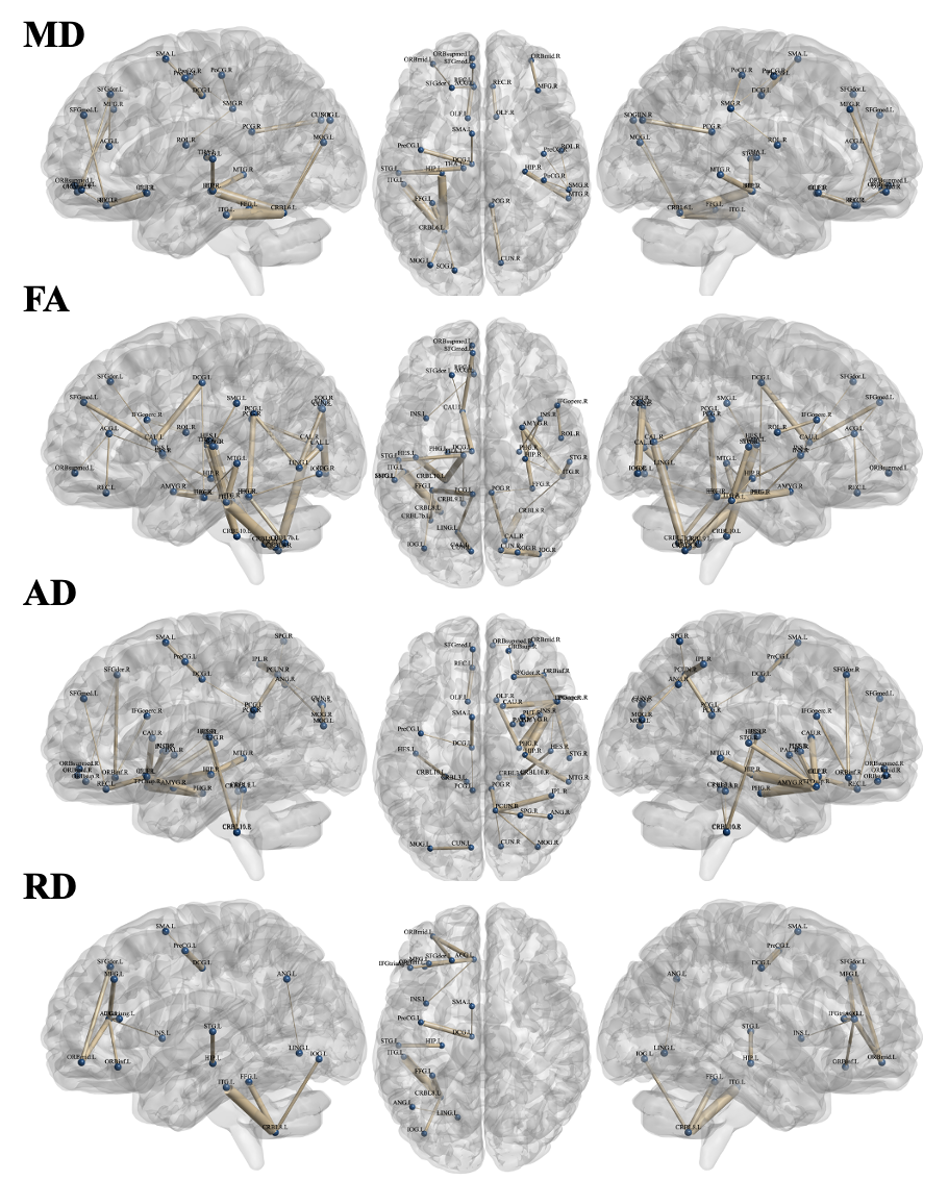
Figure
3. The selected secondary feature set in four DTI derived indices. The selected secondary feature set was showed in mean diffusivity (21 links), fractional
anisotropy (37 links), axial diffusivity (31 links), and radial diffusivity (13
links), respectively. Blue nodes indicate the anatomical regions in the AAL
template. Links between nodes indelicate the secondary features and the thicker
link means the more significance among classes.