3268
Delineating parkinsonian disorders using T1-weighted MRI based radiomics
Priyanka Tupe Waghmare1, Archith Rajan2, Shweta Prasad3, Jitender Saini4, Pramod Kumar Pal5, and Madhura Ingalhalikar6
1E &TC, Symbiosis Institute of Technology, Pune, India, 2Symbiosis Centre for Medical Image Analysis, Symbiosis Centre for Medical Image Analysis, Pune, India, 3Department of Clinical Neurosciences and Neurology, National Institute of Mental Health & Neurosciences, Bangalore, India, 4Department of Neuroimaging & Interventional Radiology, National Institute of Mental Health & Neurosciences, Bangalore, India, 5Department of Neurology, National Institute of Mental Health & Neurosciences, Bangalore, India, 6Symbiosis Center for Medical Image Analysis and Symbiosis Institute of Technology, Pune, India
1E &TC, Symbiosis Institute of Technology, Pune, India, 2Symbiosis Centre for Medical Image Analysis, Symbiosis Centre for Medical Image Analysis, Pune, India, 3Department of Clinical Neurosciences and Neurology, National Institute of Mental Health & Neurosciences, Bangalore, India, 4Department of Neuroimaging & Interventional Radiology, National Institute of Mental Health & Neurosciences, Bangalore, India, 5Department of Neurology, National Institute of Mental Health & Neurosciences, Bangalore, India, 6Symbiosis Center for Medical Image Analysis and Symbiosis Institute of Technology, Pune, India
Synopsis
Parkinson’s disease (PD), multiple system atrophy (MSA), and progressive supra-nuclear palsy (PSP) are neurodegenerative disorders which have parkinsonism as a core clinical feature. In the early stages PD and atypical parkinsonian syndrome (APS) (MSA and PSP) may often be indistinguishable and differential diagnosis is therefore crucial. Our work employs radiomics based features extracted from standard T1 weighted MRI images that are used in a machine learning framework to differentiate PD from APS. Results demonstrate a superior test accuracy of 92% that support our underlying hypothesis that radiomics on T1-weighted images can provide a discriminatory feature space between PD and APS.
Introduction
PD, MSA and PSP are neurodegenerative disorders which have parkinsonism as a core clinical feature [1]. MSA and PSP are classified as atypical parkinsonian syndrome (APS) owing to the presence of specific symptoms such as autonomic dysfunction in MSA, and early falls in PSP. However, these features become evident only a few years into the illness. In the early stages, PD, MSA and PSP, may often be indistinguishable based on the standard clinical criteria. The present study aims to investigate the feasibility of classifying these parkinsonian disorders, i.e., PD and APS based on radiomic features extracted from standard clinical 3D T1 weighted images. These images are routinely acquired as part of a standard clinical scans owing to which they can be used for differential diagnosis with relative ease. We hypothesise that first order and texture based radiomics features will illustrate region specific differences between PD and APS.Methods
Sixty-five patients with PD, 61 patients with APS – MSA and PSP, and 75 healthy controls (HC) were retrospectively recruited. 3D T1 TFE images were acquired on a Philips Achieva 3T with repetition time (TR) = 8.1 ms, echo time (TE)= 3.7 ms, flip angle = 8°, sense factor = 3.5, field of view (FOV) = 256 × 256 × 155 mm, voxel size = 1×1×1 mm, slice thickness = 1 mm, acquisition matrix=256×256x165 sagittal slices. Following acquisition, a standard Freesurfer 6.0 (http://surfer.nmr.mgh.harvard.edu) [4] processing pipeline was applied to the T1 structural images (Figure-1) where these were parcellated into 86 brain regions based on the Desikan Killiany atlas [5]. Only 19 ROIs namely the brainstem, bilaterally the cerebellar grey matter, cerebellar white matter, caudate, putamen, pallidum, ventral diencephalon, thalamus and nucleus accumbens were selected for radiomics computation. A substantia nigra pars compacta (SNc) atlas that used neuromelanin sensitive MR images to delineate SNc bilaterally in the MNI space [6] was used to define SNc ROIs. Radiomics features were computed using pyRadiomics library and included 18 First Order features ,24 textural features from Gray Level Co-occurrence Matrix (GLCM), 16 features from Gray Level Run Length Matrix (GLRLM),14 features from Gray Level Dependence Matrix (GLDM),16 features from Gray Level Size Zone Matrix (GLSZM) and 5 features from Neighbouring Gray Tone Difference Matrix (NGTDM). The data was divided into 80% training and the remaining 20 % was used as the test set. Random Forest based Recursive Feature Elimination with Cross Validation (RF-RFECV) was employed for feature selection. A 5-fold CV was used on the training set for cross-validations. With RF-RFECV, a total of 27 features each were considered optimal after a 5-fold CV for PD vs HC and PD vs APS classification, whereas 37 features were considered optimal for classification of HC vs APS. The random forest was implemented using 10000 trees and maximum depth as 2. Testing of the model was done on the dataset of n = 28 (HC vs APS), 26 (PD vs APS) and 28 (HC vs PD).Results
Table 1 provides the demographic and clinical information of the dataset under consideration. The radiomics based RF classifier for PD vs HC performed at a test accuracy of 62%, (average CV accuracy=72%, Area under- ROC (AU-ROC) = 0.61) (Table-2). The test accuracy for classifying APS vs HC was 86% (average CV accuracy = 90%, AU-ROC = 0.96). Finally, the test accuracy for PD vs APS was 92% (average CV accuracy = 92%, AU-ROC = 0.99). Figure-2 shows the top-most radiomics based features obtained after RF classification. These included a mixture of first order, GLCM, GLDM and GLRLM features. The top ROIs included the SNc, ventral diencephalon, cerebellum, accumbens, caudate and putamen included regions that are known to be involved in the pathogenesis of PD and APS. Figure 3 shows the regions of interest from where the most important features were extracted.Conclusion
The clinical diagnosis of parkinsonian disorders is often complicated in the early stages of illness owing to similarities in clinical features [7] .However, by abstracting phenotypic quantitative textural and intensity features which have a unique capability of illustrating microstructural and tissue level alterations, employed into a multivariate machine learning framework, our work demonstrated with a superior accuracy, the feasibility of classifying parkinsonian disorders, i.e., PD and APS based on standard clinical 3D T1 weighted images. ROI’s such as the brainstem and cerebellum are specific to PSP and MSA whereas the basal ganglia is a core component of both PD, and APS. The delineating features in PD vs HC were mainly captured from the SNc followed by thalamus and ventral diencephalon. In the comparison of PD vs APS, features were extracted from the ventral diencephalon and from the cerebellum. The results obtained, expand the possibility of the role of machine learning based classification techniques in clinical practice. This may aid in the clinical diagnosis of PD and APS which may often be indistinguishable in early stages of disease.Acknowledgements
No acknowledgement found.References
1 Williams DR, Litvan I (2013) Parkinsonian syndromes. Continuum (Minneap Minn) 19:1189-1212 2 Lambin P, Leijenaar RTH, Deist TM et al (2017) Radiomics: the bridge between medical imaging and personalized medicine. Nat Rev Clin Oncol 14:749-762 3 van Timmeren JE, Cester D, Tanadini-Lang S, Alkadhi H, Baessler B (2020) Radiomics in medical imaging-"how-to" guide and critical reflection. Insights Imaging 11:91 4 Fischl B, van der Kouwe A, Destrieux C et al (2004) Automatically parcellating the human cerebral cortex. Cereb Cortex 14:11-22 5 Desikan RS, Segonne F, Fischl B et al (2006) An automated labeling system for subdividing the human cerebral cortex on MRI scans into gyral based regions of interest. Neuroimage 31:968-980 6 Safai A, Prasad S, Chougule T, Saini J, Pal PK, Ingalhalikar M (2020) Microstructural abnormalities of substantia nigra in Parkinson's disease: A neuromelanin sensitive MRI atlas based study. Human brain mapping 41:1323-1333 7 Hughes AJ, Daniel SE, Ben-Shlomo Y, Lees AJ (2002) The accuracy of diagnosis of parkinsonian syndromes in a specialist movement disorder service. Brain 125:861-870Figures
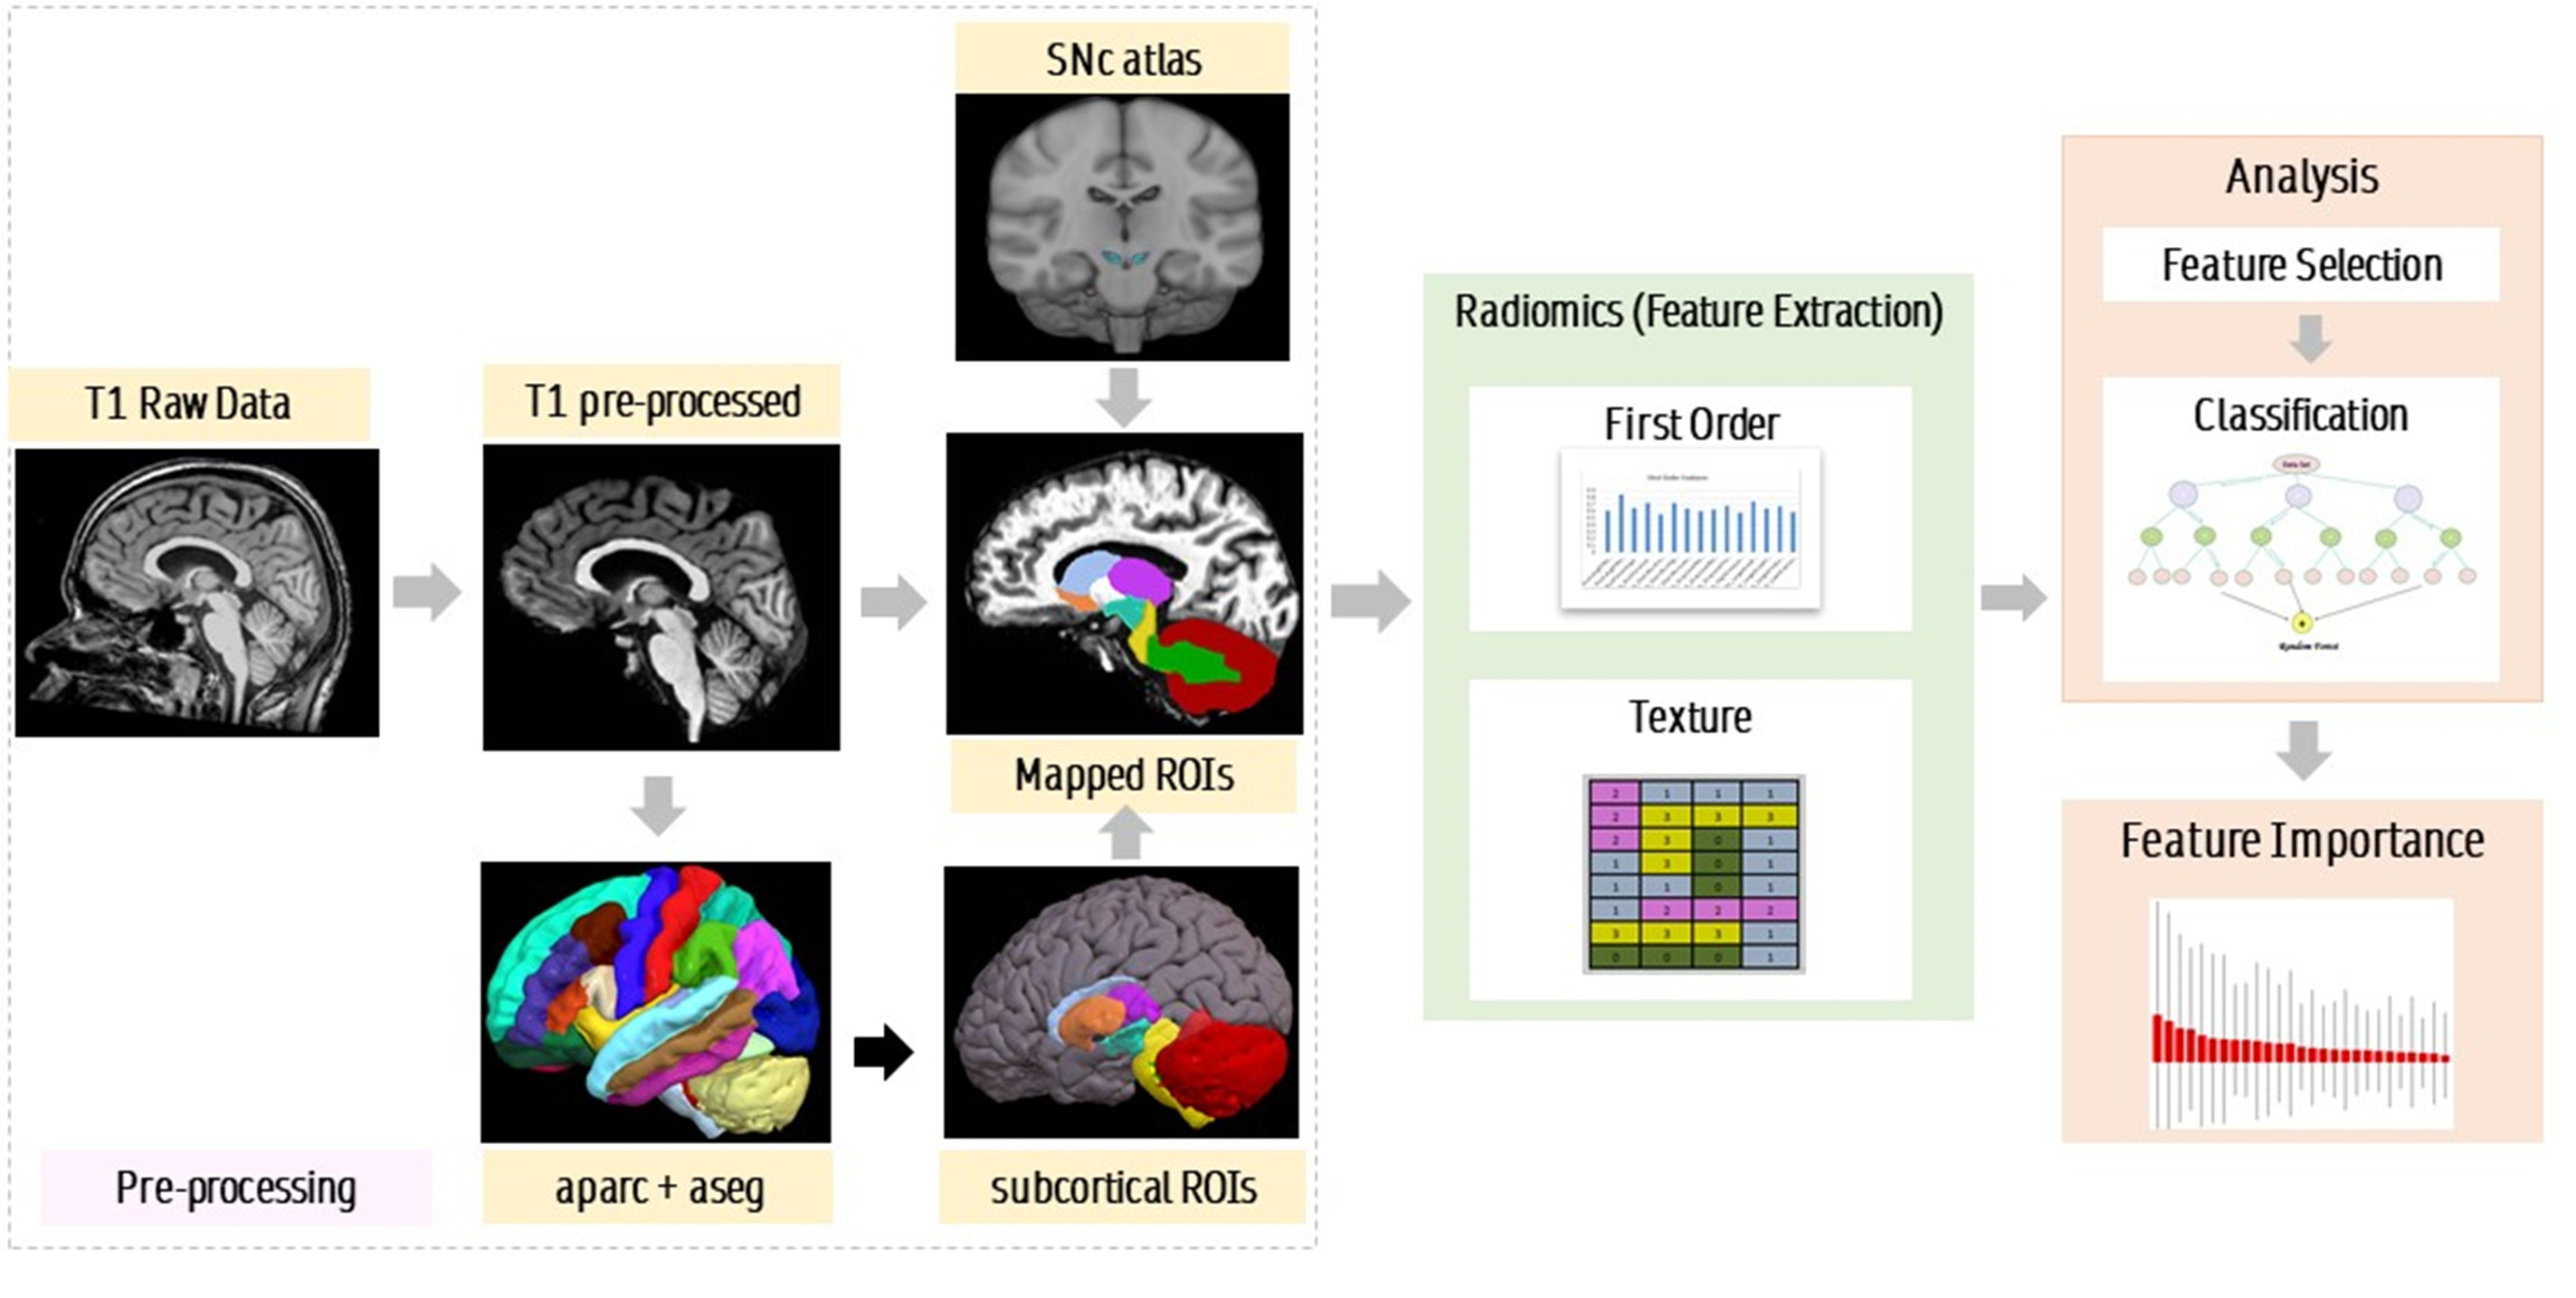
Pipeline for radiomics analysis and feature extraction
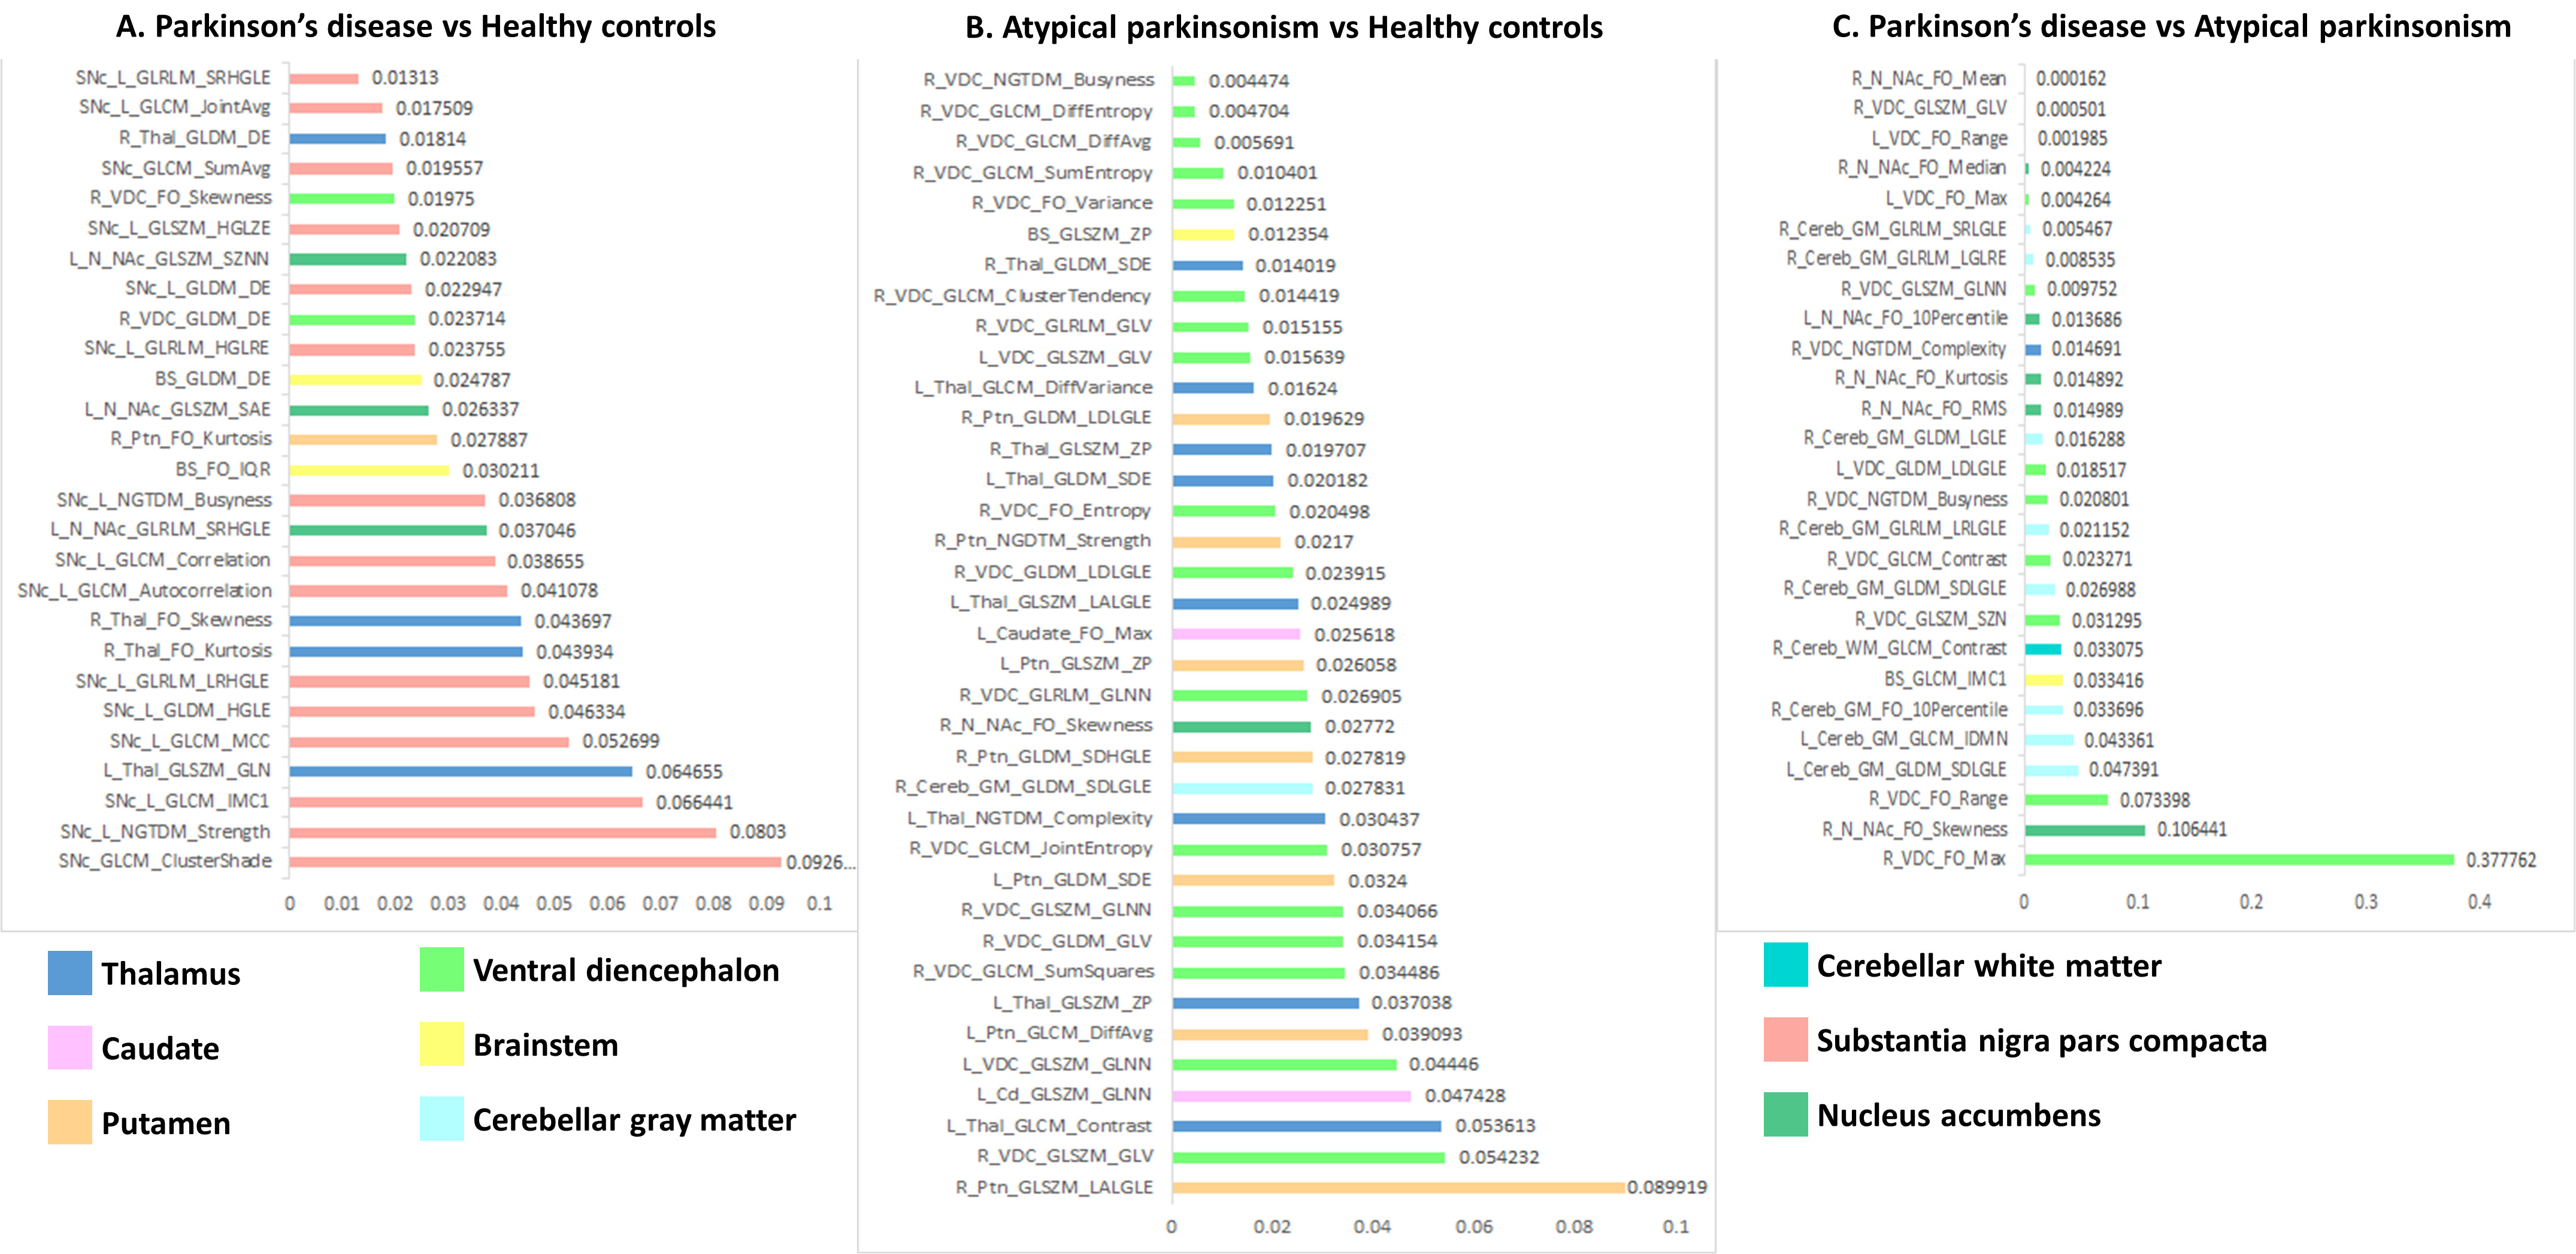
Top-most radiomics based features
obtained after RF classification.
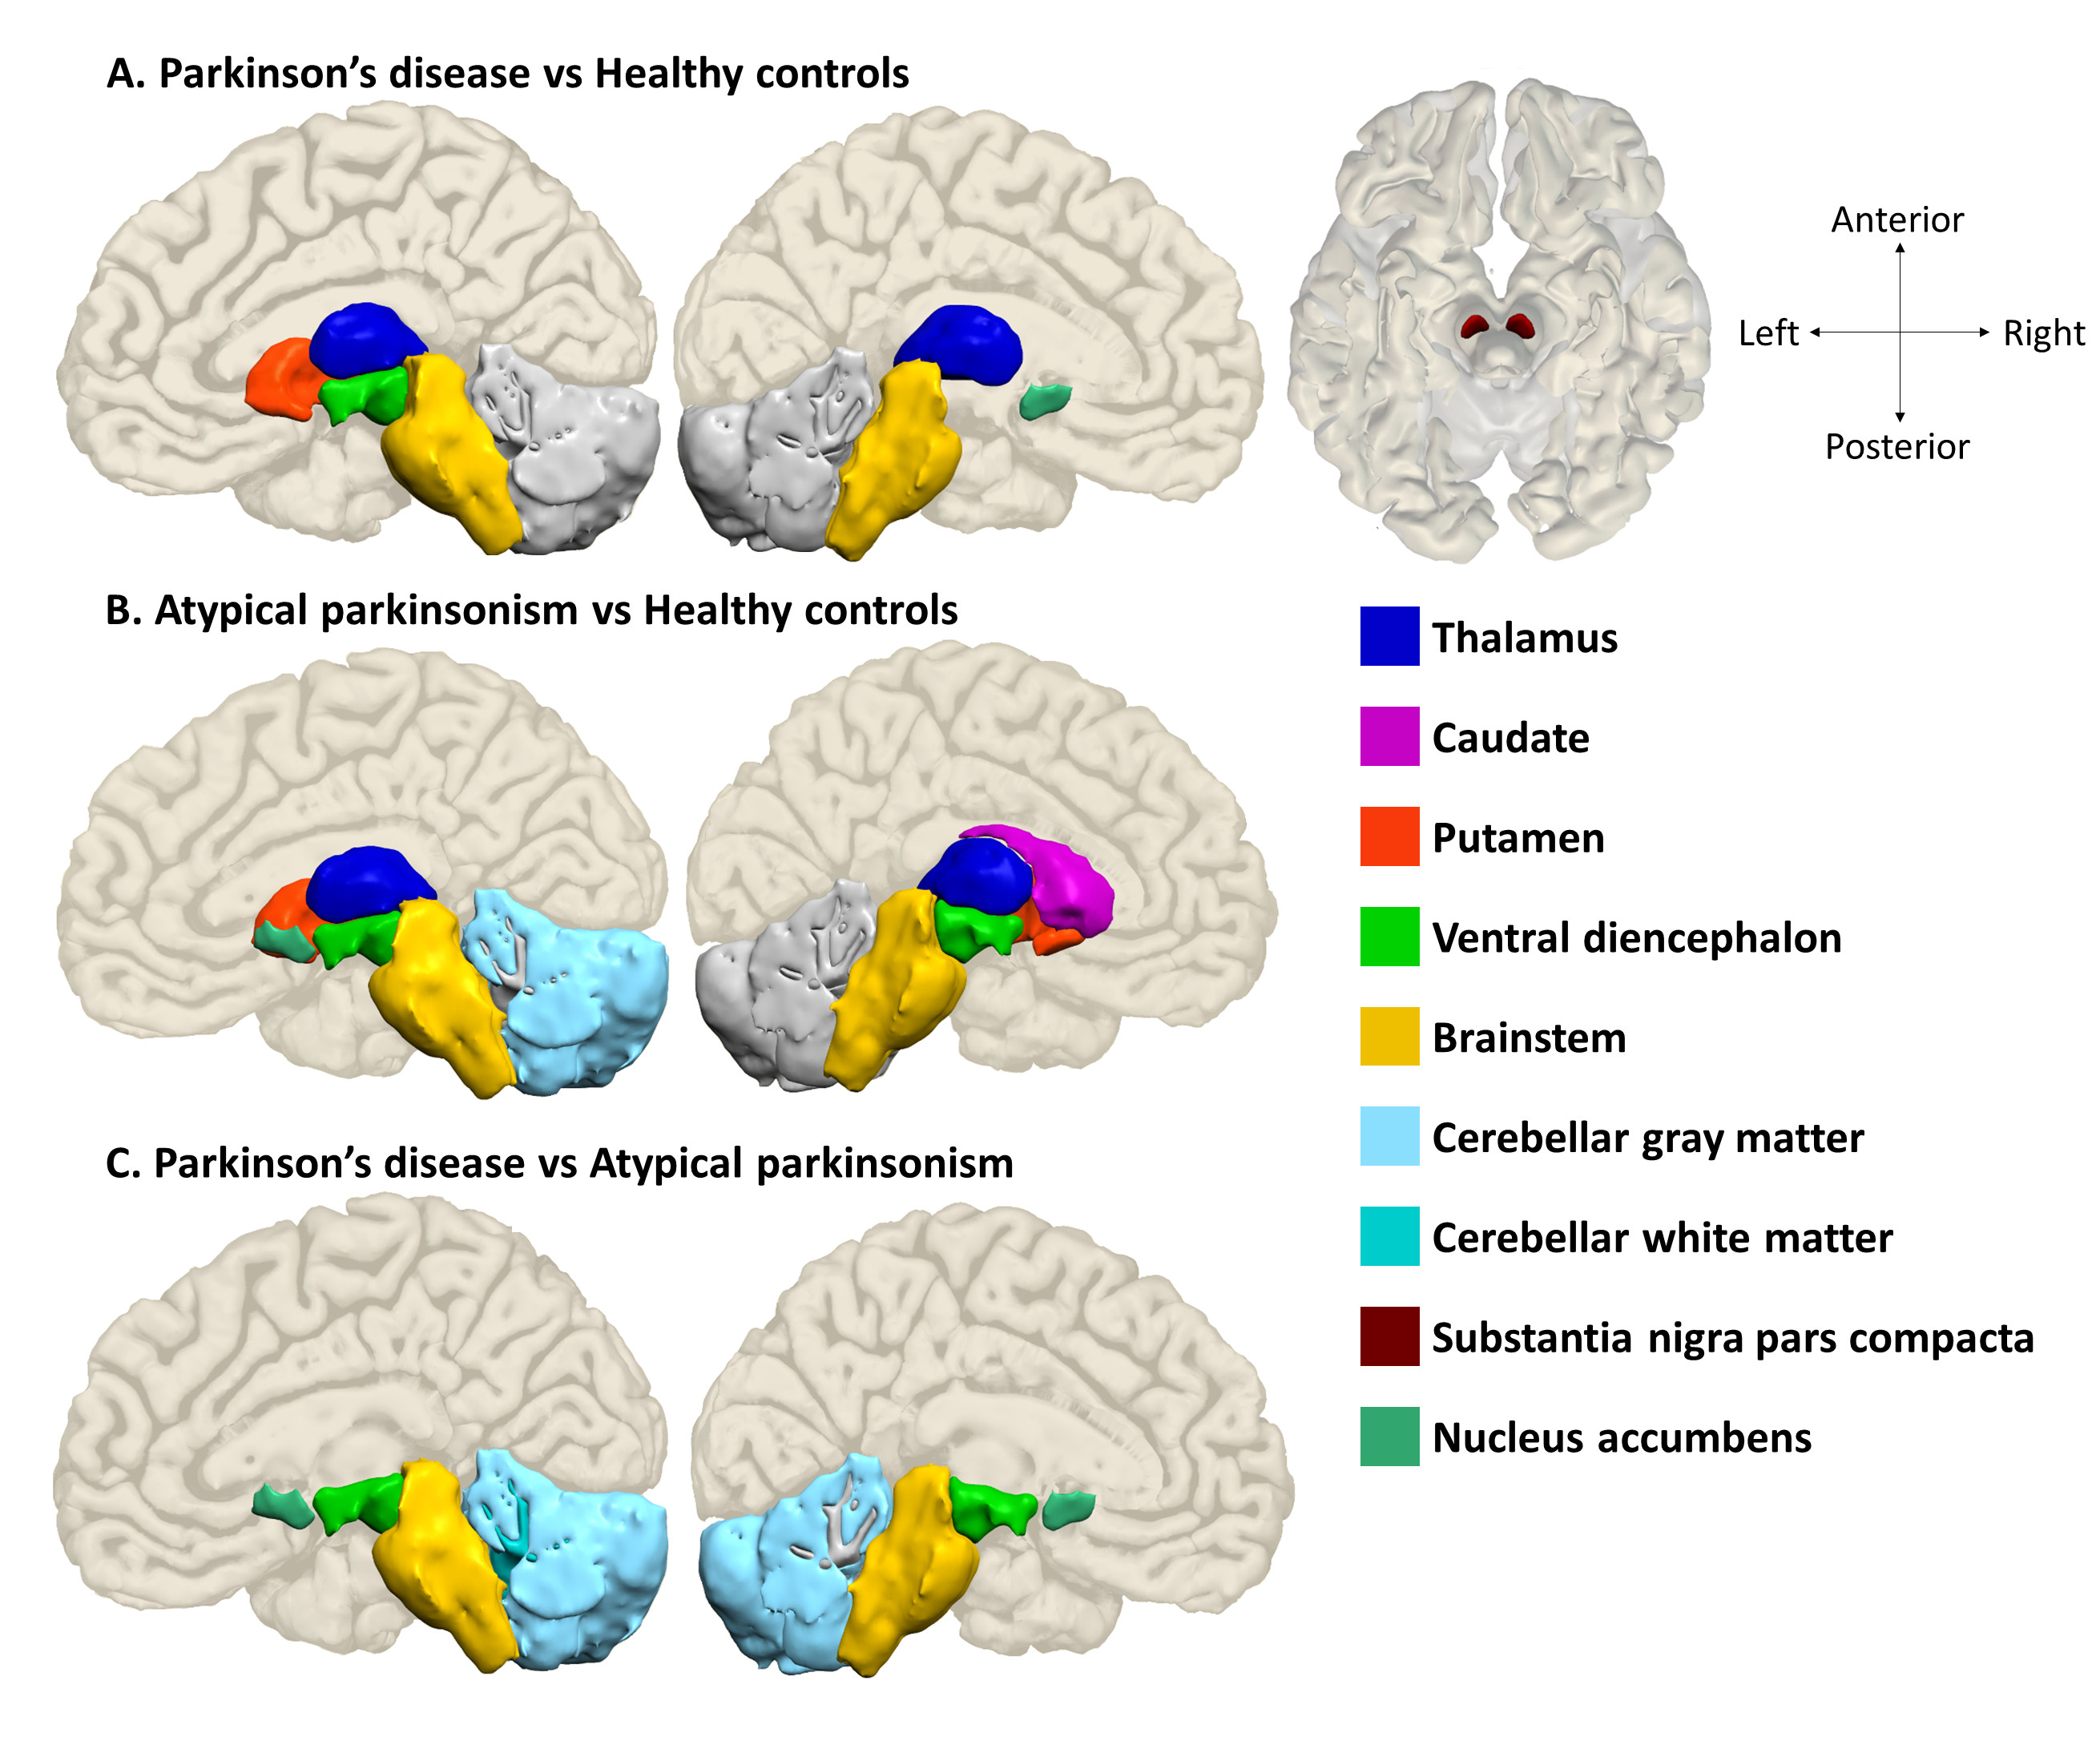
Regions of interest from where the most important features were
extracted
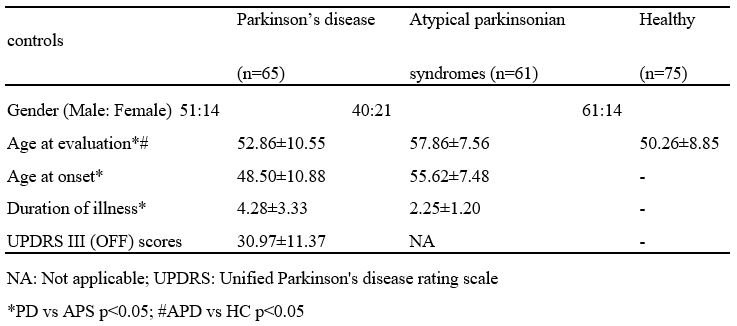
Demographic and clinical details of patients with Parkinson’s disease,
atypical parkinsonian syndromes and healthy controls
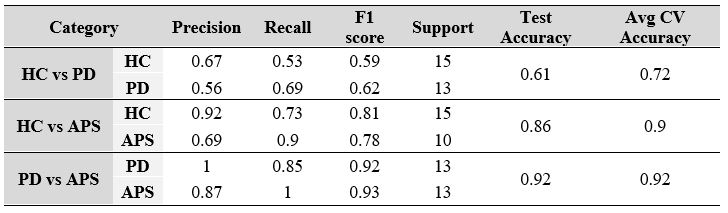
Classification results based on T1 radiomics