3267
4D flow MRI hemodynamic quantification of pediatric patients with multi-site, multi-vender, and multi-channel machine learning segmentation
Takashi Fujiwara1, Haben Berhane2,3, Michael Baran Scott3, Zachary King2, Michal Schafer4, Brian Fonseca4, Joshua Robinson3, Cynthia Rigsby2,3, Lorna Browne4, Michael Markl3, and Alex Barker1,5
1Department of Radiology, Children's Hospital Colorado, University of Colorado Anschutz Medical Campus, Aurora, CO, United States, 2Lurie Children's Hospital of Chicago, Chicago, IL, United States, 3Northwestern University, Evanston, IL, United States, 4Children's Hospital Colorado, University of Colorado Anschutz Medical Campus, Aurora, CO, United States, 5Department of Bioengineering, University of Colorado Anschutz Medical Campus, Aurora, CO, United States
1Department of Radiology, Children's Hospital Colorado, University of Colorado Anschutz Medical Campus, Aurora, CO, United States, 2Lurie Children's Hospital of Chicago, Chicago, IL, United States, 3Northwestern University, Evanston, IL, United States, 4Children's Hospital Colorado, University of Colorado Anschutz Medical Campus, Aurora, CO, United States, 5Department of Bioengineering, University of Colorado Anschutz Medical Campus, Aurora, CO, United States
Synopsis
A convolutional neural network (CNN) is presented to quantify 4D flow MRI-based hemodynamics using automated segmentation of the proximal vasculature. The intent is to reduce time and user variability for cumbersome 4D flow MRI analyses; however, the pediatric setting is challenging given the complex arterial geometry often seen in congenital heart diseases. Multi-site and -vender datasets were used to train a CNN for 3D segmentation. Flow quantification was conducted with the automated segmentations to test if datasets from multiple institutions and vendors improves flow quantification. We found the multi-site approach improved flow measurements in the setting of complex disease.
Introduction
4D Flow MRI is a promising tool to quantify the complex hemodynamics occurring in the presence of pediatric congenital heart disease. For accurate flow quantification, precise identification of target arteries is important. 3D vessel segmentation is time-consuming and cumbersome work requiring more than 20 minutes for proximal systemic and pulmonary artery (PA) identification. Recently, convolutional neural networks (CNN) for automated segmentation have been developed for adults and children1,2. However, complex congenital diseases such as hypoplastic left heart syndrome (HLHS) often have complex geometries, which makes it difficult for the CNN to output accurate segmentations without numerous training datasets. The number of such complex cases is generally not large enough to train the network at a single institution. We hypothesize that training the CNN with multi-site, multi-vender datasets may improve performance both for overall data and for complex cases because of increased number of complex cases from both sites for training. We quantified aortic and pulmonary flow using CNN-based segmentation to investigate its accuracy compared to human measurements.Methods
Whole-heart 4D flow MRI of healthy volunteers and patients from two pediatric institutions, 100 from Children’s Hospital Colorado (institution1: Philips scanners) and 74 from Lurie Children Hospital in Chicago (institution2: Siemens scanners), was included (Table 1). Figure 1 shows the study workflow. The proximal aorta and PA were manually segmented based on the phase-contrast magnetic resonance angiography (PC-MRA) by a trained person from each site, with consensus agreement regarding the segmentation criteria of the proximal, distal boundaries of the arteries and arterial wall boundary. Using the manual segmentation, a 3D dense U-net1,2 was trained to derive automated segmentations of both arteries (multi-channel segmentation). In the training phase, a PC-MRA was input to train CNN using manual segmentation as gold standard. In the inference phase, a PC-MRA was input to the CNN to derive an auto-segmentation. Here, the CNN was trained in three ways: using each single-site data (institution1 CNN and institution2 CNN) and using the combined data (multi-site CNN). The performance of each CNN was evaluated by 10-fold cross validation. Net flow was quantified in the ascending aorta (Qs) and main pulmonary artery (MPA, Qp) using identical centerline and planes for human and CNN segmentations, defined at the ascending aorta and main pulmonary trunk of the manual segmentation. To minimize measurement noise, the average of three adjacent planes (2mm spacing) was used for each flow analysis.Results
For the institution1 datasets: 2 patients had bad data quality and 6 patients did not have PA due to Fontan circulation, so those with Fontan circulation were employed only for Qs quantification. Therefore 98 aortas and 92 PAs were employed for flow quantification. All institution2 datasets were used and there were no Fontan patients. Table 2 shows median Dice scores of all data and specific disease subgroups. Overall, automated segmentation was improved by multi-site training, showing median Dice scores around 0.9. This score was also better than median interobserver Dice score between two observers (0.87 for the aorta, 0.85 for the PA; computed with 40 arbitrary subjects). Figure 2 shows Bland-Altman plots for Qs and Qp quantification. Bias was less than 1 mL/cycle for both Qs and Qp using multi-site training. In addition, the limits of agreement were improved compared to site1 CNN (Qs) and site2 CNN (Qp). Notably, Qs quantification for HLHS s.p. Fontan patients was improved by multi-site CNN (median differences between manual and CNN: 9.45ml/cycle in site1 CNN vs. 1.37ml/cycle in multi-site CNN). Figure 3 shows segmentations of ‘successful’ and ‘failed’ (differences ≥ 10ml/cycle) flow quantifications. Failure was mainly because CNN misrecognized and/or omitted the vessel at the measurement position (n=20).Discussion
Multi-vendor and -site machine learning is challenging given the inherent variation in tissue, vessel contrast and quality. Here, multi-site CNN segmentations presented robust performance in flow quantification with limits of agreement around 10 ml/cycle for both arteries even given the additional variety of vessel geometry seen in the pediatric setting. It is reasonable that the larger datasets from multi-site CNN showed better performance since generally larger number of datasets improves the performance of the CNN; however, vendor differences in contrast and noise can confound CNN performance, thus these results are encouraging. It is also known that CNN has difficulty handling edge cases, especially those with rare complex vessel geometry. Interestingly, flow quantification in HLHS patients was improved by adding institution2 datasets, although datasets from institution2 did not include HLHS patients. We observed failed quantification even with multi-site CNN training, particularly for very small patients due to small vessel size. We anticipate this could be improved by increasing the number of small patients.Conclusion
We demonstrated that multi-site CNN segmentation can be performed for flow quantification, enabling rapid flow quantification in the pediatric setting. The use of multi-site and -vendor datasets improves CNN segmentation for difficult cases as well as overall performance.Acknowledgements
No acknowledgement found.References
[1] Berhane H, Scott M, Elbaz M, Javis K, McCarthy P, Carr J, Malaisrie C, Avery R, Barker AJ, Robinson JD, Rigsby C, and Markl M. Fully automated 3D aortic segmentation of 4D flow MRI for hemodynamic analysis using deep learning. Magn Reson Med. 2020;84(4). [2] Fujiwara T, Berhane H, Scott M, Schafer M, Fonseca B, Robinson J, Rigsby C, Browne L, Markl M, Barker AJ. Hemodynamic Analysis with Fully Automated Multivendor and Multisite Artificial Intelligence-based 3D Segmentation of the Proximal Arteries from 4D flow MRI, 2020. Society for Magnetic Resonance Angiography 2020 Annual meeting.Figures
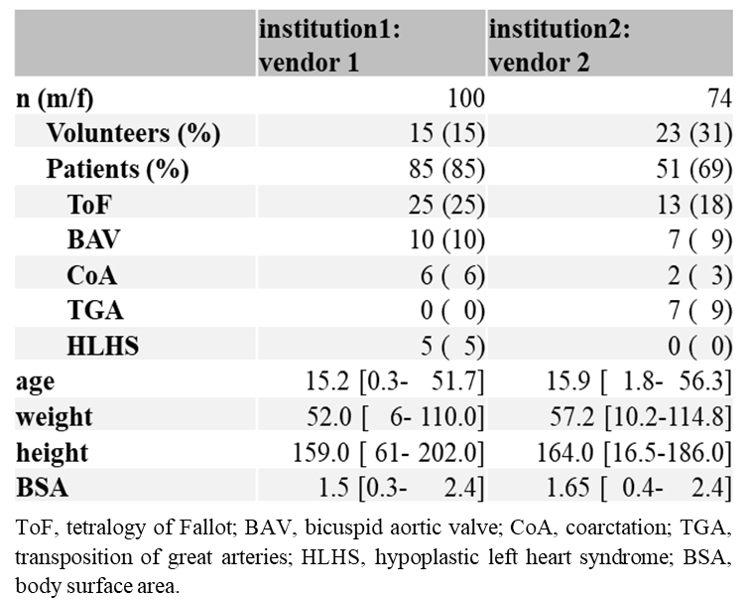
Table 1 Patient
demographics.
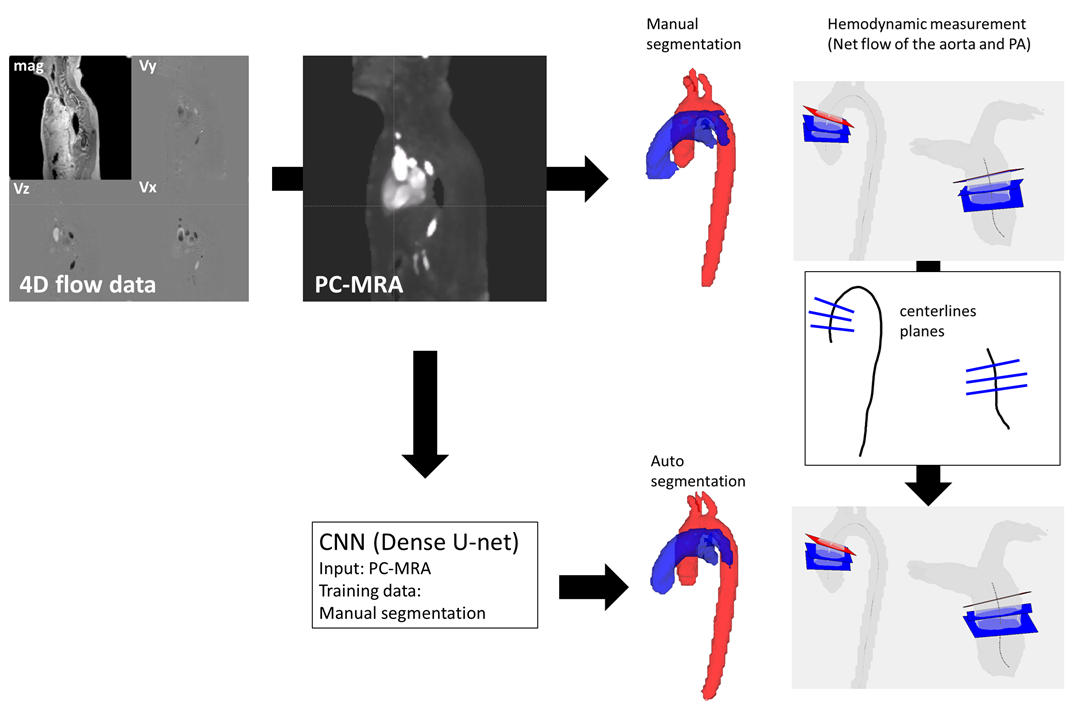
Fig. 1 Workflow for hemodynamic quantification. 4D
flow data was pre-processed to get PC-MRA. Aorta and pulmonary arteries were
manually segmented on PC-MRA. The convolutional neural network (CNN) was
trained based on manual segmentations. Centerlines were calculated and three
planes were manually defined at the ascending aorta and main pulmonary trunk of
the manual segmentation to compute averaged net flow of the aorta and pulmonary
arteries (PA). The defined centerlines and planes from manual analysis were
used for quantification with CNN segmentation.
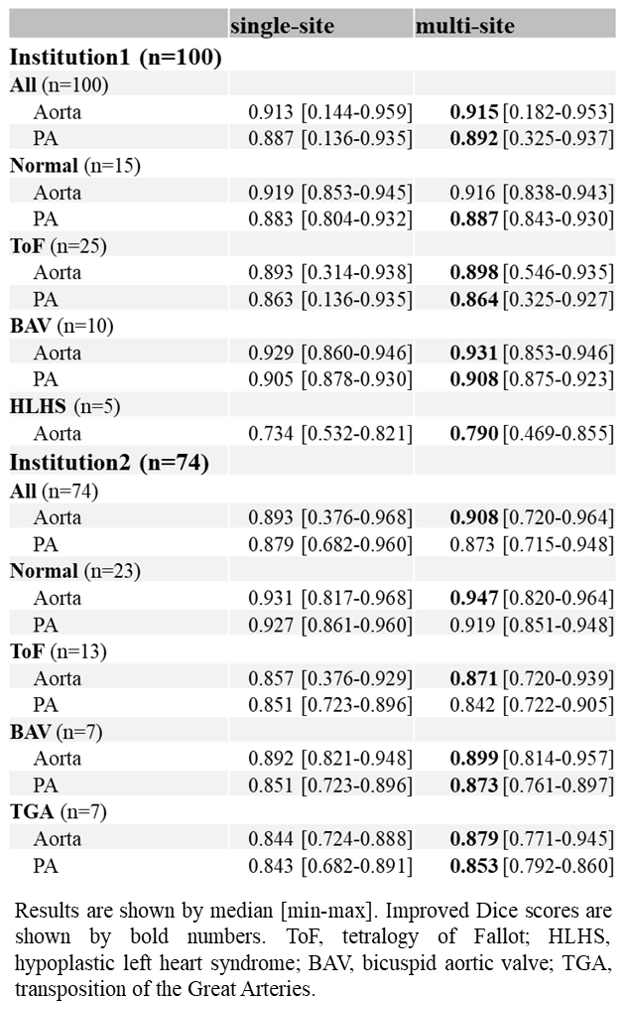
Table 2 Dice scores from single- and multi-site CNN.
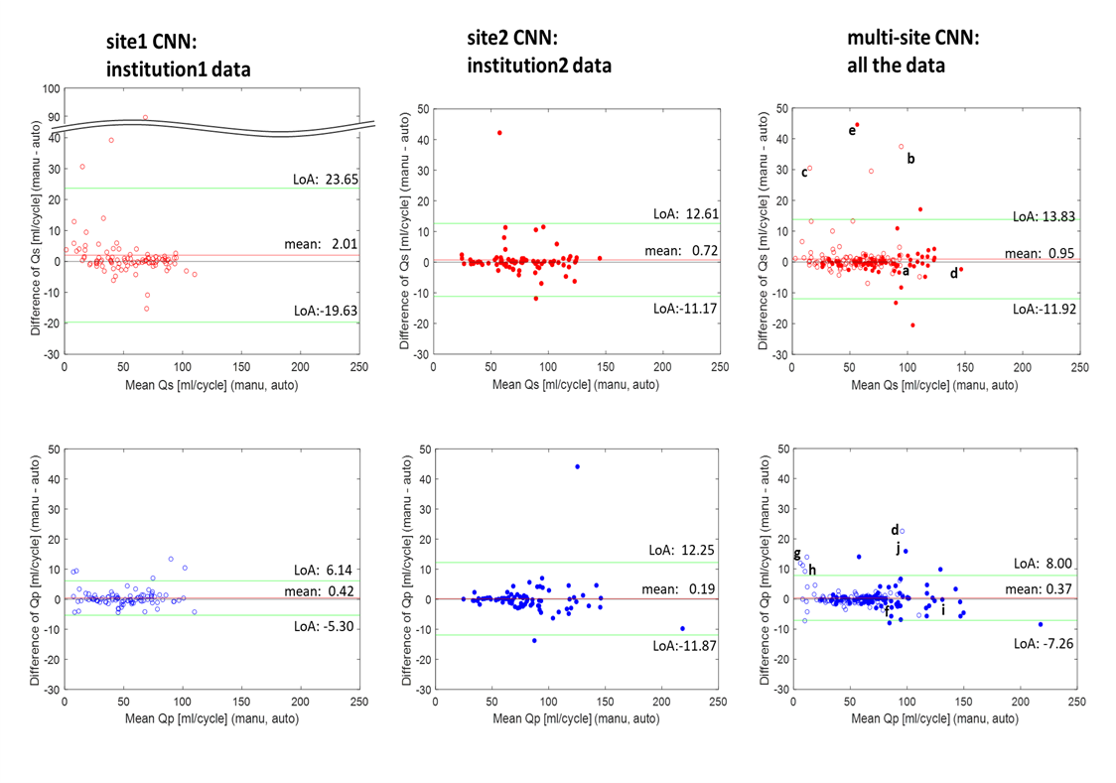
Fig. 2
Bland-Altman plots for net flow in the ascending aorta (Qs, upper row) and main pulmonary trunk (Qp, lower row) quantified by site1 CNN,
site2 CNN, and multi-site CNN. Institution1 data are plotted by open circles
while institution2 data are shown by solid circles. Limits of agreement and
mean differences are presented as green and red lines. The letter labels indicate
successful and failed (differences ≥ 10ml/cycle) examples for flow
quantification. The labels correspond to the segmentations shown in Fig. 3.
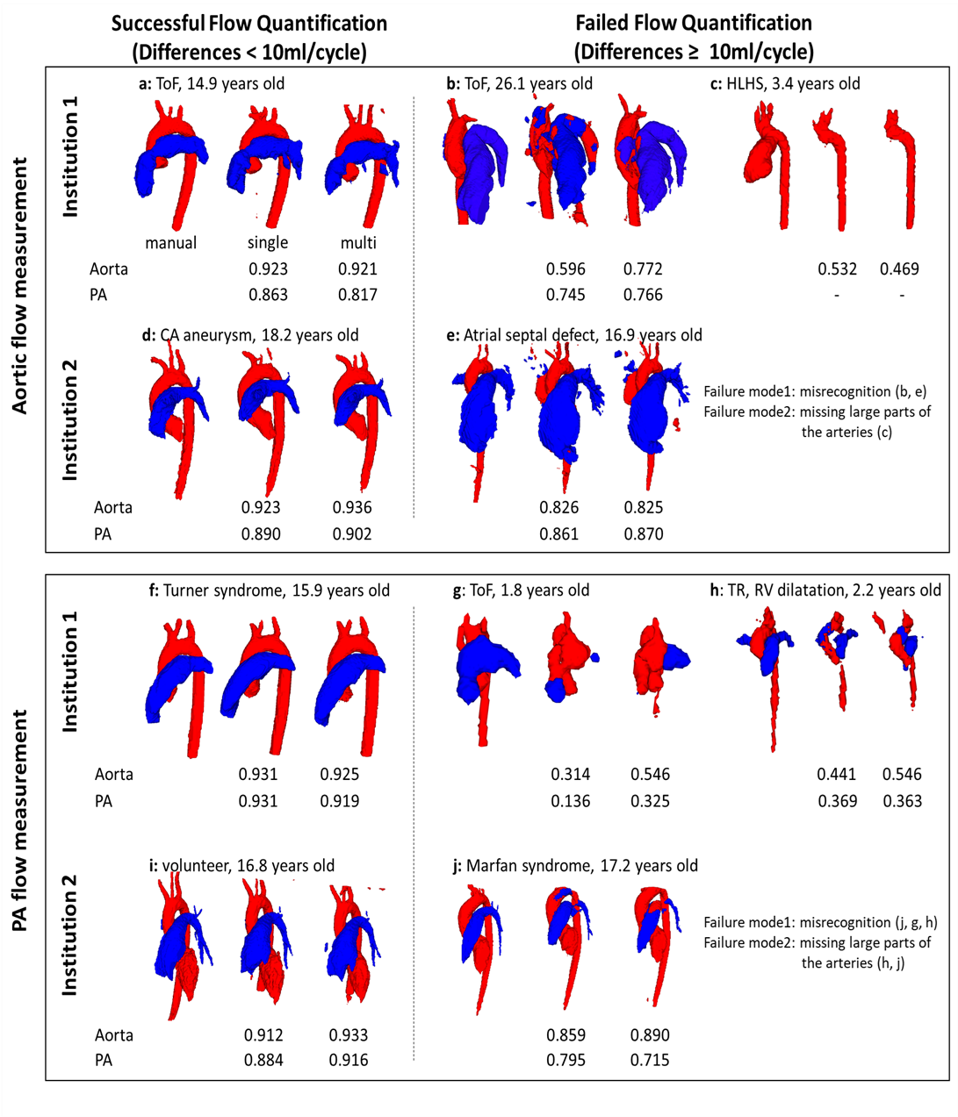
Fig. 3 Some examples of successful/failed
(differences ≥ 10ml/cycle) hemodynamic
measurements in multi-site training. Segmentations of aorta (red) and pulmonary
arteries (PA, blue) from both single-site and multi-site CNN are presented with
Dice scores. The letters correspond to those in Fig. 2. ToF, tetralogy of Fallot; TR,
tricuspid regurgitation; HLHS, hypoplastic left heart syndrome.