3266
Distribution indices of QSM values in M1 enable to classify ALS patients and healthy controls
Mauro Costagli1,2, Graziella Donatelli3,4, Paolo Cecchi3,4, Gabriele Siciliano4,5, and Mirco Cosottini3,4,5
1University of Genova, Genova, Italy, 2IRCCS Stella Maris, Pisa, Italy, 3IMAGO 7 Research Foundation, Pisa, Italy, 4Azienda Ospedaliero Universitaria Pisana, Pisa, Italy, 5University of Pisa, Pisa, Italy
1University of Genova, Genova, Italy, 2IRCCS Stella Maris, Pisa, Italy, 3IMAGO 7 Research Foundation, Pisa, Italy, 4Azienda Ospedaliero Universitaria Pisana, Pisa, Italy, 5University of Pisa, Pisa, Italy
Synopsis
The Primary Motor Cortex (M1) in Amyotrophic Lateral Sclerosis (ALS) patients and healthy controls (HC) has a different appearance in Quantitative Susceptibility Mapping (QSM) images. The purpose of this study was to identify a set of distribution indices of QSM values in M1 that enable to better classify ALS patients and HC. Taken individually, the mean value, standard deviation, skewness and kurtosis of the QSM value distributions enabled to obtain diagnostic accuracies 0.43 < A < 0.78. When the distribution indices were jointly used in support vector machine (SVM) classifiers, it was possible to achieve a diagnostic accuracy of 0.90.
Introduction
The Primary Motor Cortex (M1) in patients with Amyotrophic Lateral Sclerosis (ALS) and in healthy controls (HC) has a different appearance, which can be appreciated in a variety of MRI techniques, including Quantitative Susceptibility Mapping (QSM)1,4. The purpose of this study was to identify a set of distribution indices of QSM values in M1 that could enable to better classify ALS patients and HC.Methods
51 ALS patients with definite or probable ALS5 and 10 HC were included in this study. The imaging protocol was performed on a 3T MR750 GE system and included a 3D Gradient Echo Multi Echo (SWAN) sequence with the following acquisition parameters: TR = 68.1 ms, TE1:ΔTE:TE16 = 13 : 3.4 : 64.4 ms; spatial resolution = 0.94 × 0.94 × 1 mm3. Magnitude and phase data were processed to generate QSM images for each subject6.Regions of Interest (ROI) representing M1 were obtained from the right and left Primary Motor Cortex of the Harvard Oxford Cortical Atlas and placed onto the QSM images of each subject via nonlinear registration (FNIRT in FSL7). ROIs were visually inspected by one neuroradiologist and, where necessary, they were manually corrected in order to include missing parts of M1 and exclude cortical regions that were erroneously included by the automatic pipeline.
The following distribution indices of QSM values in M1 were considered: mean value, standard deviation, skewness and kurtosis. These indices were calculated considering either all QSM values in the entire bilateral M1 ROIs of each patient (indicated by μ, σ, S and K, respectively) or only the positive QSM values within the ROI (μ+, σ+, S+, K+). The differences in the distribution indices between the two groups of subjects were assessed by Mann-Whitney U-test. A p-value p = 0.05 was set as a threshold for statistical significance. The diagnostic accuracy of each of these indices was assessed in terms of the Area Under the Receiver-Operating-Characteristic Curve (AUC).
To assess the diagnostic accuracy of each distribution index and all their possible combinations, $$$\sum_{c=1}^4\left(\begin{array}{c}4\\ c\end{array}\right)$$$ = 15 different classifiers were considered for each of the two ROI selection methods (i.e., either all QSM voxels, or only the positive QSM voxels in M1). Each classifier was trained 1000 times, each time by using pseudorandomly-chosen 45 patients and 9 HC, and tested on the left-out subjects (6 patients and 1 HC). Each classifier was evaluated on the basis of its diagnostic accuracy (A).
Results
Among the distribution indices of QSM values in the entire bilateral M1, σ and S were those that exhibited statistically significant differences between ALS patients and HC, in agreement with recent reports4. The AUC were 0.72 and 0.70 for σ and S, respectively. Interestingly, the smallest AUC was obtained with μ [Figure 1].When only the positive QSM values were considered, the differences between groups were statistically significant for all indices, and the AUC values improved (AUC = 0.76, 0.78, 0.70 and 0.76 for μ+, σ+, S+, K+, respectively) [Figure 2].
When QSM distribution indices were used individually in SVM classifiers, the parameter that enabled the best diagnostic accuracy was S+ (A = 0.76, first black bar on the left in Figure 3). The least informative feature was, again, μ (A = 0.43).
When the QSM distribution indices were jointly used in the SVM classification, the diagnostic accuracy increased, and it was higher in the cases when only the positive QSM values in the ROI were considered (Figure 3, black bars vs gray bars). When μ+, σ+, S+, K+ were jointly used, the diagnostic accuracy reached its maximum value A = 0.90 [fourth black bar on the right in Figure 3) with sensitivity = 0.89 and specificity = 1. Interestingly, in the analysis including all QSM voxels in M1 (light gray bars), the classification performance did not monotonously increase with the number of jointly used indices: when μ was added to the three-feature set composed by σ, S and K, the diagnostic accuracy slightly decreased from 0.77 (third gray bar) to 0.76 (fourth gray bar).
Conclusion
This study demonstrates that it is possible to achieve improved classification of ALS patients and HC by leveraging on the joint use of the distribution indices of QSM values in M1. We hypothesize that this approach could be proved successful in a wide range of clinical applications where diagnosis is based on a number of imaging biomarkers that are currently evaluated separately.Acknowledgements
This work has been partially supported by grants “RC 2018-2020” and “5 per mille” to IRCCS Fondazione Stella Maris, funded by the Italian Ministry of Health.References
- Costagli M, Donatelli G, Biagi L, Caldarazzo-Ienco E, Siciliano G, Tosetti M, and Cosottini M. Magnetic susceptibility in the deep layers of the primary motor cortex in Amyotrophic Lateral Sclerosis. NeuroImage: Clinical 2016; 12:965-969.
- Acosta-Cabronero J, Machts J, Schreiber S, Abdulla S, Kollewe K, Petri S, Spotorno N, Kaufmann J, Heinze HJ, Dengler R, Vielhaber S, and Nestor PJ. Quantitative Susceptibility MRI to Detect Brain Iron in Amyotrophic Lateral Sclerosis. Radiology 2018; 289(1):195-203.
- Welton T, Maller JJ, Lebel RM, Tan ET, Rowe DB, and Grieve SM. Diffusion kurtosis and quantitative susceptibility mapping MRI are sensitive to structural abnormalities in amyotrophic lateral sclerosis. NeuroImage: Clinical 2019; 24:101953.
- Contarino VE, Conte G, Morelli C, Trogu F, Scola E, Calloni SF, Sanmiguel Serpa LC, Liu C, Silani V, and Triulzi F. Toward a marker of upper motor neuron impairment in amyotrophic lateral sclerosis: A fully automatic investigation of the magnetic susceptibility in the precentral cortex. European Journal of Radiology 2020; 124:108815.
- Brooks BR, Miller RG, Swash M, Munsat TL, World Federation of Neurology Research Group on Motor Neuron Diseases. El Escorial revisited: revised criteria for the diagnosis of amyotrophic lateral sclerosis. Amyotrophic Lateral Sclerosis and Other Motor Neuron Disorders 2000; 1:293-299.
- Lancione M, Donatelli G, Cecchi P, Cosottini M, Tosetti M, and Costagli M. Echo-time dependency of quantitative susceptibility mapping reproducibility at different magnetic field strengths. NeuroImage 2019; 197:557-564.
- Jenkinson M, Beckmann CF, Behrens TEJ, Woolrich MW, and Smith SM. FSL. NeuroImage 2012; 62(2):782-790.
Figures
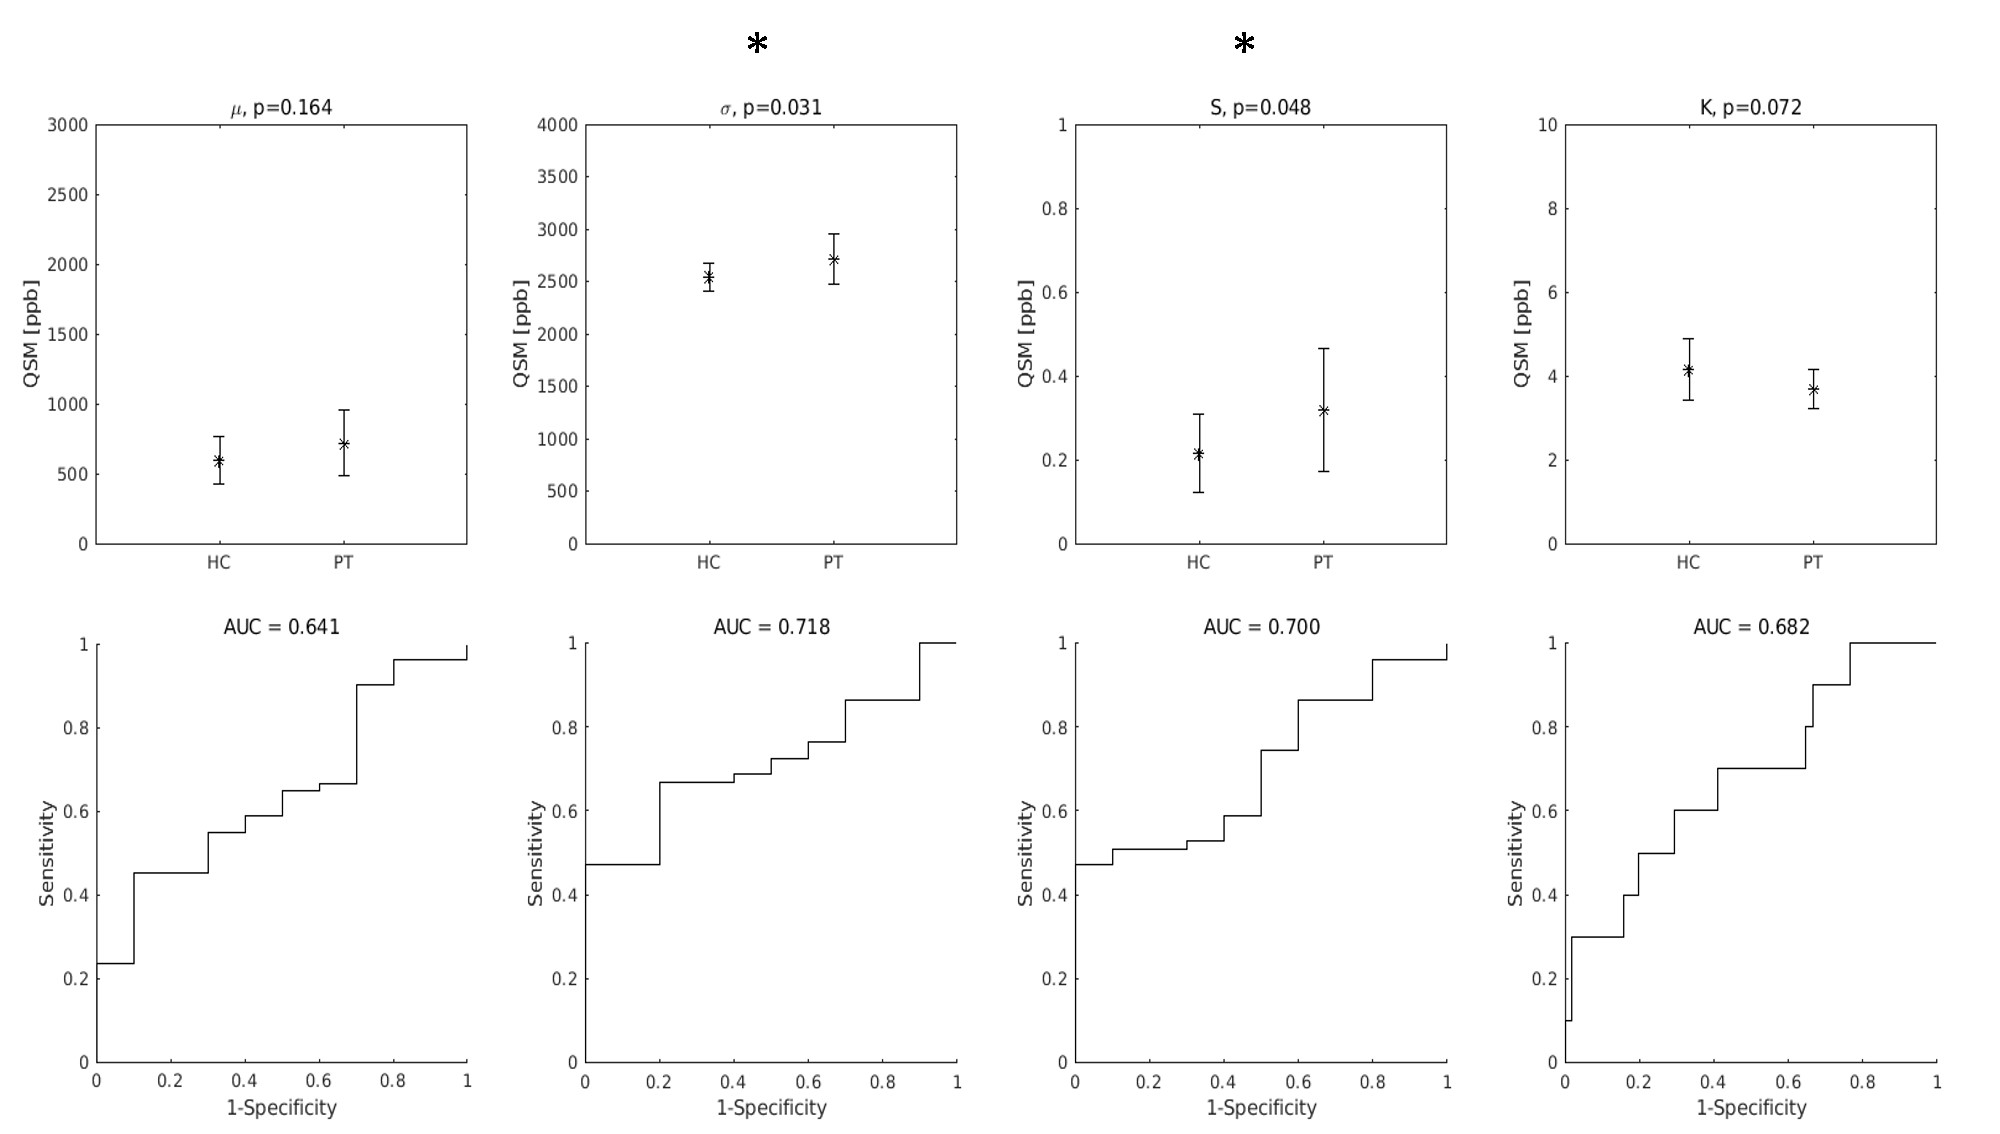
Top row: group differences in the distribution indices of M1 QSM values. Asterisks indicate statistically significant differences. Bottom row: diagnostic accuracy of each feature.
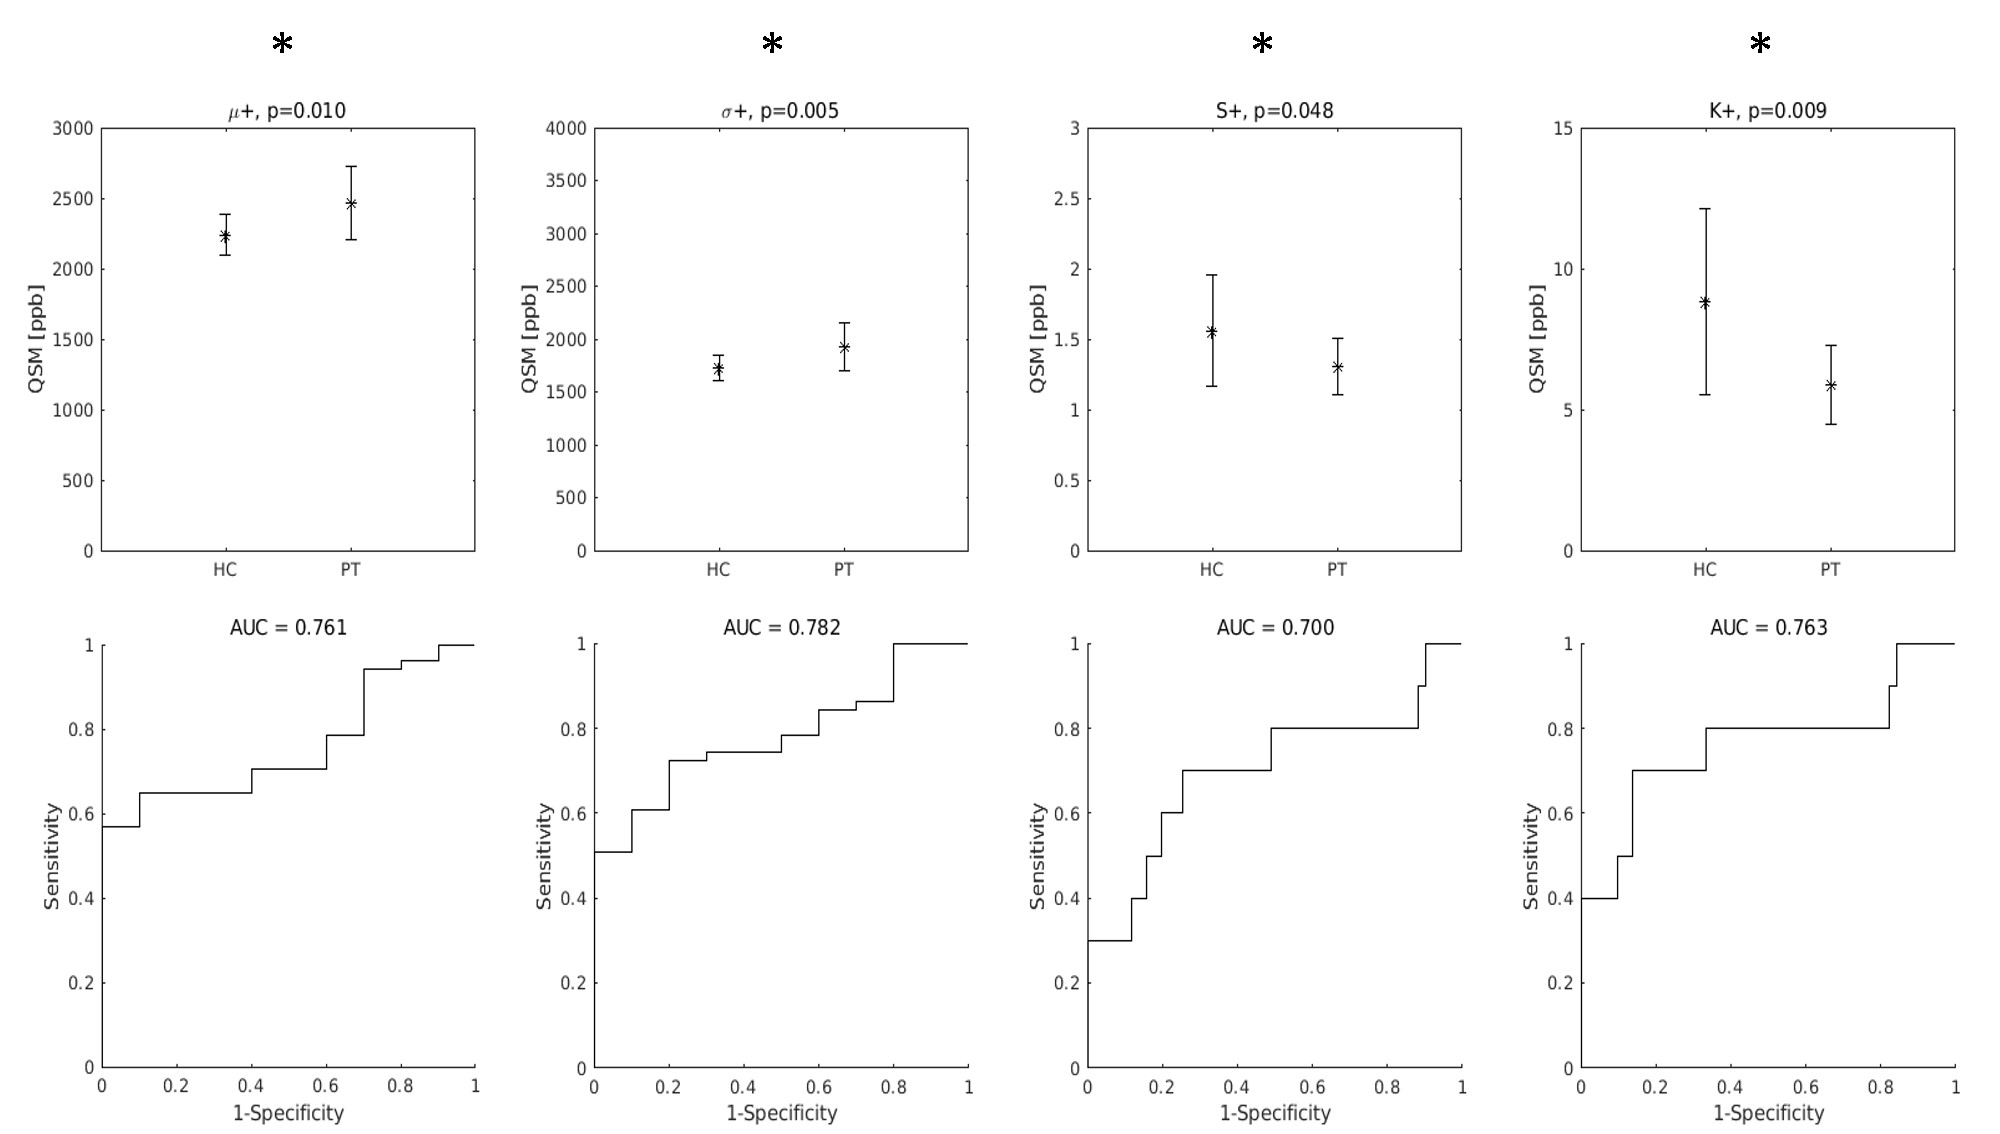
Top row: group differences in the distribution indices of M1 QSM positive values. Asterisks indicate that all differences were statistically significant. Bottom row: diagnostic accuracy of each feature.
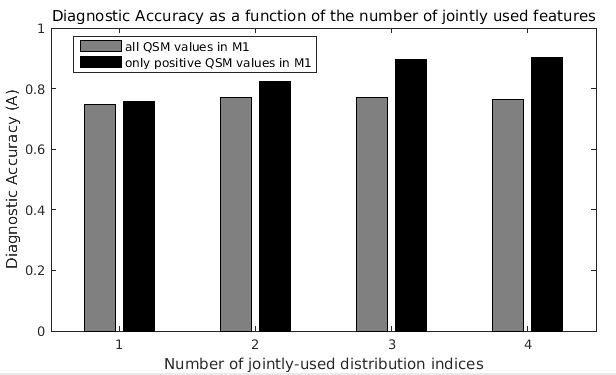
Maximum diagnostic accuracy of SVM classifiers as a function of the number of QSM distibution indices jointly considered. For example, the last black bar on the right indicates the maximum diagnostic accuracy (A = 0.90) obtained with the joint use of all four distribution indices of QSM positive values in M1.