3265
Stratifying ischaemic stroke patients across 3 treatment windows using T2 relaxation times, ordinal regression and cumulative probabilities1PRECISE4Q Predictive Modelling in Stroke, Information Communications and Entertainment Institute, Technological University Dublin, Dublin, Ireland, 2School of Psychological Science, University of Bristol, Bristol, United Kingdom, 3Stroke Neurology, North Bristol NHS Trust, Bristol, United Kingdom, 4Acute Stroke Programme, Radcliffe Department of Medicine, University of Oxford, Oxford, United Kingdom, 5Institue of Neuroscience and Psychology, University of Glasgow, Glasgow, United Kingdom, 6Faculty of Engineering, University of Bristol, Bristol, United Kingdom
Synopsis
Unknown onset time is a common contraindication for anti-thrombolytic treatment of ischaemic stroke.T2 relaxation-based signal changes within the lesion can identify patients within or beyond the 4.5-hour intravenous thrombolysis treatment-window. However, now that intra-arterial thrombolysis is recommended between 4.5 and 6 hours from symptom onset and mechanical thrombectomy is considered safe between 6 and 24 hours, there are three treatment-windows to consider. Here we show a cumulative ordinal regression model, incorporating the T2 relaxation time, predicts the probabilities of a patient being within one of the three treatment-windows and is more accurate than signal intensity changes from T2 weighted images.
Introduction
Hyperacute ischaemic stroke patients with unknown onset time are ineligible for intravenous (IV) and intra-arterial (IA) thrombolytic therapies.1 Previous MRI studies identified patients within the 4.5-hour IV treatment-window 2–5 and 6-hour IA treatment-window6 based on changes in image intensities caused by ischaemia. However, these studies approached unknown onset time as a binary classification problem, where a patient is within or beyond a specific treatment-window. Now that mechanical thrombectomy (MT) is considered safe between 6 and 24 in patients with large vessel occlusion7 there are three time-windows to stratify patients within (IV < 4.5 hours, IA 4.5-6 hours, MT 6 – 24 hours). Ordinal regression may be a suitable solution as it is recommended for classification problems with three or more naturally ordered categories and where misclassification errors are unequal.8 Here we, a) examined whether logistic ordinal regression9 applied to image intensity ratios from ADC, DWI, T2 weighted (T2W), and T2 relaxation time images can stratify patients into the three time-windows and b) compared the efficacy of these parameters on the task.Methods
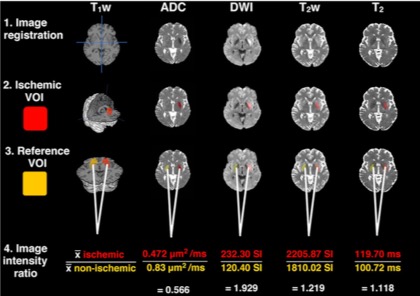
MRI: Thirty-five ischaemic stroke patients with onset time < 9 hours were scanned at 3T with a 32-channel head coil. MRI protocol included DWI for ADC maps and localisation of ischaemia, 3DT1 weighted (T1W) for anatomical reference and co-registration and multi-echo T2 for T2 relaxation time maps and echo-summed T2W images.2 Image intensity ratios indicating a change in signal due to ischaemia were calculated (Figure 1).2Data Analysis: Image intensity ratios were standardised using the Agresti method11 to account for different magnitudes of change over time between the ratios,2 and to make coefficients comparable across features.11 Based on onset times, patients were divided into classes corresponding to treatment-windows of < 4.5 hours for IV thrombolysis (n = 16), 4.5 – 6 hours for IA thrombolysis (n = 5) and 6 – 9 hours for MT (n = 14). Ordinal logistic regression models9 were created for different combinations of image intensity ratios, including univariate models for ADC, DWI, T2W and T2 relaxation time ratios and multivariate models that combined diffusion and T2-based ratios. For each combination of features, we created one multivariate model based on a simple linear combination of the features and an extended version that included an interaction term between input features.
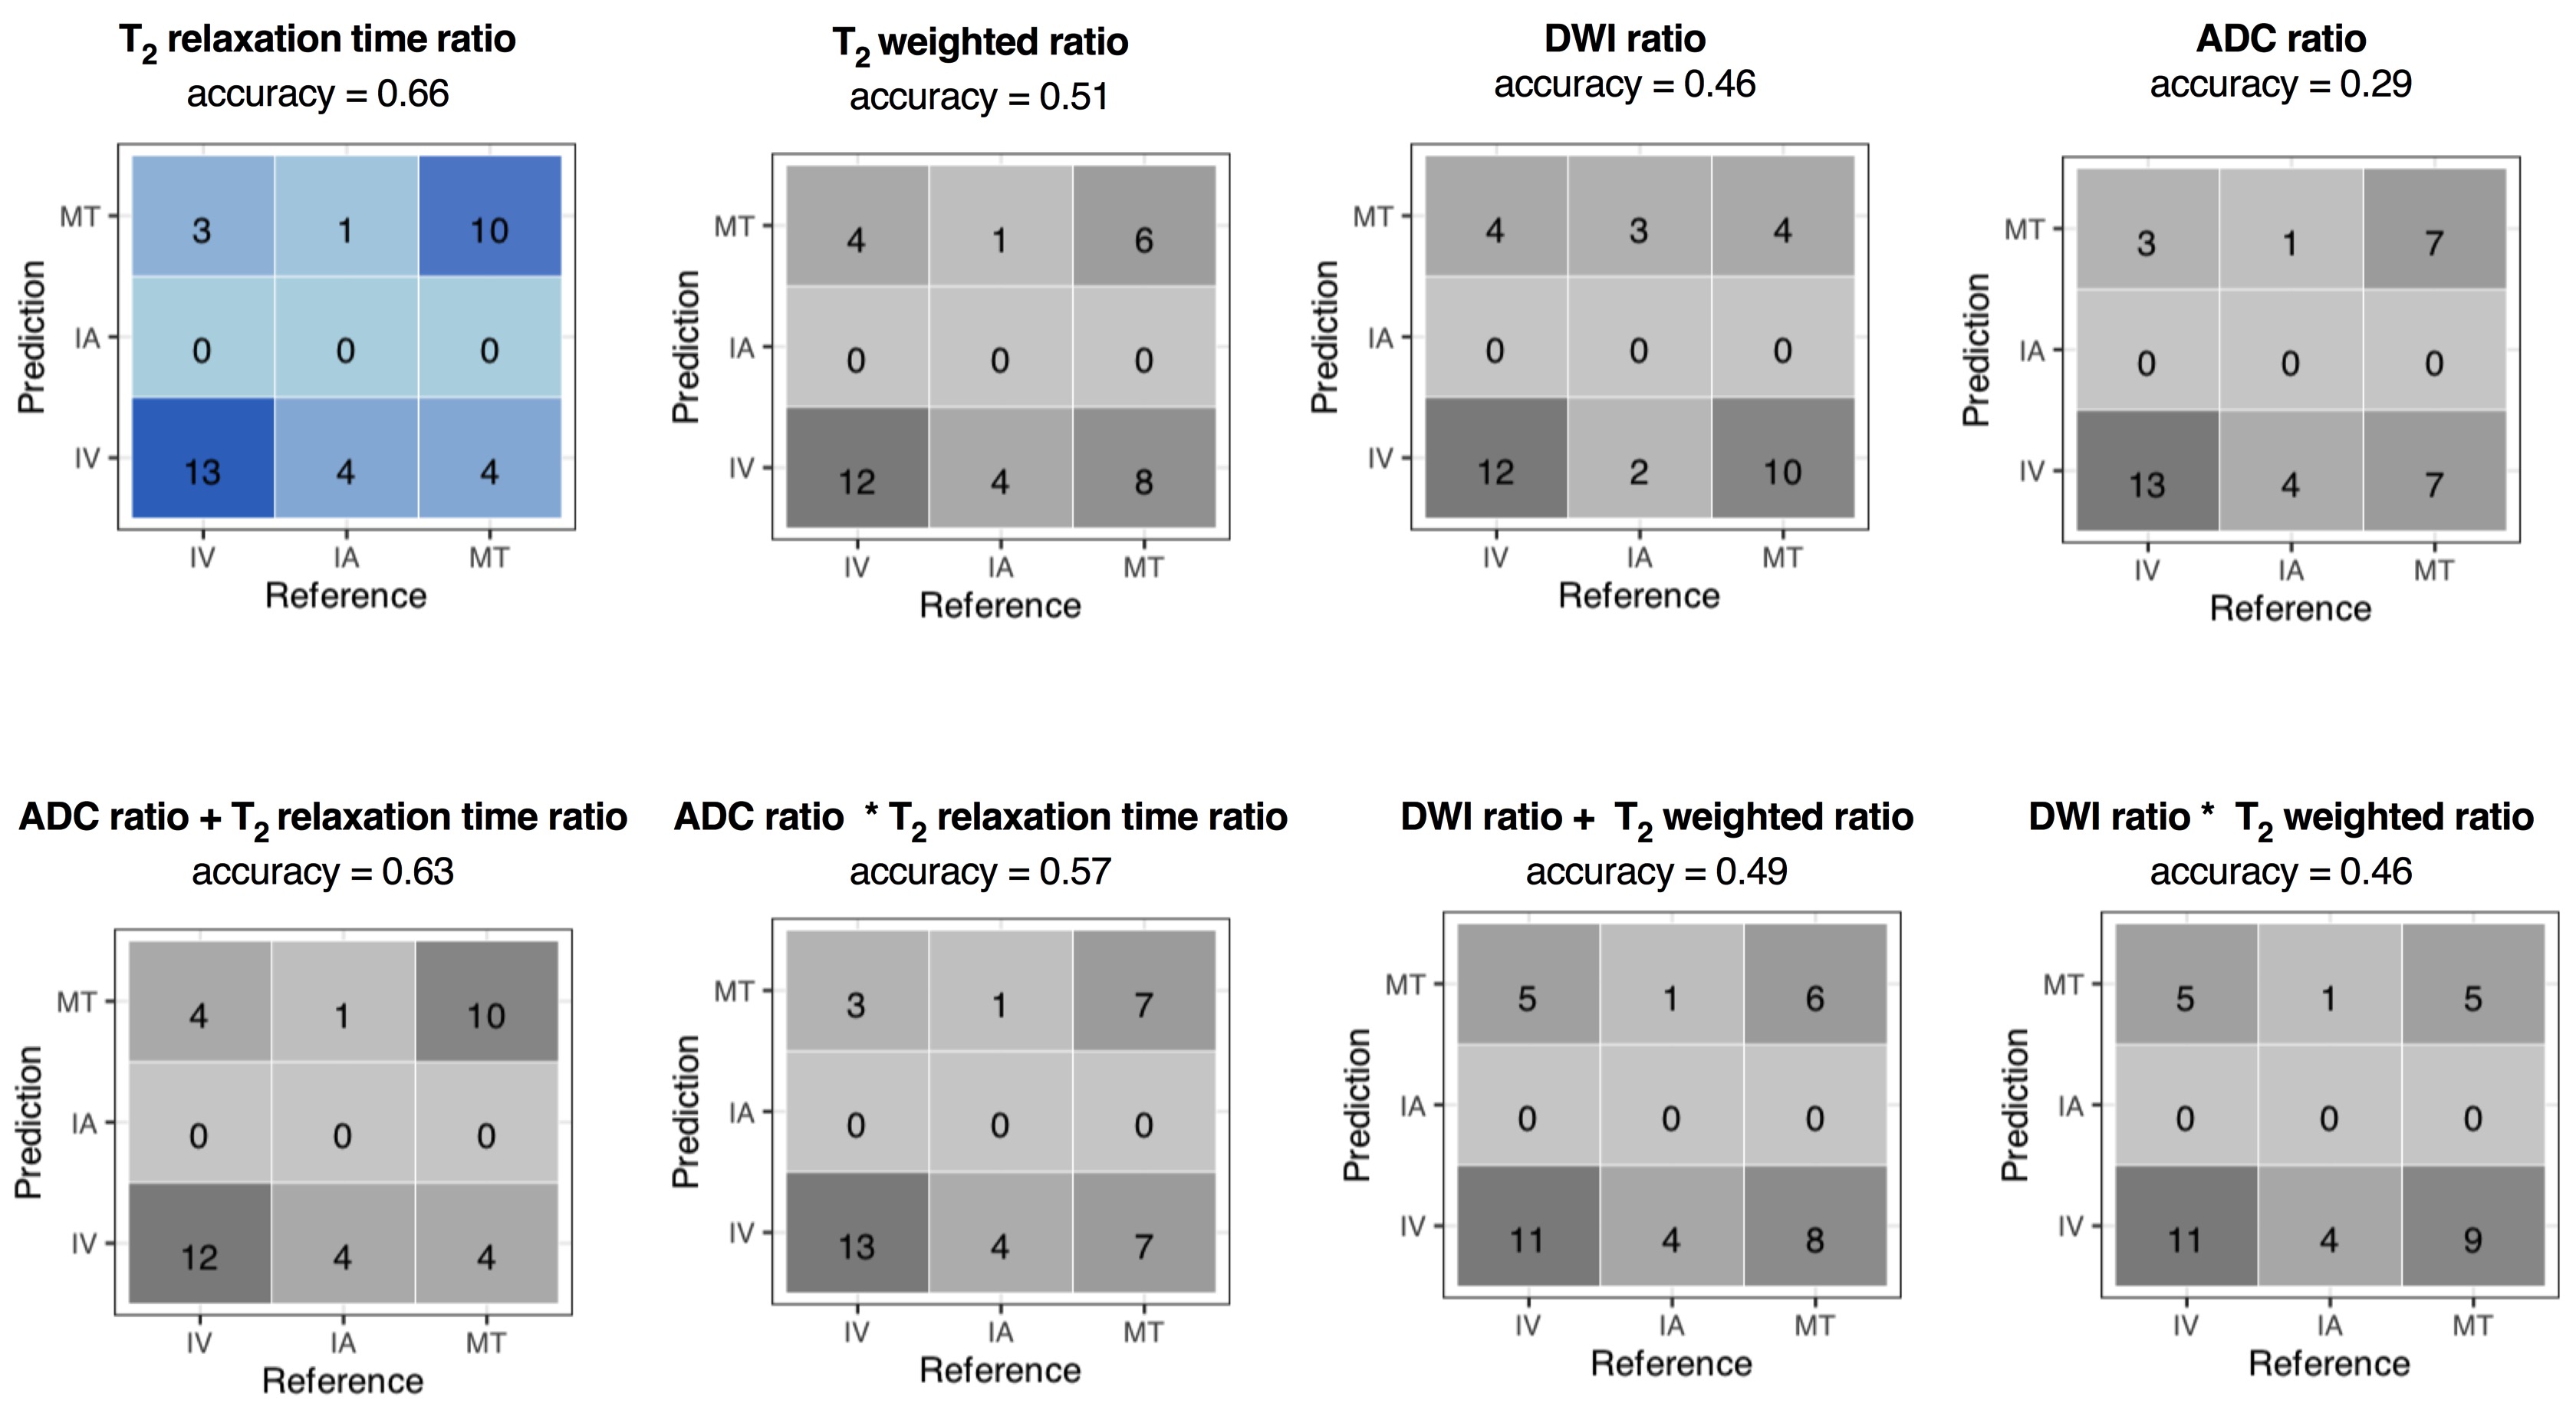
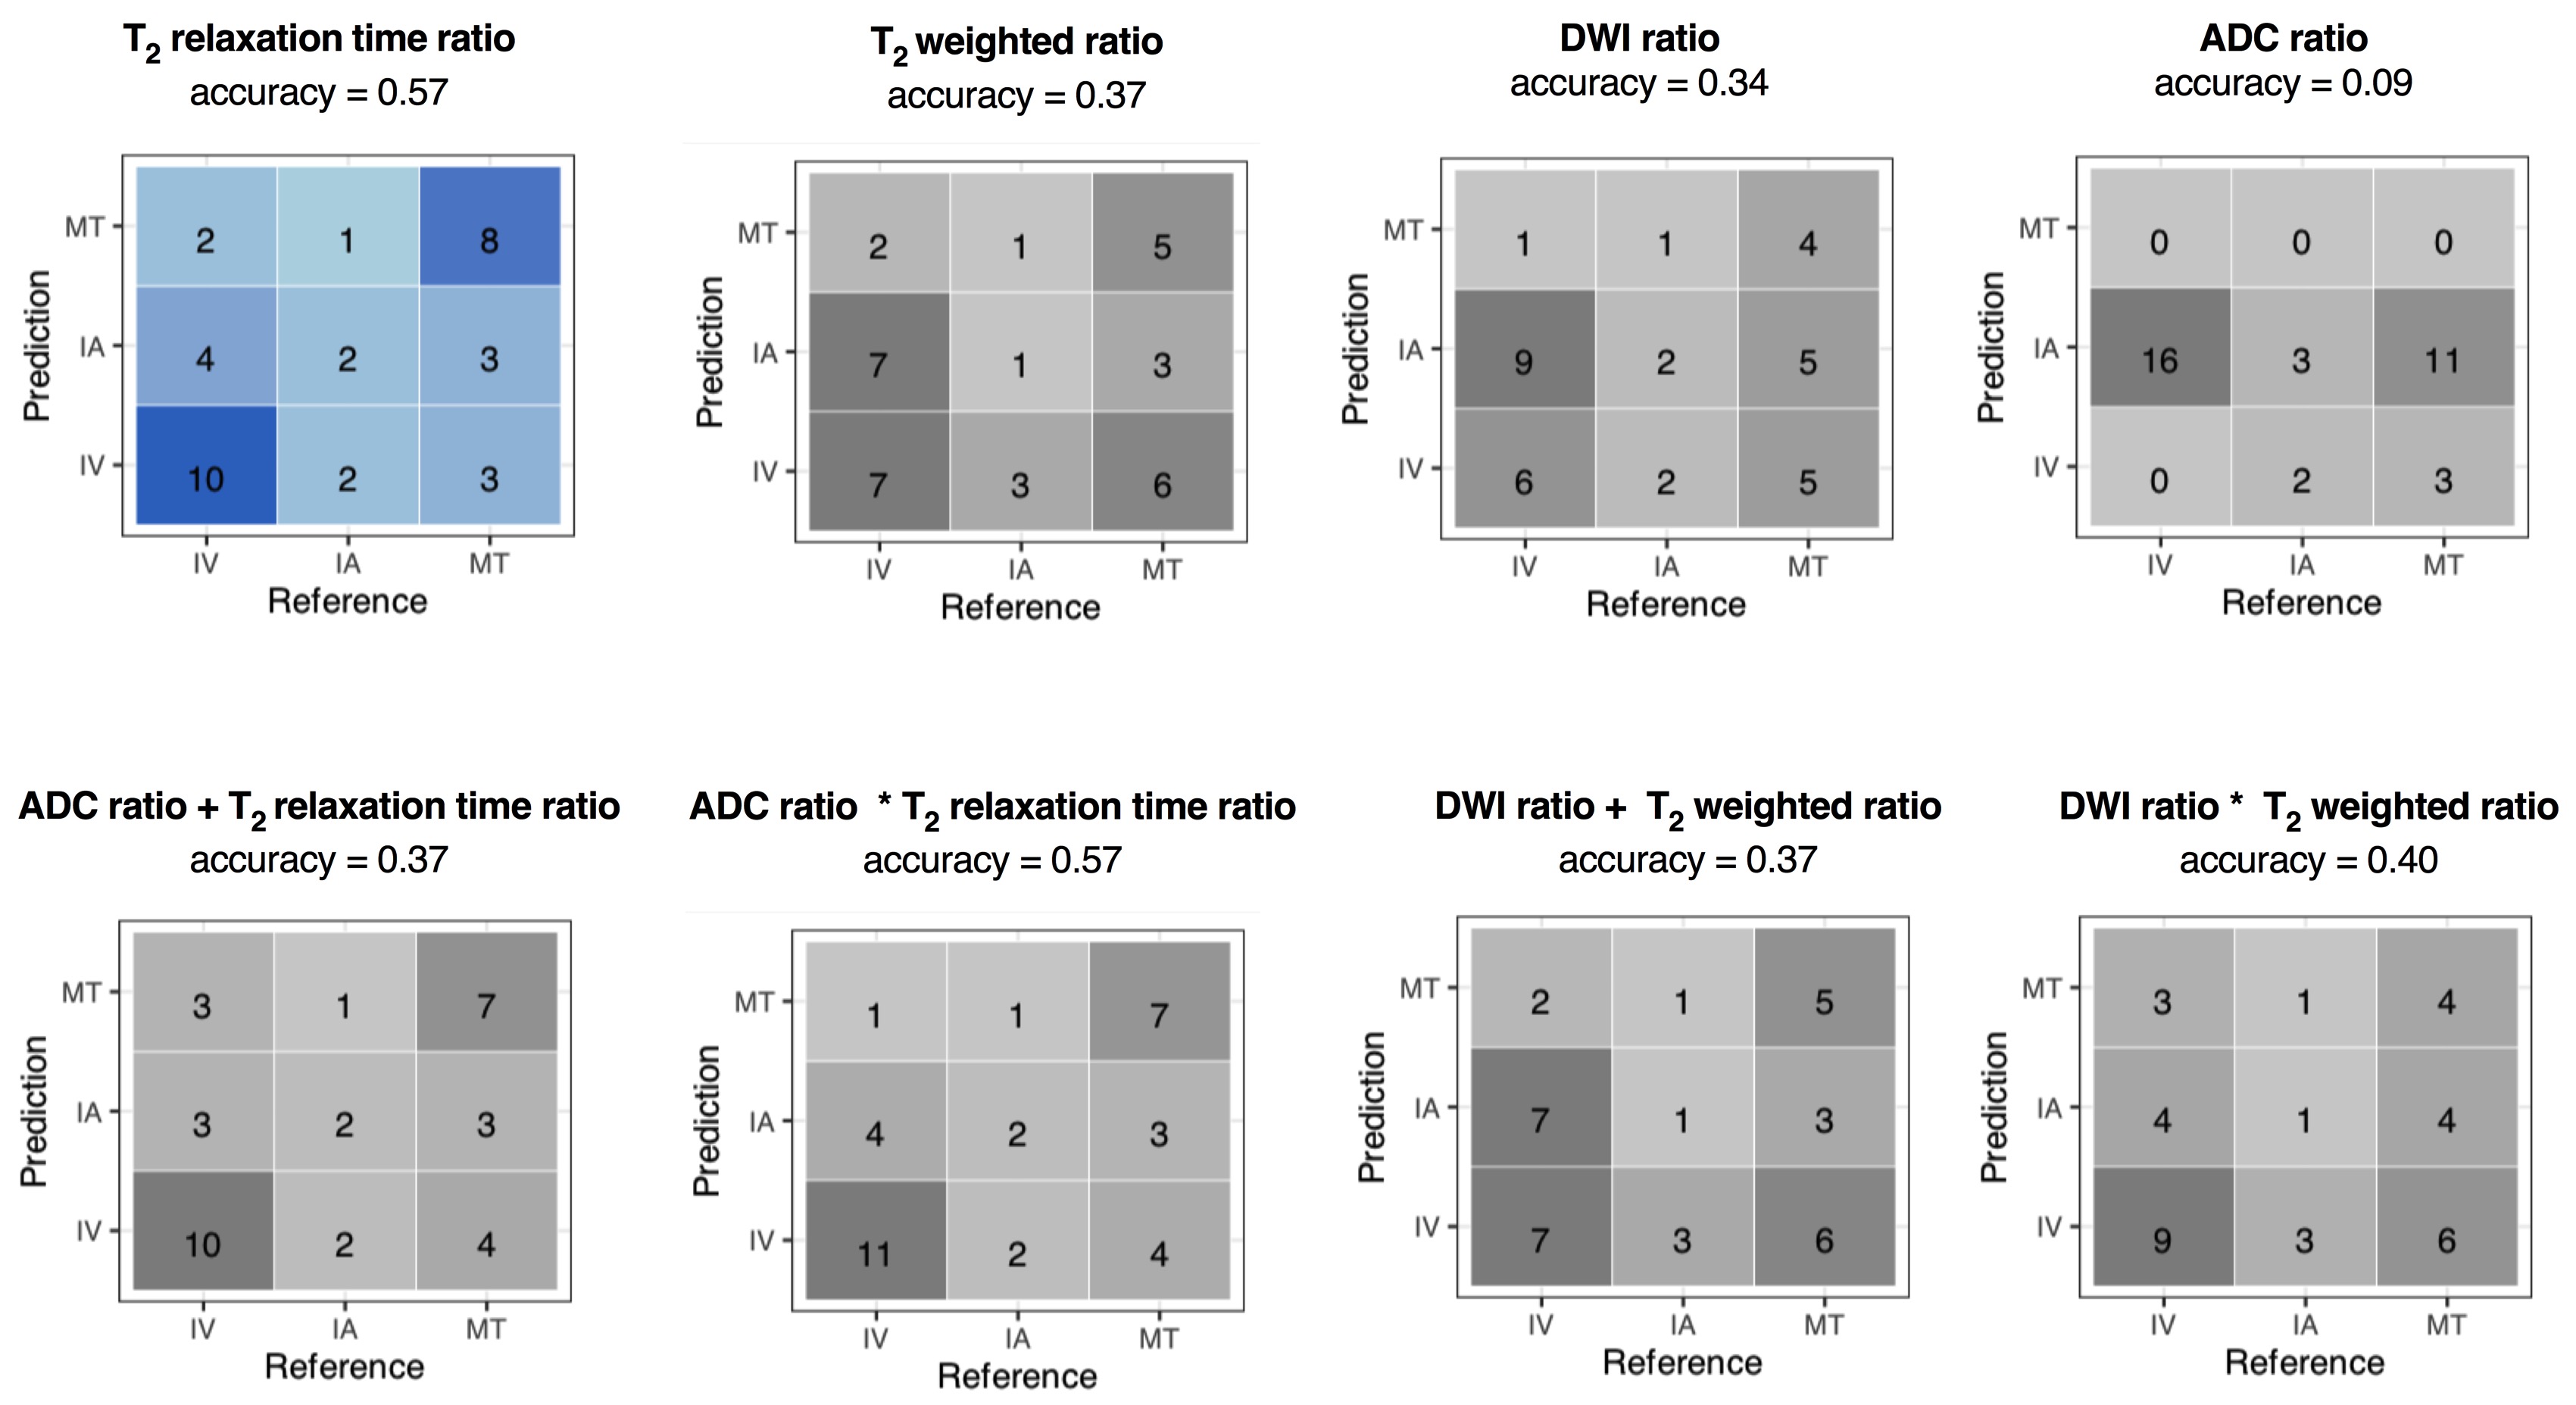
For each patient, our ordinal regression models predict a probability distribution across the treatment-windows, which can be used to inform treatment decisions in two ways. The maximum likelihood approach predicts the treatment-window with the maximum probability. For example, given a probability distribution of IV=0.4, IA=0.3, and MT=0.3, we predict the patient is within the IV thrombolysis window. However, although in this example, IV has the maximum probability of 0.4, there is 0.6 probability that IV is not suitable. This problem is addressed by using the ordinal relationship between treatment-windows and the concept of cumulative probability below a treatment threshold; a patient is within the IV window if the probability of IV is greater than the probability of not being IV (P(IV) > P(IA) + P(MT)), or if a patient is not IV, then they are classified as in the IA window if there is more probability that they are IA or IV than that they are MT (P(IV) + P(IA) > P(MT)). Otherwise, they are in the MT window. We used leave one out cross-validation to evaluate the accuracy of our models using these decision criteria.
Results
The T2 relaxation time ratio model was the most accurate for the maximum likelihood (Figure 2) and cumulative (Figure 3) approaches. Only the cumulative approach identified patients in the IA window.Discussion
Acute ischaemic stroke patients scanned within one of three treatment-windows can be identified using T2 relaxation times, ordinal regression and cumulative probabilities. By accounting for the cumulative probabilities of a patient being within a certain time-window, ordinal regression enables patients in the middle IA treatment-window to be identified which previous binary approaches2-6 did not allow for. Admittedly the accuracy dropped using cumulative probability, but it was able to identify patients in the IA window (Figure 3), which the maximum likelihood model could not do. We believe this is an important observation because the IA window is the most difficult to identify both because clinically it is a transitional phase, and from a data perspective it was the minority class in the dataset. Results also support and extend previous conclusions regarding the superior ability of T2 relaxation times over other T2-based weighted image intensities for onset time estimation2,12,13 and that combining diffusion and T2-based parameters does not improve accuracy.2 Higher accuracy of the T2 relaxation time is likely due to T2 being a single quantitative parameter.2 Fitting signal intensities to the T2 decay curve, removes the influence of confounding factors that affect weighted images such as magnetic field inhomogeneities, proton density and T1 relaxation.2Conclusion
With further development, the methods presented here could support clinicians in treatment decisions for stroke patients with unknown onset time. Future work will involve a larger sample with balanced class sizes and application of a cost weighting function to each treatment category, to account for different clinical costs associated with misclassifications and improve overall prediction accuracy.Acknowledgements
We acknowledge the Dunhill Medical Trust (DMT) for funding the study (R385/1114). Engineering and Physical Sciences Research Council (EPSRC) for PhD studentship funding, as well as the National Institute for Health Research Clinical Research Network (NIHR CRN). This work was partly supported by the PRECISE4Q Predictive Modelling in Stroke (https://precise4q.eu) project funded by from the European Union’s Horizon 2020 research and innovation programme under grant agreement No. 777107. This research was also partly supported by the ADAPT Research Centre, funded under the SFI Research Centres Programme (Grant 13/ RC/2106) and is co-funded under the European Regional Development Funds.References
1. Powers WJ, Rabinstein AA, Ackerson T, et al. 2018 Guidelines for the Early Management of Patients With Acute Ischemic Stroke: A Guideline for Healthcare Professionals From the American Heart Association/American Stroke Association. Stroke 2018;49.
2. McGarry BL, Damion RA, Chew I, et al. A Comparison of T2 Relaxation-Based MRI Stroke Timing Methods in Hyperacute Ischemic Stroke Patients: A Pilot Study. J Cent Nerv Syst Dis. 2020; 12:1-13.
3. Madai VI, Wood CN, Galinovic I, et al. Clinical-Radiological Parameters Improve the Prediction of the Thrombolysis Time Window by Both MRI Signal Intensities and DWI-FLAIR Mismatch. Cerebrovasc Dis 2016;42:57–65.
4. Wouters A, Cheng B, Christensen S, et al. Automated DWI analysis can identify patients within the thrombolysis time window of 4.5 hours. Neurology. 2018;90(18).
5. Thomalla G, Simonsen CZ, Boutitie F, et al. MRI-Guided Thrombolysis for Stroke with Unknown Time of Onset. N Engl J Med 2018;379:611–22.
6. Wouters A, Dupont P, Christensen S, et al. Multimodal magnetic resonance imaging to identify stroke onset within 6 h in patients with large vessel occlusions. Eur Stroke J 2018;3:185–92.
7. Nogueira RG, Jadhav AP, Haussen DC, et al. Thrombectomy 6 to 24 Hours after Stroke with a Mismatch between Deficit and Infarct. N Engl J Med 2018;378:11–21.
8. Gutiérrez PA, Pérez-Ortiz M, Sánchez-Monedero J, et al. Ordinal Regression Methods: Survey and Experimental Study. IEEE Trans Knowl Data Eng 2016;28:127–46.
9. McCullagh P. Regression Models for Ordinal Data. J R Stat Soc Ser B Methodol 1980;42:109–27.
10. Knight MJ, Damion RA, McGarry BL, et al. Determining T2 relaxation time and stroke onset relationship in ischaemic stroke within apparent diffusion coefficient-defined lesions. A user-independent method for quantifying the impact of stroke in the human brain. Biomed Spectrosc Imaging 2019;8:11–28.
11. Menard S. Standards for Standardized Logistic Regression Coefficients. Soc Forces 2011;89:1409–28.
12. Duchaussoy T, Budzik J-F, Norberciak L, et al.. Synthetic T2 mapping is correlated with time from stroke onset: a future tool in wake-up stroke management? Eur Radiol. 2019; 29:7019-7026.
13. McGarry BL, Rogers HJ, Knight MJ, et al. Determining Stroke Onset Time Using Quantitative MRI: High Accuracy, Sensitivity and Specificity Obtained from Magnetic Resonance Relaxation Times. Cerebrovasc Dis Extra 2016;6:60–5.
Figures