3259
Prognostic value of MR imaging features derived from automatic segmentation in glioblastoma1Biomedical Engineering, University of Virginia, Charlottesville, VA, United States, 2Radiology & Medical Imaging, University of Virginia, Charlottesville, VA, United States
Synopsis
Non-invasive MRI-based survival prediction for glioblastoma patients is potentially valuable for informing prognostic and treatment counseling. In this study, we analyzed the relationships between overall survival and several automatic segmentation-based MR imaging features. Simple logistic regression models to classify 1-year survival with clinical factors and selected imaging features were trained and tested. Results showed that combining imaging features with clinical factors improved the survival prediction.
Introduction
Glioblastoma (GBM) is the most common primary cerebral neoplasm in adults, and typically follows a highly aggressive, albeit variable, clinical course1. Non-invasive methods of survival prediction would inform patient counseling with respect to treatment planning and prognosis. Our aim was to use an automatic segmentation-based method to capture MRI features and explore their value for survival prediction in GBM patients.Methods
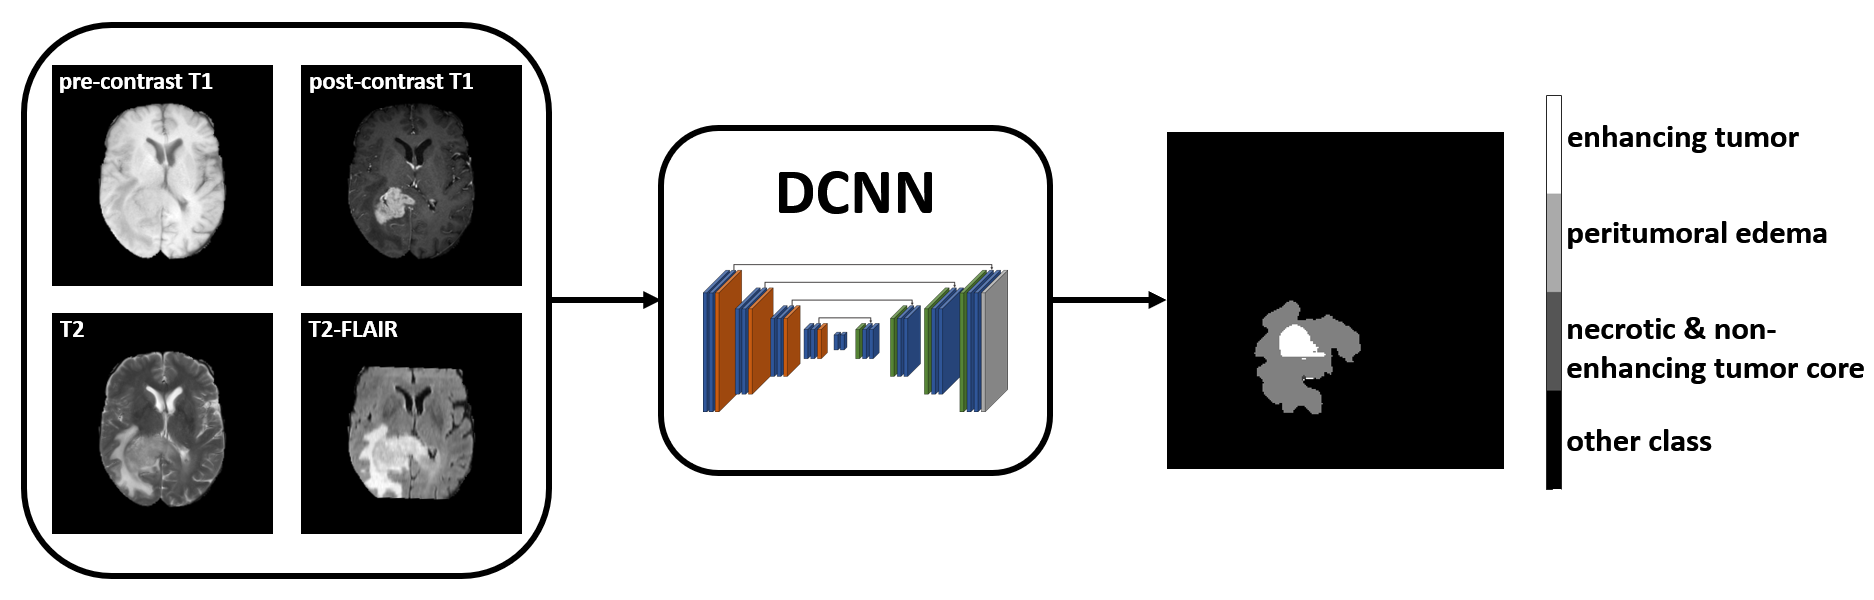
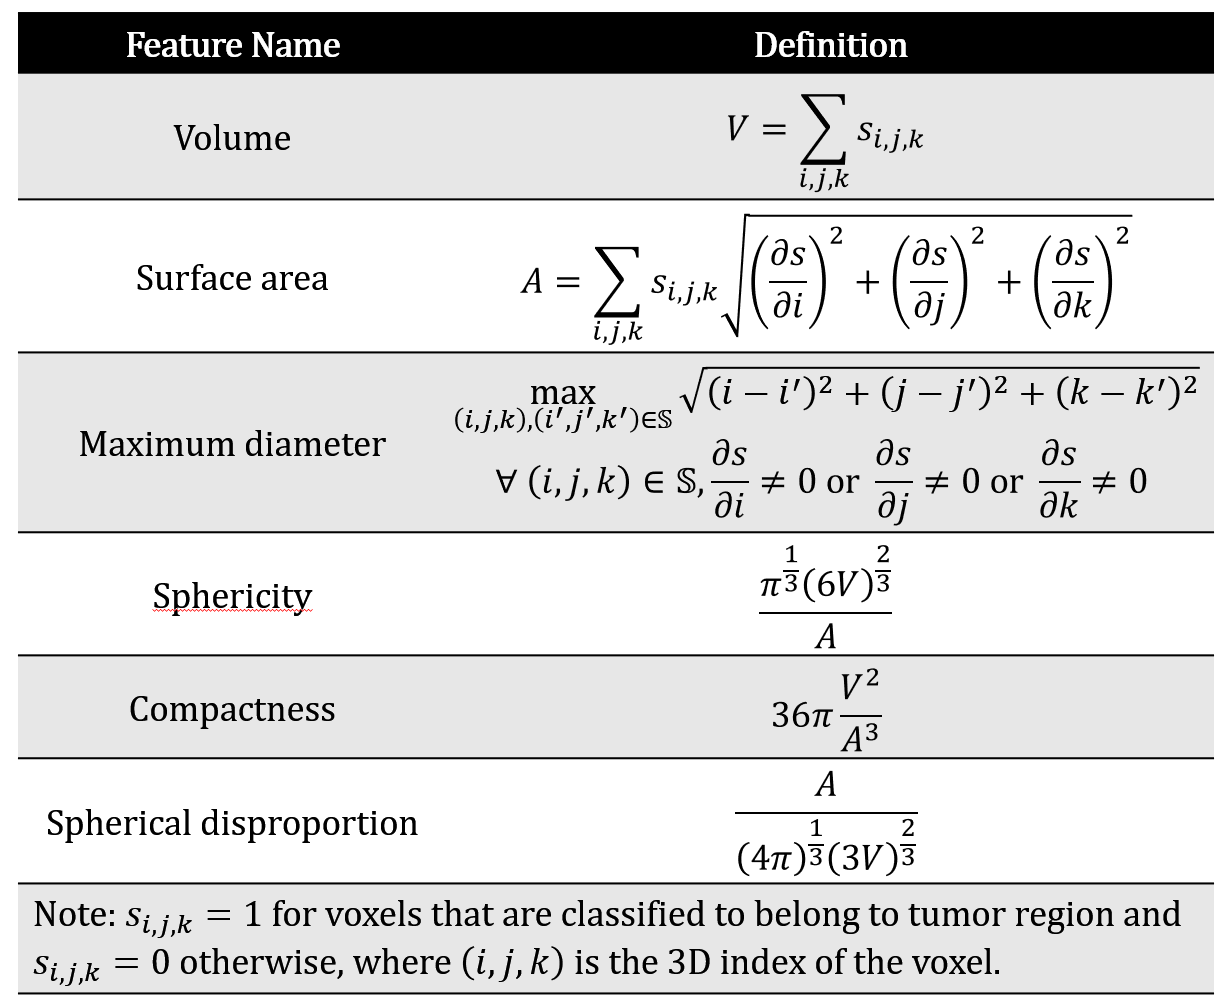
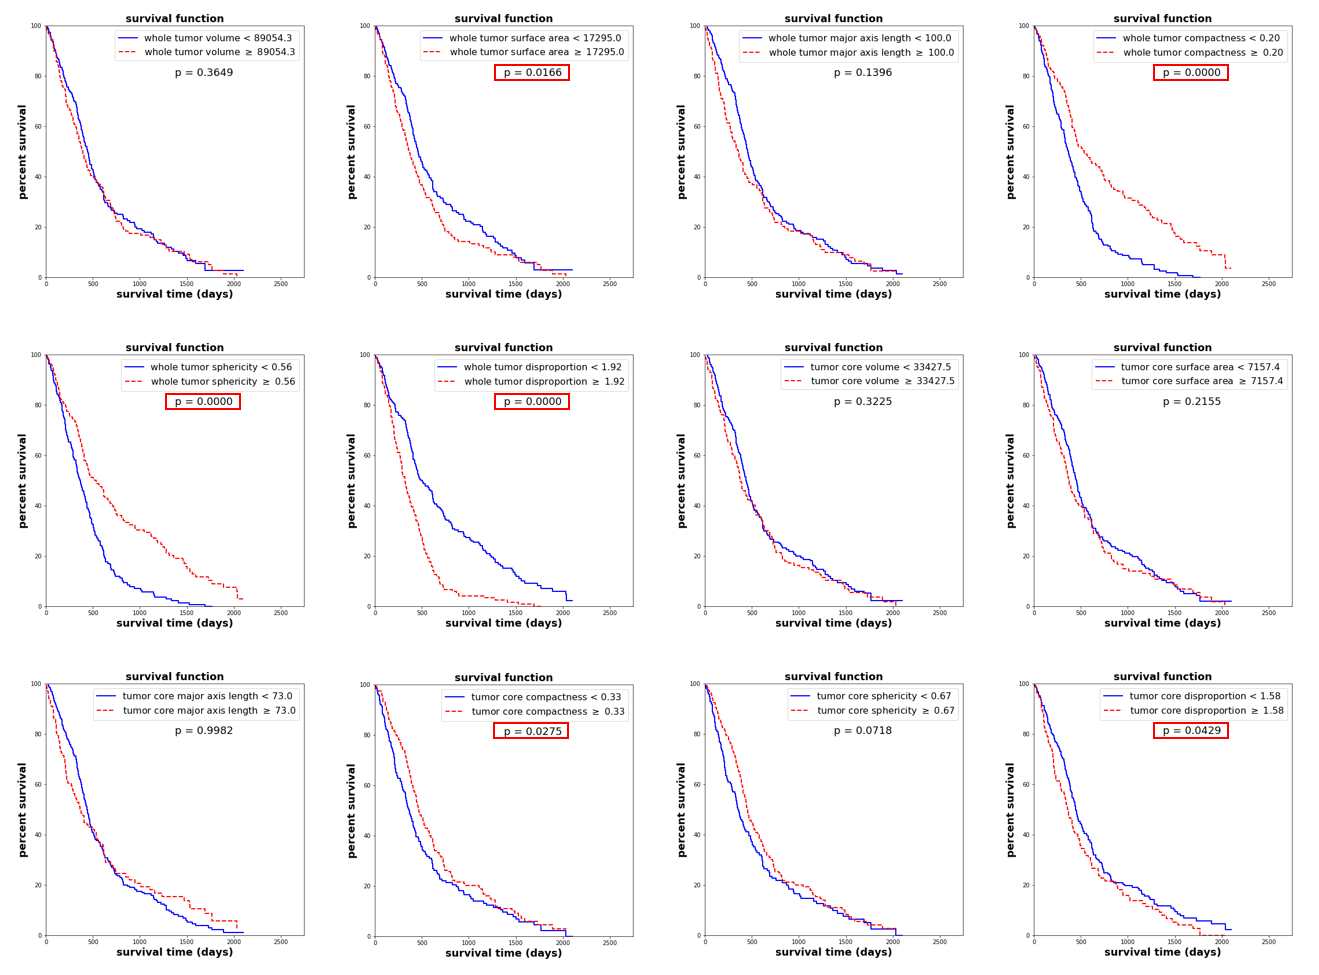
A combined dataset containing 122 patients from a local clinical database and 259 patients from the BraTS challenge2-4 training database was used, with 381 GBMs in total. The median overall survival (OS) was 375 days, therefore we set 1 year as the OS classification threshold. Patient age at diagnosis and gross total resection status were provided as clinical features. A pre-trained deep convolutional neural network5 (DCNN) took in the pre- and post-contrast T1-weighted, T2-weighted, and T2-FLAIR images, and generated segmentation results for each patient, including three subregions: peritumoral edema, enhancing tumor, and necrotic & non-enhancing tumor core, as shown in Figure 1. Imaging features of whole tumor and tumor core shown in Table 1 were calculated after the automatic segmentation. Volume, surface area and maximum diameter are measurements of tumor size. Sphericity, compactness and spherical disproportion are measurements of tumor shape irregularity.The associations between each imaging feature and OS are determined using a Kaplan-Meier plot and a log-rank test. We first trained and tested the logistic regression models for OS classification with only clinical factors. Then the imaging features significantly associated with OS were also included in the models. A 5-fold cross validation was deployed. The average accuracy and area-under-the-curve (AUC) were calculated to evaluate the model performance.
Results
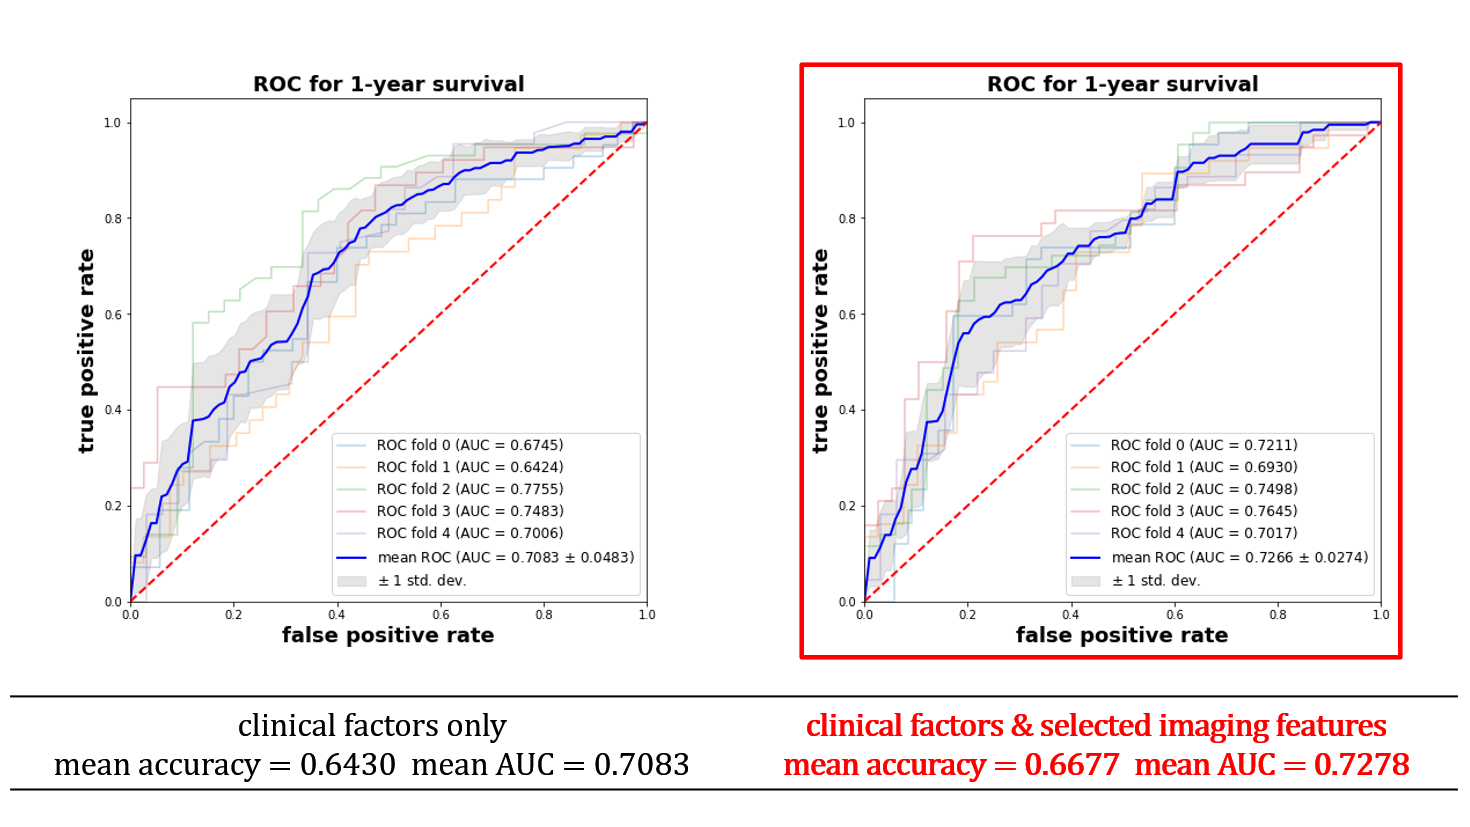
As shown in Figure 2, whole tumor surface area, whole tumor sphericity, whole tumor compactness, whole tumor disproportion, tumor core compactness and tumor core disproportion were significantly associated with OS (p < 0.05), indicating that larger size and irregular shape predict worse survival. With clinical factors only, the logistic regression models achieved a mean accuracy of 0.6430 and a mean AUC of 0.7083. After including the selected imaging features, the mean accuracy was increased to 0.6677 and the mean AUC was increased to 0.7278, as shown in Figure 3.Discussion
Statistical evidence was presented that several automatic segmentation-based MR imaging features are related to OS of GBM patients, which confirms results in previous studies6, 7. The combination of automatic MR image segmentation using a DCNN and computation of the selected imaging features shows promise for improved survival prediction for glioblastoma patients, which is potentially valuable for informing prognostic and treatment counseling.Acknowledgements
This research was supported by the University of Virginia Center for Engineering in Medicine.References
[1] Davis, M. E. (2016). Glioblastoma: overview of disease and treatment. Clinical journal of oncology nursing, 20(5), S2.
[2] Menze, B. H., Jakab, A., Bauer, S., Kalpathy-Cramer, J., Farahani, K., Kirby, J., ... & Lanczi, L. (2014). The multimodal brain tumor image segmentation benchmark (BRATS). IEEE transactions on medical imaging, 34(10), 1993-2024.
[3] Bakas, S., Akbari, H., Sotiras, A., Bilello, M., Rozycki, M., Kirby, J. S., ... & Davatzikos, C. (2017). Advancing the cancer genome atlas glioma MRI collections with expert segmentation labels and radiomic features. Scientific data, 4, 170117.
[4] Bakas, S., Reyes, M., Jakab, A., Bauer, S., Rempfler, M., Crimi, A., ... & Prastawa, M. (2018). Identifying the best machine learning algorithms for brain tumor segmentation, progression assessment, and overall survival prediction in the BRATS challenge. arXiv preprint arXiv:1811.02629.
[5] Feng, X., Tustison, N. J., Patel, S. H., & Meyer, C. H. (2020). Brain tumor segmentation using an ensemble of 3d u-nets and overall survival prediction using radiomic features. Frontiers in Computational Neuroscience, 14, 25.
[6] Mazurowski, M. A., Desjardins, A., & Malof, J. M. (2013). Imaging descriptors improve the predictive power of survival models for glioblastoma patients. Neuro-oncology, 15(10), 1389-1394.
[7] Nicolasjilwan, M., Hu, Y., Yan, C., Meerzaman, D., Holder, C. A., Gutman, D., ... & Hwang, S. N. (2015). Addition of MR imaging features and genetic biomarkers strengthens glioblastoma survival prediction in TCGA patients. Journal of Neuroradiology, 42(4), 212-221.
Figures