3258
Diagnosis of Parkinson’s disease using a radiomics approach based on STrategically Acquired Gradient Echo (STAGE)1East China Normal University, Shanghai Key Laboratory of Magnetic Resonance, Shanghai, China, 2Department of Radiology, Ruijin Hospital, Shanghai Jiao Tong University School of Medicine, Shanghai, China, 3Department of Neurology, Ruijin Hospital, Shanghai Jiao Tong University School of Medicine, Shanghai, China, 4Department of Biomedical Engineering, Wayne State University, Detroit, MI, United States
Synopsis
Diagnosing Parkinson’s disease (PD) is still a clinical challenge. Deep grey matter is involved in the pathophysiological changes of PD. We built a radiomics model to distinguish PD from normal controls (NC) based on five brain nuclei in multiple quantitative images derived from STrategically Acquired Gradient Echo (STAGE) imaging. This model combined features from the caudate nucleus, globus pallidus, putamen, red nucleus, and substantia nigra regions in QSM, T1and proton density maps and achieved a test AUC of 0.948. Features from the SN region as seen in the QSM images were found to be the most important ones for classification.
INTRODUCTION
Diagnosing Parkinson’s disease (PD) is still a clinical challenge1. Deep grey matters are involved in the pathophysiological changes of PD. STrategically Acquired Gradient Echo (STAGE) could provide multi-contrast quantitative images within 5 minutes scanning 2, 3. We aimed to utilize multi brain nuclei from quantitative susceptibility mapping (QSM), T1 mapping and proton density mapping, which were all derived from STAGE, to build radiomic models and develop an automated classification framework for PD patients diagnosis.METHODS
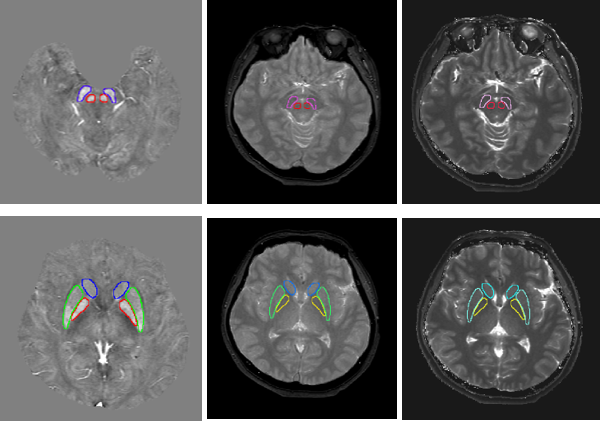
A total of 99 PD patients and 287 normal controls were collected at Ruijin Hospital. All data were collected on a 3T Ingenia scanner (Philips Healthcare, Netherlands) using a 15-channel head coil. The parameters used for STAGE scanning are given in Table 1. The axial slice orientation was set to be parallel to the anterior commissure posterior commissure (ACPC) line for all of sequences. Three modalities including QSM, T1 mapping and proton density mapping were processed from STAGE data afterwards.The dataset was randomly split into a training set (69PD/201NC) to select features from each modality and build the model and a testing set (30PD/87NC) to evaluate the performance of the model. All cases were input into a trained U-net++ model to segment caudate nucleus (CN), globus pallidus (GP), putamen (PUT), red nucleus (RN), and substantia nigra (SN) regions as shown in Fig.1. The resulting five regions of interest (ROI) were used in the radiomics models to classify PD and NC for each ROI on each MR modality. For each ROI, the selected features from three the quantitative STAGE imaging maps were concatenated to build a combined brain model. We concatenated retained features in the five brain nuclei models again to build the final classification model. The flowchart of the radiomics experiments is shown in Fig. 2.
For each ROI and MR modality, 1116 radiomics features including first order and texture features were extracted in the original image, wavelet, and the LoG filtered image with Pyradiomics. The training dataset was balanced with upsampling after feature normalization. Then, Pearson Correlation Coefficient (PCC) and recursive feature elimination (RFE) algorithms were used to reduce the feature dimension and select features with 5-fold cross validation in the training dataset. Finally, a support vector machine (SVM) or logistic regression (LR) classifier were built using the selected features. All the above processes were implemented with FeAture Explorer4.
RESULTS
The segmentation model achieved a mean Dice value (DSC) of 0.806 ± 0.051, 0.864 ± 0.042, 0.856 ± 0.037, 0.855 ± 0.037, and 0.832 ± 0.054 for CN, GP, PUT, RN, and SN regions. In the same testing dataset, the area under the receiver operating characteristic (ROC) curve (AUC) of the radiomics model for each ROI and quantitative MR measure is shown in Table 2. We used the ROC curve to evaluate the performance of the final model (Fig. 3) and the model yielded an AUC of 0.948 (95% CI, 0.886–0.989; p < 0.001), an accuracy of 91.0%, a sensitivity of 86.7%, a specificity of 92.6%, a positive predictive value (PPV) of 81.3%, and a negative predictive value (NPV) of 94.9% in the testing dataset. The final model used 28 features selected with 1- standard error rule (Fig. 3) and the 6 most important features were shown in Table 3, together with their corresponding coefficients.DISCUSSION AND CONCLUSION
In summary, we have introduced a radiomics approach based on STAGE-derived quantitative images to differentiate PD from NC. This model utilized the 5 deep nuclei (CP, GPI, PUT, SN and RN) as seen in the QSM, T1 maps and proton density maps to distinguish PD from NC and achieved a high accuracy. The features extracted from the SN region on the QSM images played an important role in classifying PD and NC. From Table 3, we can see features from the PUT and CN in T1 mapping images also made significant contributions to the classification. The proposed radiomics approach could effectively and accurately discriminate PD patients from NC and has the potential to support a clinical radiological diagnosis.Acknowledgements
NoneReferences
1. Leentjens A F G. Depression in Parkinson’s disease: conceptual issues and clinical challenges. Journal of Geriatric Psychiatry and Neurology, 2004, 17(3): 120-126.
2. Chen Y, Liu S, Wang Y, et al. STrategically Acquired Gradient Echo (STAGE) imaging, part I: Creating enhanced T1 contrast and standardized susceptibility weighted imaging and quantitative susceptibility mapping. Magnetic resonance imaging, 2018, 46: 130-139.
3. Wang Y , Chen Y , Wu D , et al. STrategically Acquired Gradient Echo (STAGE) imaging, part II: Correcting for RF inhomogeneities in estimating T1 and proton density. Magnetic Resonance Imaging, 2018:46:140-150.
4. Song Y, Zhang J, Zhang Y, et al. FeAture Explorer (FAE): A tool for developing and comparing radiomics models. Plos one, 2020, 15(8): e0237587.
Figures