3257
Synthesize Quantitative Susceptibility Mapping from Susceptibility Weighting Imaging Using a Cycle Generative Adversarial Network
Zuojun Wang1, Peng Xia1, Henry Ka Fung Mak2, and Peng Cao1
1Diagnostic Radiology, Department of Diagnostic Radiology, HKU, Hong Kong, China, 2Department of Diagnostic Radiology, HKU, Hong Kong, China
1Diagnostic Radiology, Department of Diagnostic Radiology, HKU, Hong Kong, China, 2Department of Diagnostic Radiology, HKU, Hong Kong, China
Synopsis
Quantitative susceptibility mapping (QSM) obtained from the MRI phase images is valuable in neurological disease diagnoses. Meanwhile, the role of thumb MRI scan probing susceptibility contrast is susceptibility weighting imaging (SWI), which might contain blooming artifacts that would affect the hypointensity appearance. Many conventional methods have been developed for QSM reconstruction, including the deep learning-based approach that is applicable in clinical diagnoses. Here, we apply the cycle generative adversarial network with a perceptual loss to synthesize QSM images from SWI images. The predicted QSM images showed their application in brain microbleed detection.
Purpose
Susceptibility weighting imaging (SWI) and Quantitative susceptibility mapping (QSM) are calculated from the gradient-echo phase and magnitude images, depicting the property of tissue magnetic susceptibility 1-2. They are both applicable in clinical diagnoses, such as in small vessel disease (SVD) 3-4. however, the QSM is more advantageous in delineating vascular lesions than SWI or T2* weighted imaging. The hypointensities on SWI or T2* could be contaminated by blooming artifacts 2.The QSM reconstruction follows many steps from raw phase images to the final dipole inversion results 2,5. Many conventional methods proposed to tackle the problems were constricted by the calculation time and the parameters adjustment. Deep learning-based methods exhibit their superiority in computing and operating complex problems, and some models, like deepQSM 6, QSMnet 7, and QSMGAN 8, for QSM reconstruction, were developed.
Here, we proposed an SWI to QSM (S2Q) model based on the cycle generative adversarial network to synthesize QSM from SWI. The proposed method could be useful in the diagnosis of neurovascular diseases in two folds: 1) the synthesized QSM data are more reliable than the QSM from conventional reconstruction as significant artifacts were reduced; 2) the predicted S2Q QSM showed high accuracy in detecting microbleeds.
Methods
Our paired CycleGAN is implemented based on the architecture in reference 9, as shown in Figure 1. Two generators and two discriminators were trained simultaneously, mapping two domains, i.e., A for SWI and B for QSM, mutually. Each layer consisted of a 3×3 kernel, with instance normalization and ReLU activation layer subsequently. Cycle consistent loss was MSE + 0.1×perceptual loss, which was based on a pre-trained VGG-16, and MSE was used for the discriminator loss and the paired loss. In a total of 48 epochs were conducted in training. Adam optimizers were used, and the initial learning rates were all 2×10⁻⁴ with beta 1 = 0.5, beta 2 = 0.999. The model was trained and evaluated on a local graphic processing unit (GPU) server equipped with four NVIDIA 2080Ti GPUs and 64 GB RAM. Around 18 hours took with one of the GPUs using Keras API.Two cohorts were included; one was from 58 Parkinson’s disease (PD), and another was from 11 stroke patients. The Institutional Review Board approved the data retrival. A Philips Achieva 3.0T MRI Scanner with an 8-channel head coil was used for data acquisition. The axial susceptibility-weighted images (SWI) were acquired with parameters: TE/TR = 23/28 ms, flip angle =15°, FOV = 230 × 230 × 180 mm3, the nominal matrix size = 512 × 512 × 180, and reconstructed resolution = 0.45 × 0.45 × 1 mm3. Other acquisition parameters were TE/TR = 23/28 ms, flip angle = 15°, FOV = 225 × 225 × 135 mm3, matrix size = 704 × 704 × 135, reconstructed resolution = 0.3267 × 0.3267 × 1.0 mm3.
The QSM images were calculated in the STI Suite package: a brain mask from the magnitude image was generated using FSL. Within the mask, the phase image was spatially unwrapped by Laplacian phase unwrapping. A local field map was then generated by removing a background field using V-SHARP with the kernel size set to 12 mm. Finally, the dipole inversion was done with STAR-QSM. Both SWIs and QSMs were fed into the network for training. In a total of 48 paired data from the PD cohort were fed into the network for training. The rest 20 datasets were used for evaluation. All images were cropped and resized to 256 × 256 during training and testing.
Results
Figure 2 shows one case of training results with data from PD cohort. Most brain structures were delineated accurately by S2Q, compared with the real QSM. Furthermore, some residual artifacts near the boundary (red arrows) disappeared in S2Q. Similarly, in Figure 3, the synthetic QSM from testing data removed the residual artifacts near the nasal cavity, and other brain regions were well delineated. Besides, the S2Q model was evaluated on the unseen stroke cohort data, and the suspected cerebral microbleeds (CMB) were highlighted in Figure 4. In Figure 4, the comparison demonstrated that the CMB could be easily differentiated when they were bright and maintain original spatial resolution in S2Q QSM and hypointensity in the original SWI image.Conclusions
The CycleGAN with perceptual loss was used to synthesize QSM images from related SWI images. The model could predict QSM images reliably with a reduced residual background phase. The predicted QSMs could assist CMB identification along with the SWI scan.Acknowledgements
No acknowledgement found.References
- Liu, C., et al., Susceptibility-weighted imaging and quantitative susceptibility mapping in the brain. J Magn Reson Imaging, 2015. 42(1): p. 23-41.
- Wang, Y., et al., Clinical Quantitative Susceptibility Mapping (QSM): Biometal Imaging and Its Emerging Roles in Patient Care. Journal of Magnetic Resonance Imaging, 2017. 46(4): p. 951-971.
- Klohs, J., et al., detection of cerebral microbleeds with quantitative susceptibility mapping in the ArcAbeta mouse model of cerebral amyloidosis. J Cereb Blood Flow Metab, 2011. 31(12): p. 2282-92.
- Phntoni, Leonardo. Cerebral small vessel disease: from pathogenesis and clinical characteristics to therapeutic challenges. Lancet Neurology, 2010: 9(7). 689-701
- Liu, C.L., et al., Quantitative Susceptibility Mapping: Contrast Mechanisms and Clinical Applications. Tomography, 2015. 1(1): p. 3-17.
- Bollmann, S., et al., DeepQSM - using deep learning to solve the dipole inversion for quantitative susceptibility mapping. Neuroimage, 2019. 195: p. 373-383.
- Yoon, J., et al., Quantitative susceptibility mapping using deep neural network: QSMnet. Neuroimage, 2018. 179: p. 199-206.
- Chen, Y.C., et al., QSMGAN: Improved Quantitative Susceptibility Mapping using 3D Generative Adversarial Networks with increased receptive field. Neuroimage, 2020. 207.
- Zhu, Jun-Yan, Park, Taesung, Isola, Phillip, and Efros, Alexei A. "Unpaired Image-to-Image Translation Using Cycle-Consistent Adversarial Networks." (2017).
Figures
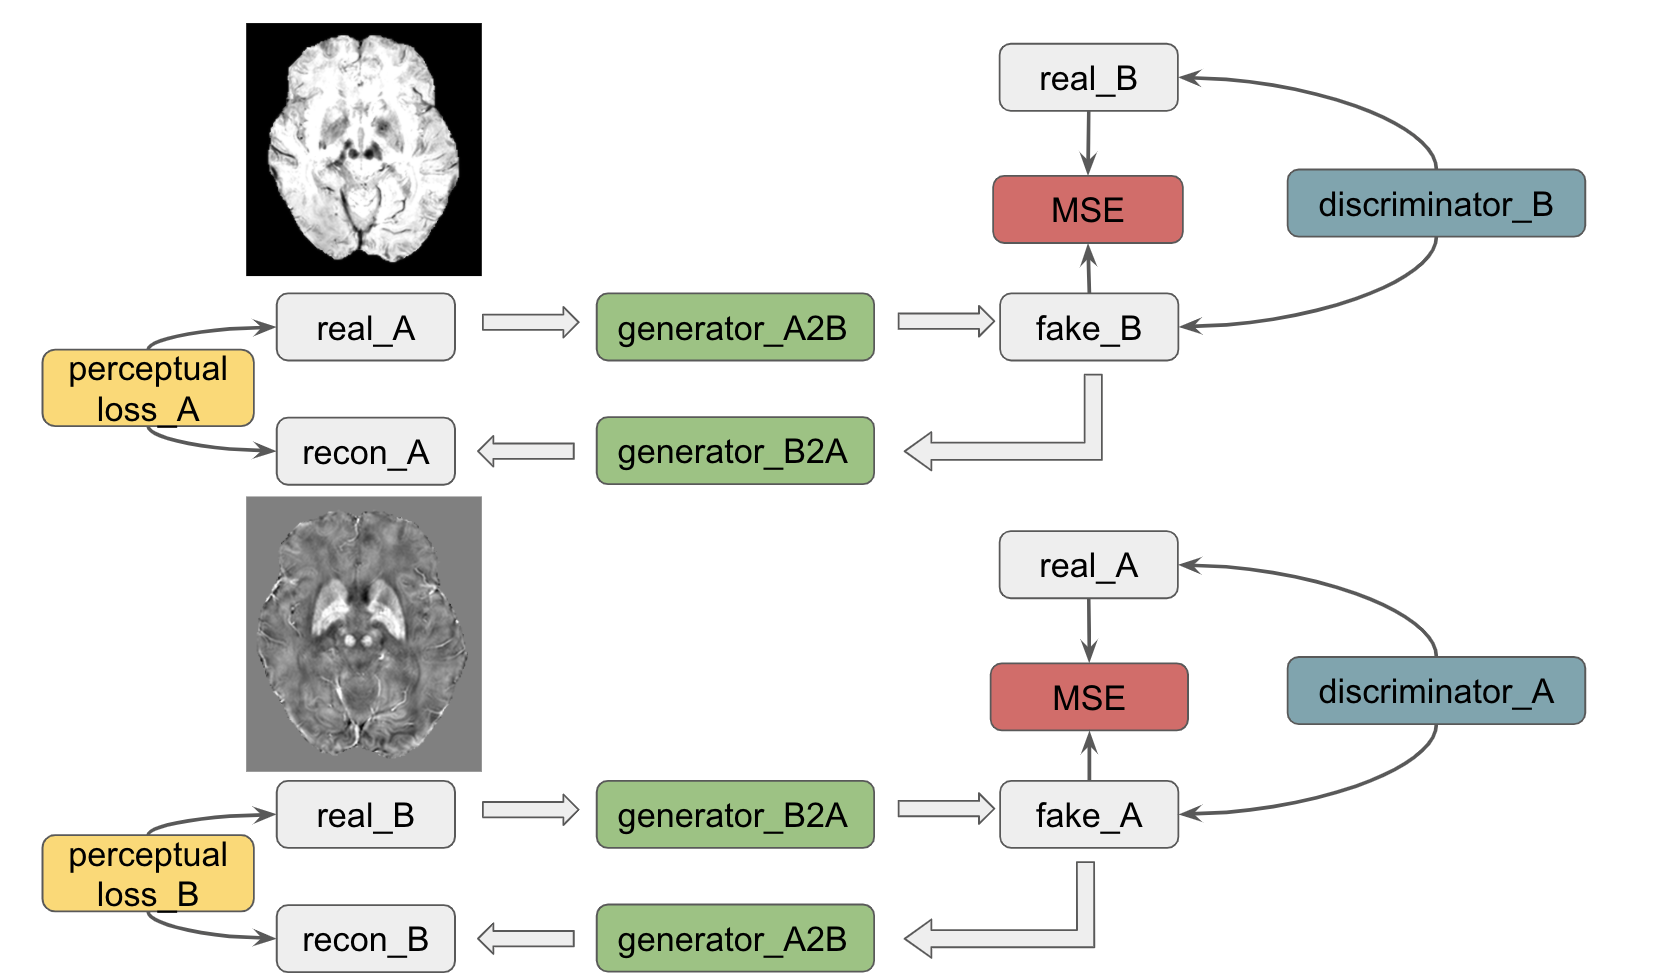
Figure 1: The CycleGAN with perceptual loss was used to synthesize QSM images from related SWI images. The model could predict QSM images reliably with a reduced residual background phase. The predicted QSMs could assist CMB identification along with the SWI scan.
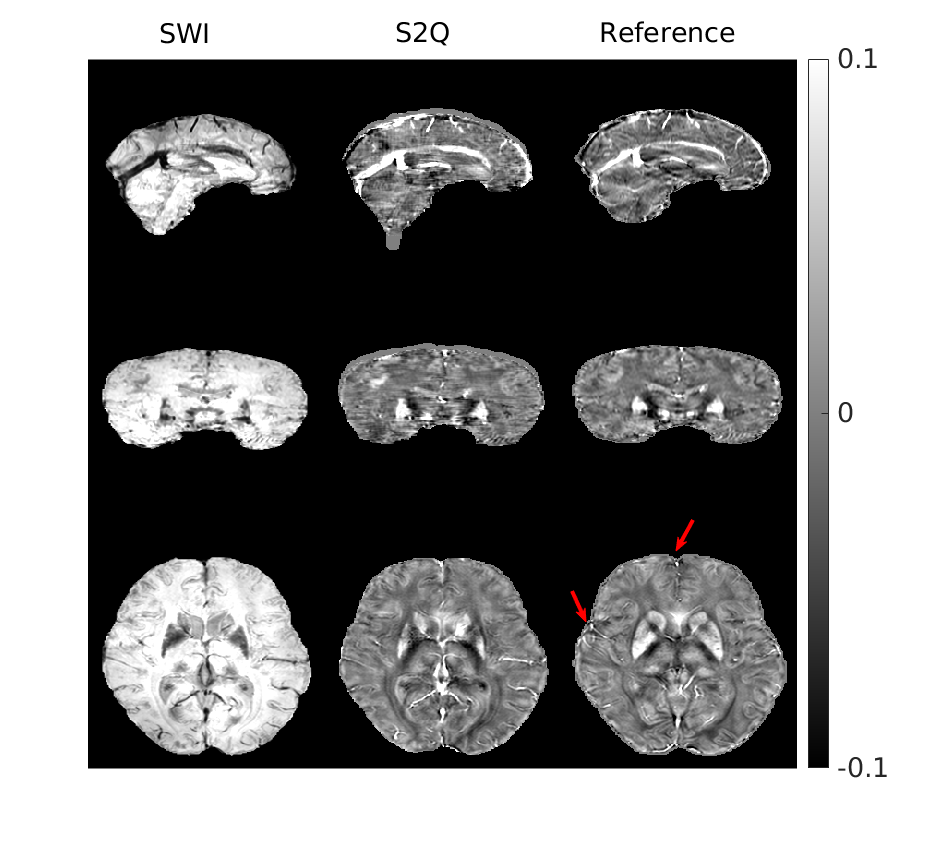
Figure 2: Training results on the dataset from PD cohort. Most brain structures were delineated accurately by S2Q, compared with real QSM calculated from STAR-QSM. Furthermore, some residual artifacts near the boundary (red arrows) were disappeared in S2Q.
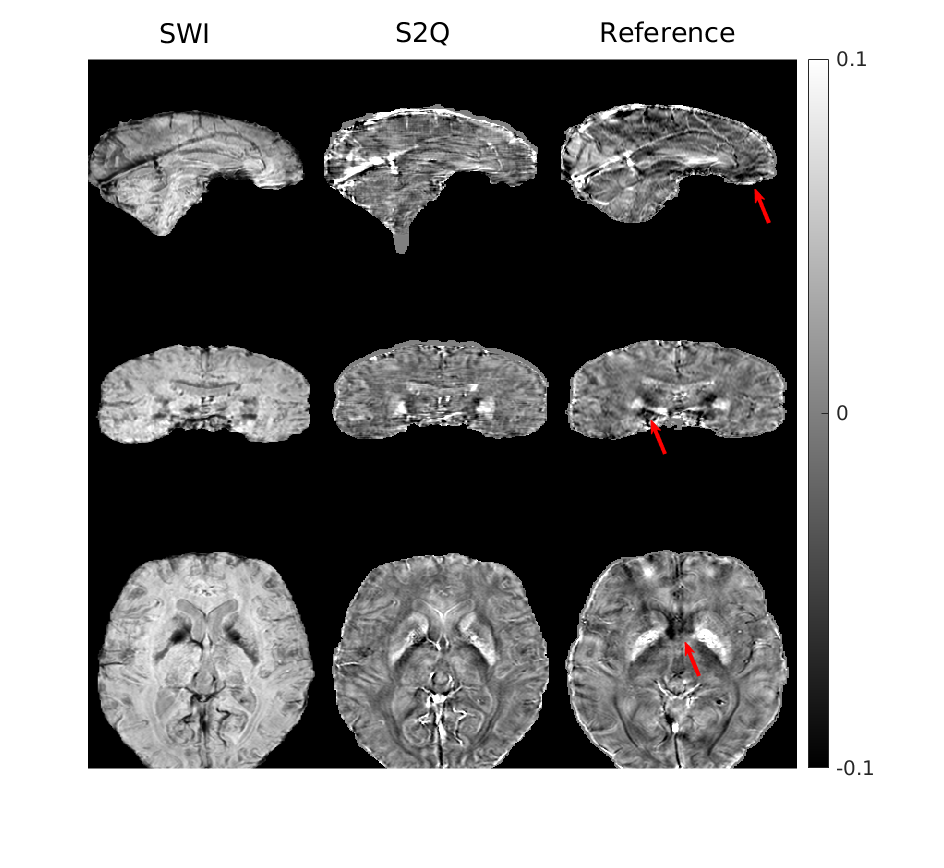
Figure 3: Testing results on another dataset from PD cohort. The residual artifacts near the nasal cavity were all removed. The testing set's model performance was comparable with that on the training set, suggesting minimal generalization error.
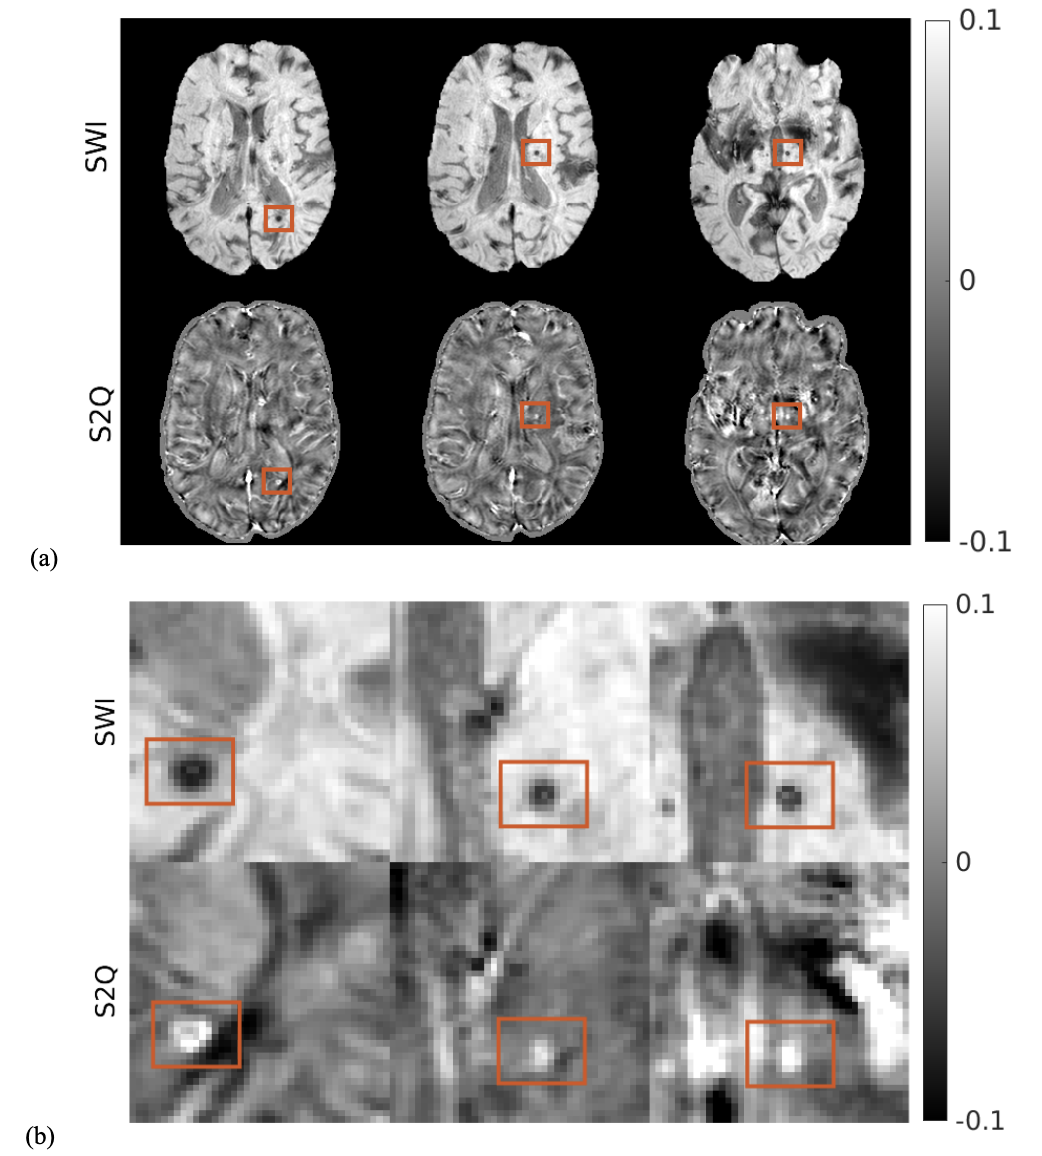
Figure 4: S2Q on the unseen stroke cohort with suspected cerebral microbleeds (CMB) highlighted. (a) Comparison between SWI and S2Q QSM; (b) cropped and zoom-in plots of CMB in (a) are bright and maintain original spatial resolution in S2Q QSM compared to the raw SWI images in which the CMBs are dark. (see the orange rectangles).