3250
Differentiating hemorrhage and vasculature ITSS in SWI-magnitude images in intracranial Glioma: machine-learning and radiomic based approach1Center for Biomedical Engineering, Indian Institute of Technology (IIT) Delhi, New Delhi, India, 2Philips Health Systems, Philips India Limited, Gurugram, India, 3Department of Radiology, Fortis Memorial Research Institute, Gurugram, India, 4Philips Health Systems, Philips Innovation Campus, Bangalore, India, 5Department of Neurosurgery, Fortis Memorial Research Institute, Gurugram, India, 6SRL Diagnostics, Gurugram, India, 7Department of Biomedical Engineering, All India Institute of Medical Sciences, New Delhi, India
Synopsis
Intra-tumoral-susceptibility-signal (ITSS) has been increasingly proven to play a major role in glioma grading, progression assessment and follow-up. Quantitative ITSS assessment involves segmentation of ITSS from SWI images, separating vasculature ITSS from hemorrhage ITSS and finally quantifying the ITSS-vasculature-volume (IVV) to grade the glioma non-invasively. This study involves radiomic feature extraction, random-forest based feature selection and classification to indicate that radiomic features can significantly differentiate between 3Dvasculature and 3DHemorrhage mask regions in SWI-magnitude images. This is also one of the first studies that explores the vasculature and hemorrhage radiomic properties extracted from SWI-magnitude images through machine-learning in grade-IV GBM patients.
Purpose
Susceptibility-weighted-imaging (SWI) and Intra-tumoral-susceptibility-signal (ITSS) has been increasingly proven to play a major role in glioma grading, progression assessment and follow-up [1]. Earlier semi-quantitative scoring based on number of ITSS, was shown to be a potential marker for tumor grades [2]. Recent studies have shown the quantitative assessment based on R2* values are more accurate in glioma grading in cases where visible ITSS presence is noted [3]. This assessment involves segmentation of ITSS from SWI images, separating vasculature ITSS from hemorrhage ITSS and finally quantifying the ITSS-vasculature-volume (IVV) to grade the glioma non-invasively. Studies also show that IVV proves to be a better marker for glioma grading compared to total-ITSS-volume (TIV), which further highlights the necessity for hemorrhage separation from vasculature. However, this method has a main requirement to be implemented successfully: separate echo generation in multi-echo SWI to create R2* maps, which might not always be possible on clinical scanners. Recently few studies have attempted to analyze role of radiomic features from SWI in conditions like deep ischemic veins in developmental disorders, MS lesions and tumor heterogeneity [4][5][6]. We hypothesize that the hemorrhage and vasculature ITSS might also have certain radiomic feature differences, which could be identifiable on SWI images. Specifically, we aim: 1) to quantify radiomic features from hemorrhage and vasculature ITSS masks pre-segmented from quantitative-ITSS framework reported previously, 2) to employ machine-learning methodology to determine, whether any of these radiomic features are potential marker to differentiate hemorrhages from vasculature ITSS.Method
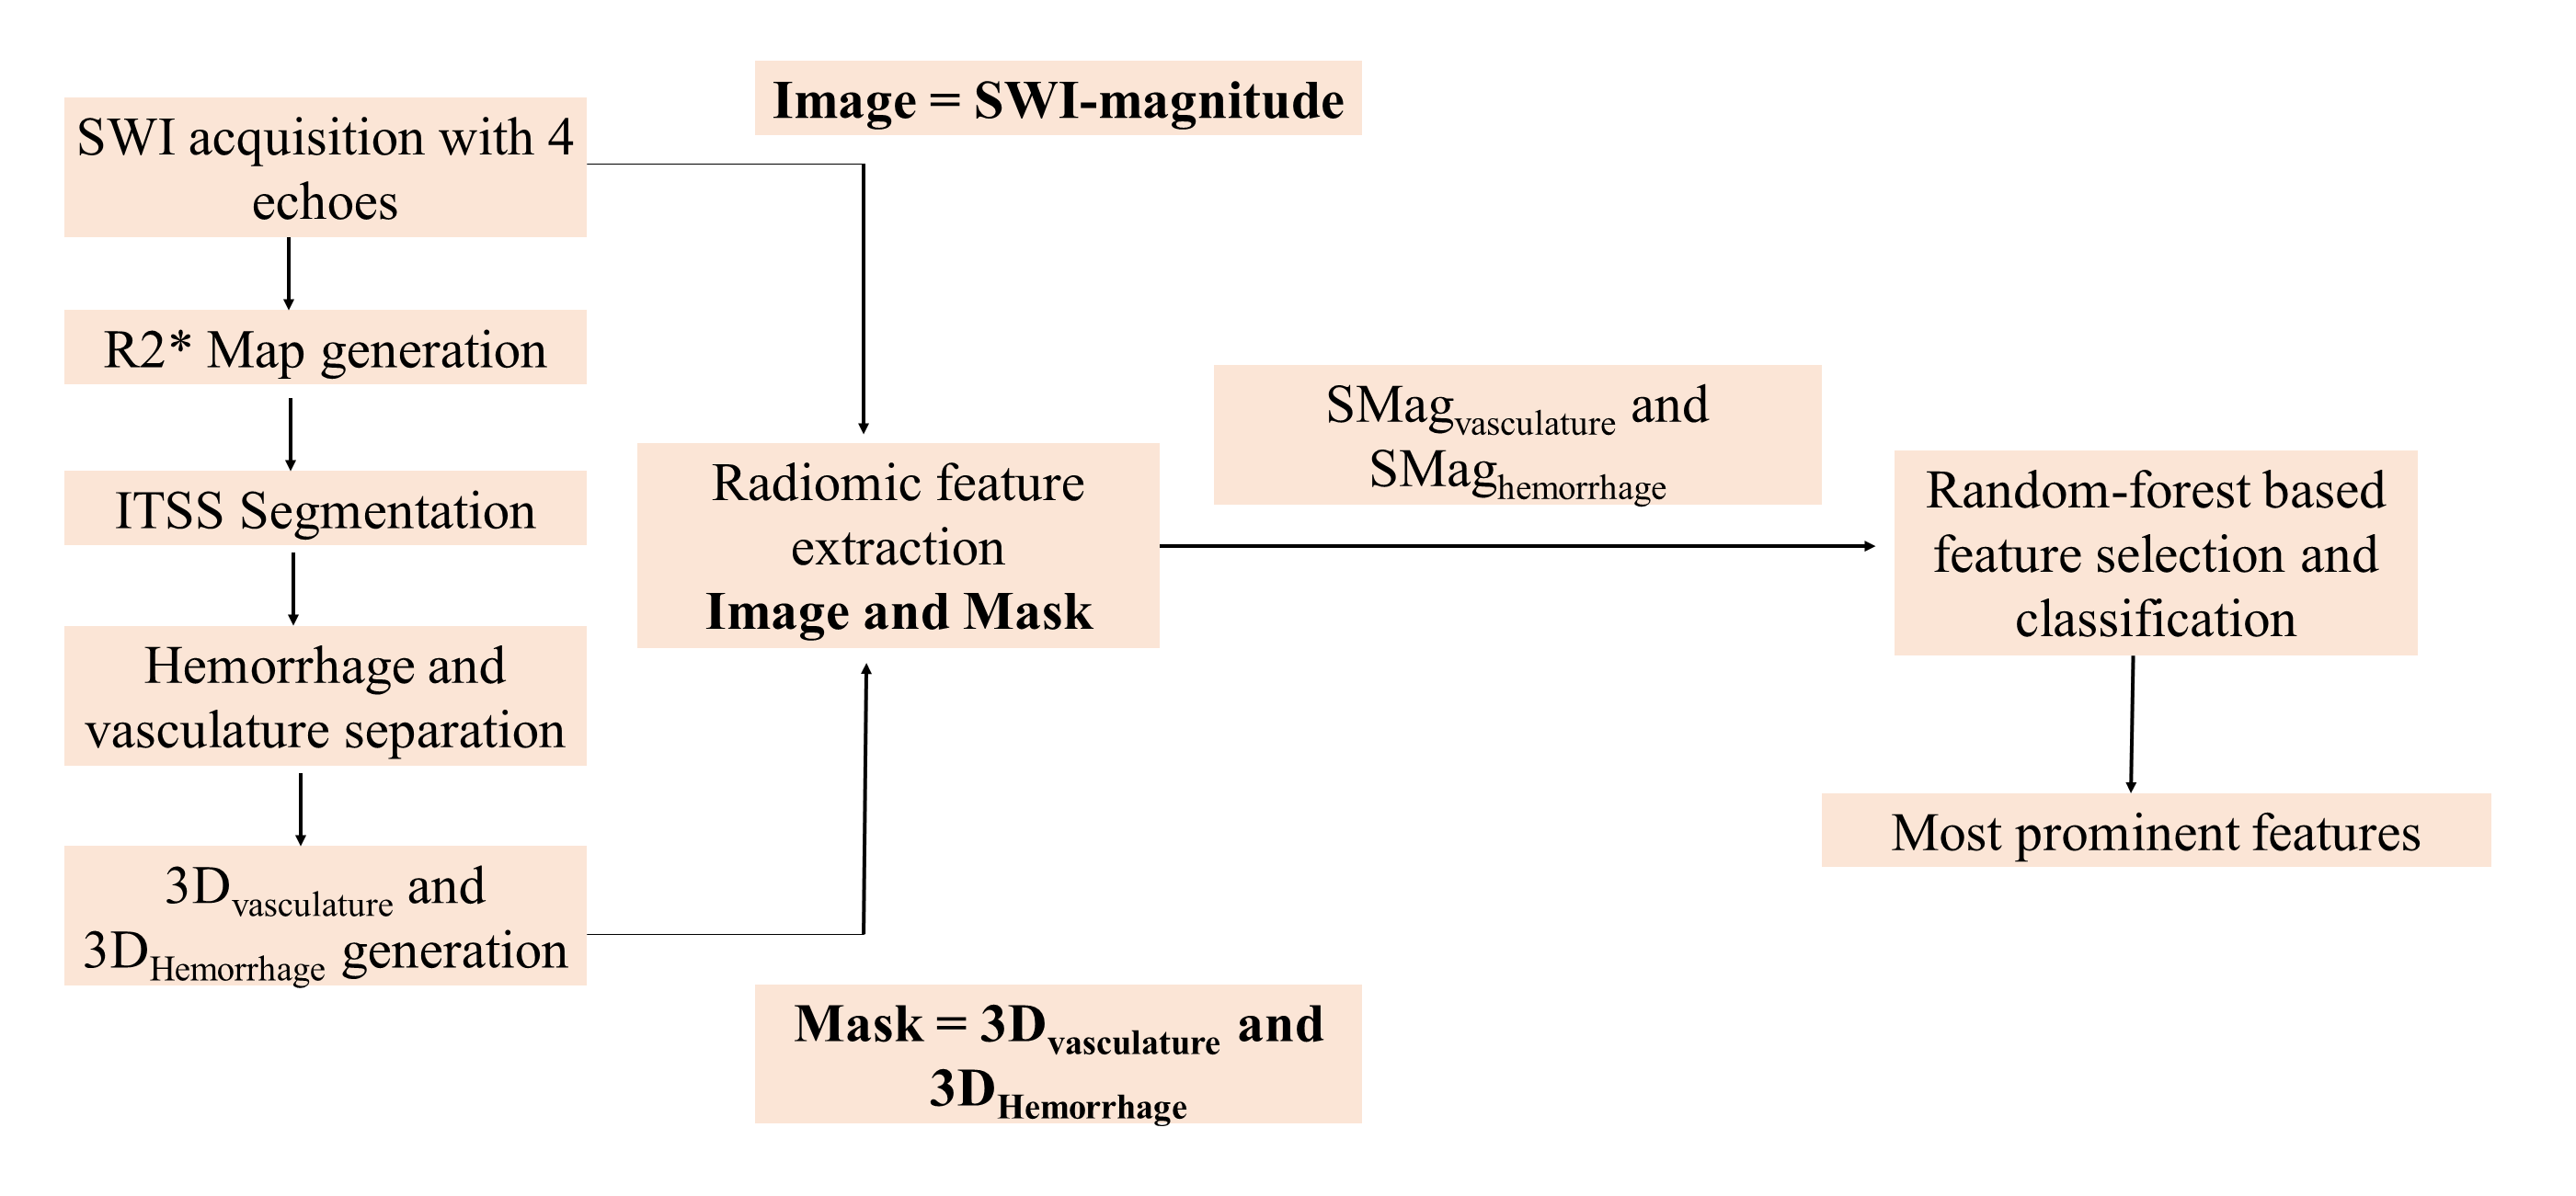
This retrospective study, approved by institutional ethics committee included a total of 80 treatment-naïve patients presented during May 2017 to September 2020 with brain tumors, confirmed as glioblastoma on histology. The important inclusion criteria was all of these patients were having visible ITSS present. Imaging was performed with a 3.0T Ingenia MRI scanner (Philips, The Netherlands) with a 15-channel head coil. SWI sequence was acquired at 4-echoes (TE = 5.6, 11.8, 18 and 24.2 ms respectively) with FOV = 240 X 240 mm2, TR = 31 ms, flip angle = 18, slice-thickness = 1 mm, acquisition matrix = 384 X 384 and reconstruction matrix = 768 X 768. R2* maps generation, ITSS segmentation and separate hemorrhage and vasculature masks generation were done using previously reported methodology [3]. For every patient, 2D binary masks (hemorrhage and vasculature) segmented for all the tumor slices were converted into one 3D-volumetric-segment denoted as 3Dvasculature and 3DHemorrhage mask. For each patient, two sets of radiomic features were extracted from the SWI magnitude images corresponding to these two 3D-volumetric-segments 3Dvasculature and 3DHemorrhage mask using PyRadiomics 2.2.0 library [7]. The two regions are denoted as SMagvasculature (SWI-magnitude) and SMaghemorrhage. A total of 120 radiomic features were extracted in each set, including first-order-statistics:19 features, shape-based-2D: 10 features, shape-based-3D: 16 features, gray-level-co-occurrence-matrix (GLCM): 24 features, gray-level-run-length-matrix (GLRLM): 16 features, gray-level-size-zone-matrix (GLSZM): 16 features, neighboring-gray-tone-difference-matrix (NGTDM): 5 features and gray-level-dependence-matrix (GLDM): 14 features. Finally, a random-forest based feature-selection algorithm was implemented to extract most prominent radiomic features out of the 120, which are significantly different for SMagvasculature and SMaghemorrhage. Random-forest classifier was further implemented to train 60% (48 patients: two datasets each) of the data and 40% of data (32 patients: two datasets each) were applied for testing the classifier prediction. The methodology flowchart is illustrated in figure-1. Performance of the classifier was evaluated based on overall accuracy, precision, recall and F1-score. Precision = TP / (TP + FP), Recall = TP / (TP + FN), F1-score is computed as harmonic mean of precision and recall as: F1-score = (2 * Precision * Recall) / (Precision + Recall). [TP = True Positive, FP = False Positive, TN = True Negative, FN = False Negative].Results
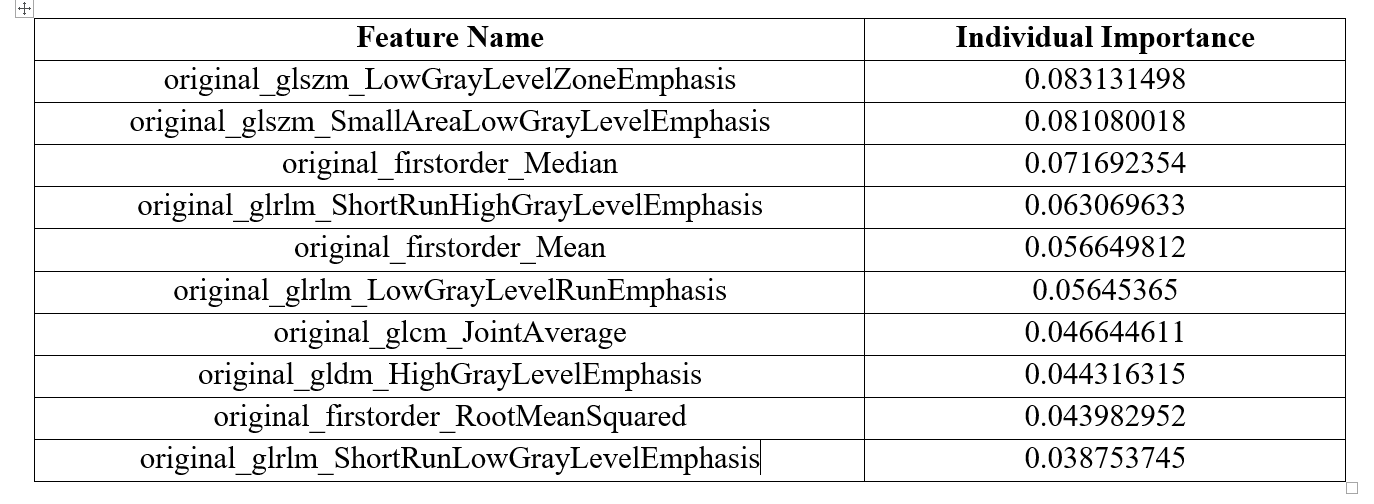
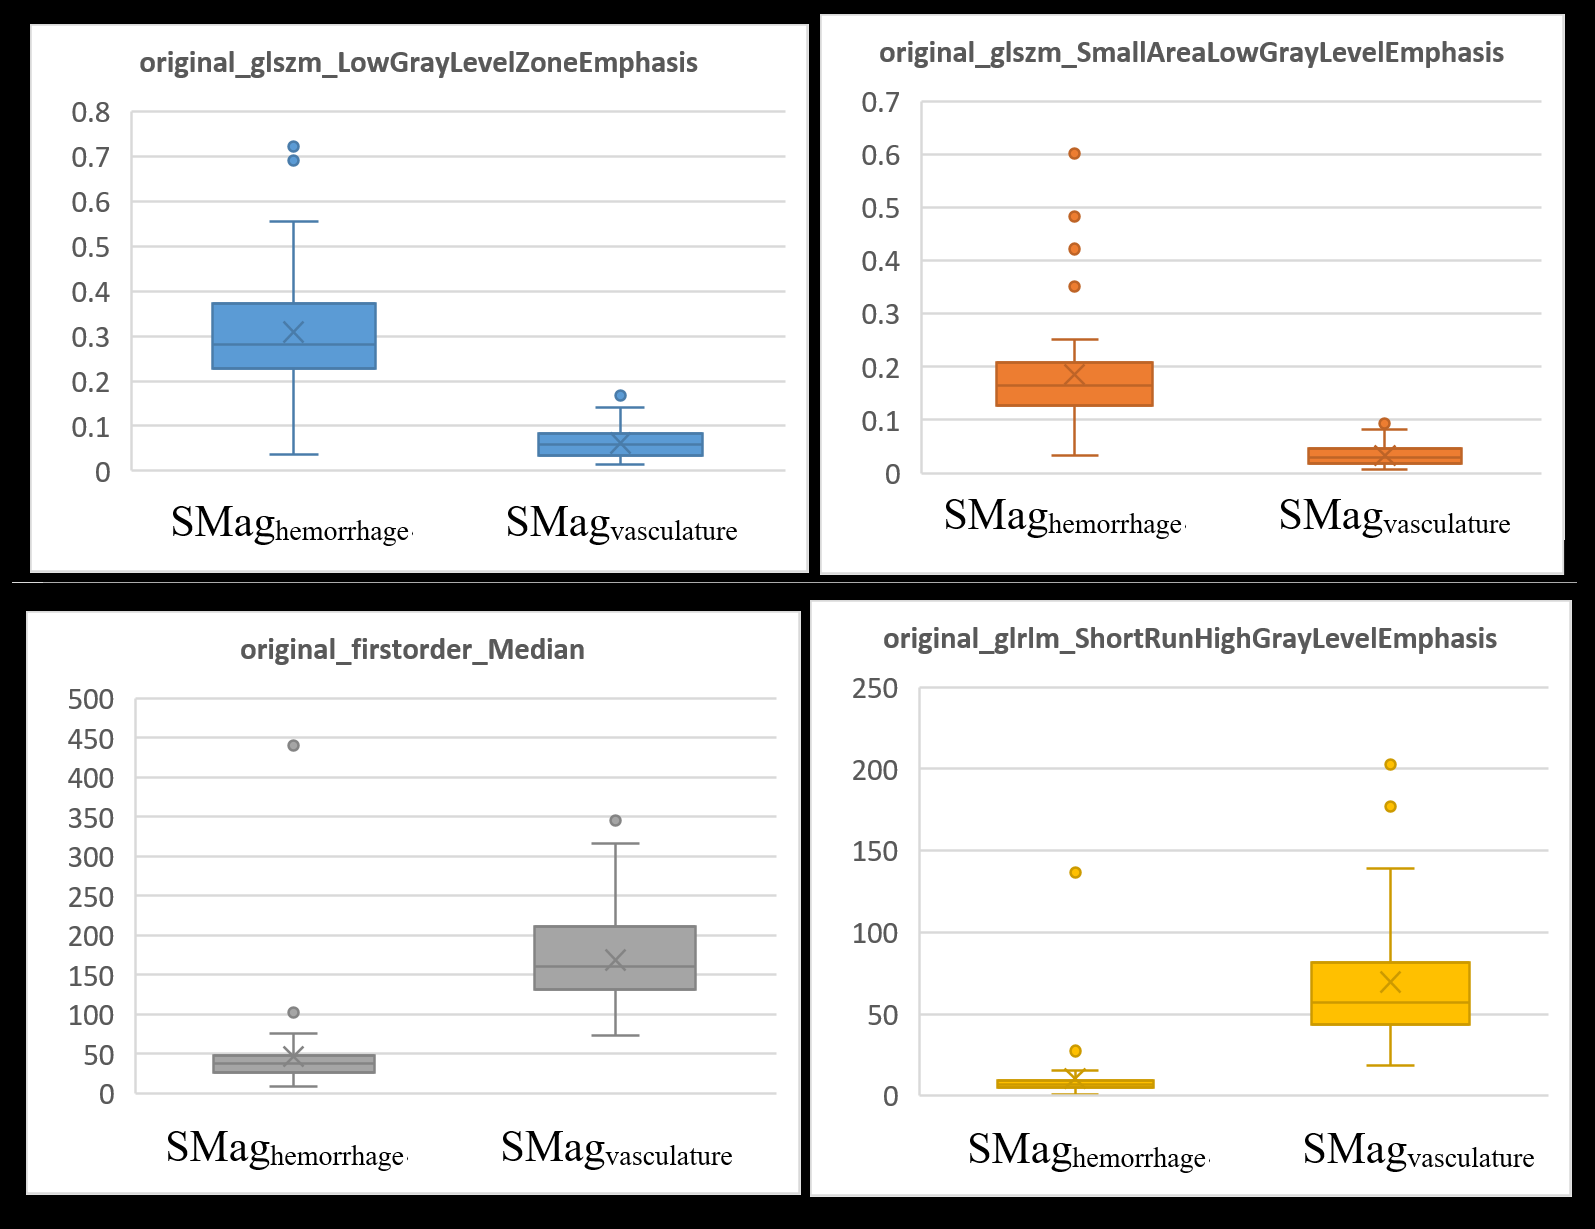
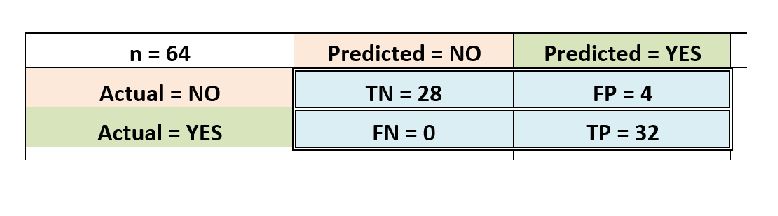
The results of random-forest based feature selection lists out total 21 radiomic features out of 120, to be significantly (p < 0.05) different between SMagvasculature and SMaghemorrhage. The list of the top ranked features and their individual importance values are listed in table-1. Random-forest classification using these 21 features obtains an accuracy of 93.75% in differentiating SMagvasculature and SMaghemorrhage. The Confusion-matrix is displayed in table-2. The Precision, Recall and F1-scores for classification are 88.88%, 100% and 93.33% respectively. Representative feature value comparisons between SMagvasculature and SMaghemorrhage for the top ranked four features are displayed in figure-2.Discussion and conclusion
Results of this study indicate that radiomic features obtained using PyRadiomics tool can significantly differentiate between 3Dvasculature and 3DHemorrhage mask regions in SWI-magnitude images. The prominent differentiating features (LowGrayLevelZoneEmphasis or SmallAreaLowGrayLevelEmphasis in GLSZM) represent a cluster of certain number of pixels in similar intensity value ranges. The high accuracy in machine-learning findings also conclude that irrespective of R2* map generation or quantitative ITSS assessment, the SWI-magnitude images inherently also contain radiomic properties that are significantly distinct from hemorrhage to vasculature. This is also one of the first studies that explores the vasculature and hemorrhage radiomic properties extracted from SWI-magnitude images through machine-learning in grade-IV GBM patients. This can further be extended to deep-learning model development or improving radiomic features based non-invasive glioma grading.Acknowledgements
The authors acknowledge Dr. Mamta Gupta for her contributons.References
[1] J. Saini et al., “Differentiation of grade II/III and grade IV glioma by combining ‘T1 contrast-enhanced brain perfusion imaging’ and susceptibility-weighted quantitative imaging,” Neuroradiology, pp. 1–8, 2017.
[2] M. J. Park, H. S. Kim, G. H. Jahng, C. W. Ryu, S. M. Park, and S. Y. Kim, “Semiquantitative assessment of intratumoral susceptibility signals using non-contrast-enhanced high-field high-resolution susceptibility-weighted imaging in patients with gliomas: Comparison with MR perfusion imaging,” Am. J. Neuroradiol., vol. 30, no. 7, pp. 1402–1408, 2009.
[3] R. Bhattacharjee, R. K. Gupta, R. Patir, S. Vaishya, S. Ahlawat, and A. Singh, “Quantitative vs. semiquantitative assessment of intratumoral susceptibility signals in patients with different grades of glioma,” J. Magn. Reson. Imaging, vol. 51, no. 1, pp. 225–233, 2020.
[4] G. Caruana et al., “Texture analysis in susceptibility-weighted imaging may be useful to differentiate acute from chronic multiple sclerosis lesions,” Eur. Radiol., 2020.
[5] S. L. M. Johns, A. Ishaque, M. Khan, Y. H. Yang, A. H. Wilman, and S. Kalra, “Quantifying changes on susceptibility weighted images in amyotrophic lateral sclerosis using MRI texture analysis,” Amyotroph. Lateral Scler. Front. Degener., vol. 20, no. 5–6, pp. 396–403, 2019.
[6] H. G. Kim, J. W. Choi, M. Han, J. H. Lee, and H. S. Lee, “Texture analysis of deep medullary veins on susceptibility-weighted imaging in infants: evaluating developmental and ischemic changes,” Eur. Radiol., vol. 30, no. 5, pp. 2594–2603, 2020.
[7] J. J. M. Van Griethuysen et al., “Computational radiomics system to decode the radiographic phenotype,” Cancer Res., vol. 77, no. 21, pp. e104–e107, 2017.
Figures