3248
Brain tissues have single-voxel signatures in multi-spectral MRI
Alexander German1, Angelika Mennecke1, Jan Martin2, Jannis Hanspach1, Andrzej Liebert1, Jürgen Herrler1, Tristan Anselm Kuder3, Manuel Schmidt1, Armin Nagel1, Michael Uder1, Arnd Dörfler1, Jürgen Winkler1, Moritz Zaiss1,4, and Frederik Laun1
1University Hospital Erlangen, Erlangen, Germany, 2Lund University, Lund, Sweden, 3German Cancer Research Center, Heidelberg, Germany, 4Max Planck Institute for Biological Cybernetics, Tübingen, Germany
1University Hospital Erlangen, Erlangen, Germany, 2Lund University, Lund, Sweden, 3German Cancer Research Center, Heidelberg, Germany, 4Max Planck Institute for Biological Cybernetics, Tübingen, Germany
Synopsis
We acquired diffusion-weighted and CEST data of the brain of 38 healthy volunteers. A MPRAGE and SWI based segmentation into 102 brain regions revealed unique diffusion and chemical MR signals on average. More importantly, we could infer these tissue classes form individual voxel data using a neural network. The revival of this old paradigm for tissue characterization from the 1990s points to the fact that unique MR signals of different brain regions exist and can be used to determine the tissue type voxel-wise. The approach as such is general and could unify the ever-growing diversity of MR contrasts.
Introduction
Since the seminal works by Brodmann and contemporaries, it is well-known that different brain regions exhibit unique cytoarchitectonic and myeloarchitectonic features.1 Transferring the approach of classifying brain tissues based on their intrinsic features to the realm of magnetic resonance (MR) is a longstanding endeavor.2 We explore the feasibility of performing global brain classification based on intrinsic MR features.Methods
We recruited 38 participants who provided written informed consent to participate in the study, which was approved by the local ethics committee. MRI acquisition and processing scans were acquired using a 7T MRI scanner (Magnetom Terra, Siemens Healthineers AG, Erlangen) with a 32-channel receive head coil and 8-channel parallel-transmit coil (ptx). Each scanning session consisted of a high-resolution 3D T1 MPRAGE scan and a gradient echo sequence with ASPIRE coil combination to generate susceptibility map-weighted images (SMWI).3 Subsequently, CEST MRI was acquired using a snapshot-GRE CEST sequence at two different saturation B1 levels, 0.7 and 1.0 μT, presaturated at 56 different offsets, respectively.4 For the Gaussian pre-saturation pulse train, multiple interleaved mode saturation (MIMOSA) was applied.5 Individual CEST peaks were fitted voxel-wise after coregistration using SPM.6 Diffusion-weighted images were acquired using a spin-echo EPI sequence7 with linear, planar, and spherical b-tensors and b-values 0, 100, 500, 1000, 1500, and 2000 s/mm2. The linear and planar b-tensors were rotated in 16 noncollinear diffusion directions. QTI parameters8 were fitted voxel-wise after coregistration using elastix.9 A segmentation of each brain into 102 anatomical regions was achieved by merging the segmentations obtained with automated cortical reconstruction and volumetric segmentation with the Freesurfer10 image analysis suite and manual segmentation on MPRAGE and SMWI for each participant. The classification approach is visualized in Fig. 1. A dataset was created from all participants except for one young man (the test participant). For each participant individually, 10% of the voxels of each anatomical region were randomly chosen from the MPRAGE space. For each chosen voxel, the local 15 QTI parameters, 210 raw b-tensor values, local four CEST parameters and 112 raw Z-spectrum values were extracted from the images, coregistered and interpolated to MPRAGE space and resolution using FSL11, and were saved to a 2D array with 6 million rows and 341 columns. The dataset was then shuffled, split, and normalized and no longer contained spatial or neighboring information. We defined a TensorFlow Keras dense neural network12 to predict one out of the 102 one-hot-encoded anatomical brain regions. The model had 52 million trainable parameters with 50% dropout. After training, the network was used to perform voxel-wise prediction for the test participant. The gross accuracy was calculated. To investigate the operating principle of DNN classification, we computed the normalized features of brain tissues averaged over all study participant and the saliency13 vectors averaged over the respective regions of the test participant.Results
Figure 2 shows the segmentation results obtained with our gold-standard segmentation. Fig. 3 shows the class-wise probability maps including the midbrain nuclei. Accurate detection of small structures in the midbrain like substantia nigra and nucleus ruber were particularly surprising. The confusion matrix of classification (Fig. 4) shows robust results for most subcortical brain nuclei and slight mixing-up between different cortical fields, white matter areas and between cortical field and subjacent white matter area, respectively. The gross accuracy was 60%. The confusions matched with explicit microstructural and chemical traits of brain regions, which showed highly individual patterns in brain nuclei and only subtly distinct patterns in the cortical fields and white matter areas (Fig. 5a). On average, each brain region has a unique signature of QTI and CEST parameters computed from the image raw data (Fig. 5a), which are just a subset of the input spectrum that also contained the raw image data. Fig. 5b shows the saliency vector for every region of the test dataset. For the precentral cortex (Fig.1 and region 48 in Fig. 5b), the DNN relied predominantly on magnetization transfer and very high offsets and the water pool resonance. Concordant saliency peaks at -4 ppm in both z-spectra shows that the DNN has discovered offset domains of the intramolecular NOE as a feature.Discussion
Extending earlier works on global brain classification,2 we included novel high-dimensional contrasts into the input data space. With the single-voxel classification approach, the spatial coherence of prediction results in adjacent voxels serves as an inherent metric of reliability (such as in Fig. 2). Current state-of-art atlas-based classifications approaches outperform the accuracy we observed.14 However, it is tempting to consider our MR-based patterns as analogous to histological tissue fingerprints. Potential confounders can be B0 or B1 inhomogeneities, which increase at 7T compared to lower field strengths. In the CEST preparation, we addressed the B1 inhomogeneity by means of the MIMOSA approach. In addition, B0 and B1 correction was performed employing acquired field maps. The approach as such is general and can be extended to unify the ever-growing diversity of MR contrasts.Conclusion
We show that mapping from voxel-intrinsic MR data to the brain tissue class to which the data belongs is possible. This indicates that unique MR signals of different brain regions exist.Acknowledgements
We thank Jasmin Burczyk, Molecular Neurology, for her support in providing contact to patients and Matthias Schäfer, Computer Science 7, for providing computational resources. This work was supported by the Interdisciplinary Center for Clinical Research Erlangen (IZKF-Erlangen, ELAN DR-17-12-14-1). AG received a MD thesis fellowship by the IZKF Erlangen. JW is a member of the research training group 2162 “Neurodevelopment and Vulnerabilityof the Central Nervous System” funded by the DFG–270949263/GRK2162. The work was further supported by a Heisenberg professorship from the DFG to FBL (DFG LA2804/6-1 and 2804/12-1).References
- Brodmann K. Vergleichende Lokalisationslehre der Großhirnrinde : in ihren Prinzipien dargestellt auf Grund des Zellenbaues. Leipzig: Johann Ambrosius Barth. 1909;X, 324 S. : Ill.
- Ozkan M, Dawant B M & Maciunas R J. Neural-network-based segmentation of multi-modal medical images: a comparative and prospective study. IEEE Transactions on Medical Imaging. 1993;12:534-544.
- Eckstein K, Dymerska B, Bachrata B et al. Computationally Efficient Combination of Multi-channel Phase Data From Multi-echo Acquisitions (ASPIRE). Magnetic resonance in medicine. 2018;79:2996-3006.
- Zaiss M, Ehses P & Scheffler K. Snapshot-CEST: Optimizing spiral-centric-reordered gradient echo acquisition for fast and robust 3D CEST MRI at 9.4 T. NMR in Biomedicine. 2018;31:e3879.
- Liebert A, Zaiss M, Gumbrecht R et al. Multiple interleaved mode saturation (MIMOSA) for B1+ inhomogeneity mitigation in chemical exchange saturation transfer. Magnetic resonance in medicine. 2019;82:693-705.
- Friston K J. Imaging neuroscience: Principles or maps? Proceedings of the National Academy of Sciences. 1998;95:796-802.
- Martin J, Endt S, Wetscherek A et al. Contrast-to-noise ratio analysis of microscopic diffusion anisotropy indices in q-space trajectory imaging. Z Med Phys. 2020;30:4-16.
- Westin C-F, Knutsson H, Pasternak O et al. Q-space trajectory imaging for multidimensional diffusion MRI of the human brain. NeuroImage. 2016;135:345-362.
- Nilsson M, Szczepankiewicz F, van Westen D & Hansson O. Extrapolation-Based References Improve Motion and Eddy-Current Correction of High B-Value DWI Data: Application in Parkinson's Disease Dementia. PloS one. 2015;10:e0141825.
- Fischl B. FreeSurfer. NeuroImage. 2012;62:774-781.
- Jenkinson M & Smith S. A global optimisation method for robust affine registration of brain images. Med Image Anal. 2001;5:143-156.
- Abadi M, Agarwal A, Barham P et al. TensorFlow: Large-scale machine learning on heterogeneous systems. 2015.
- Simonyan K, Vedaldi A & Zisserman A. Deep Inside Convolutional Networks: Visualising Image Classification Models and Saliency Maps. arXiv:1312.6034 (2013). <https://ui.adsabs.harvard.edu/abs/2013arXiv1312.6034S>.
- Iglesias J E & Sabuncu M R. Multi-atlas segmentation of biomedical images: A survey. Med Image Anal. 2015;24:205-219.
Figures
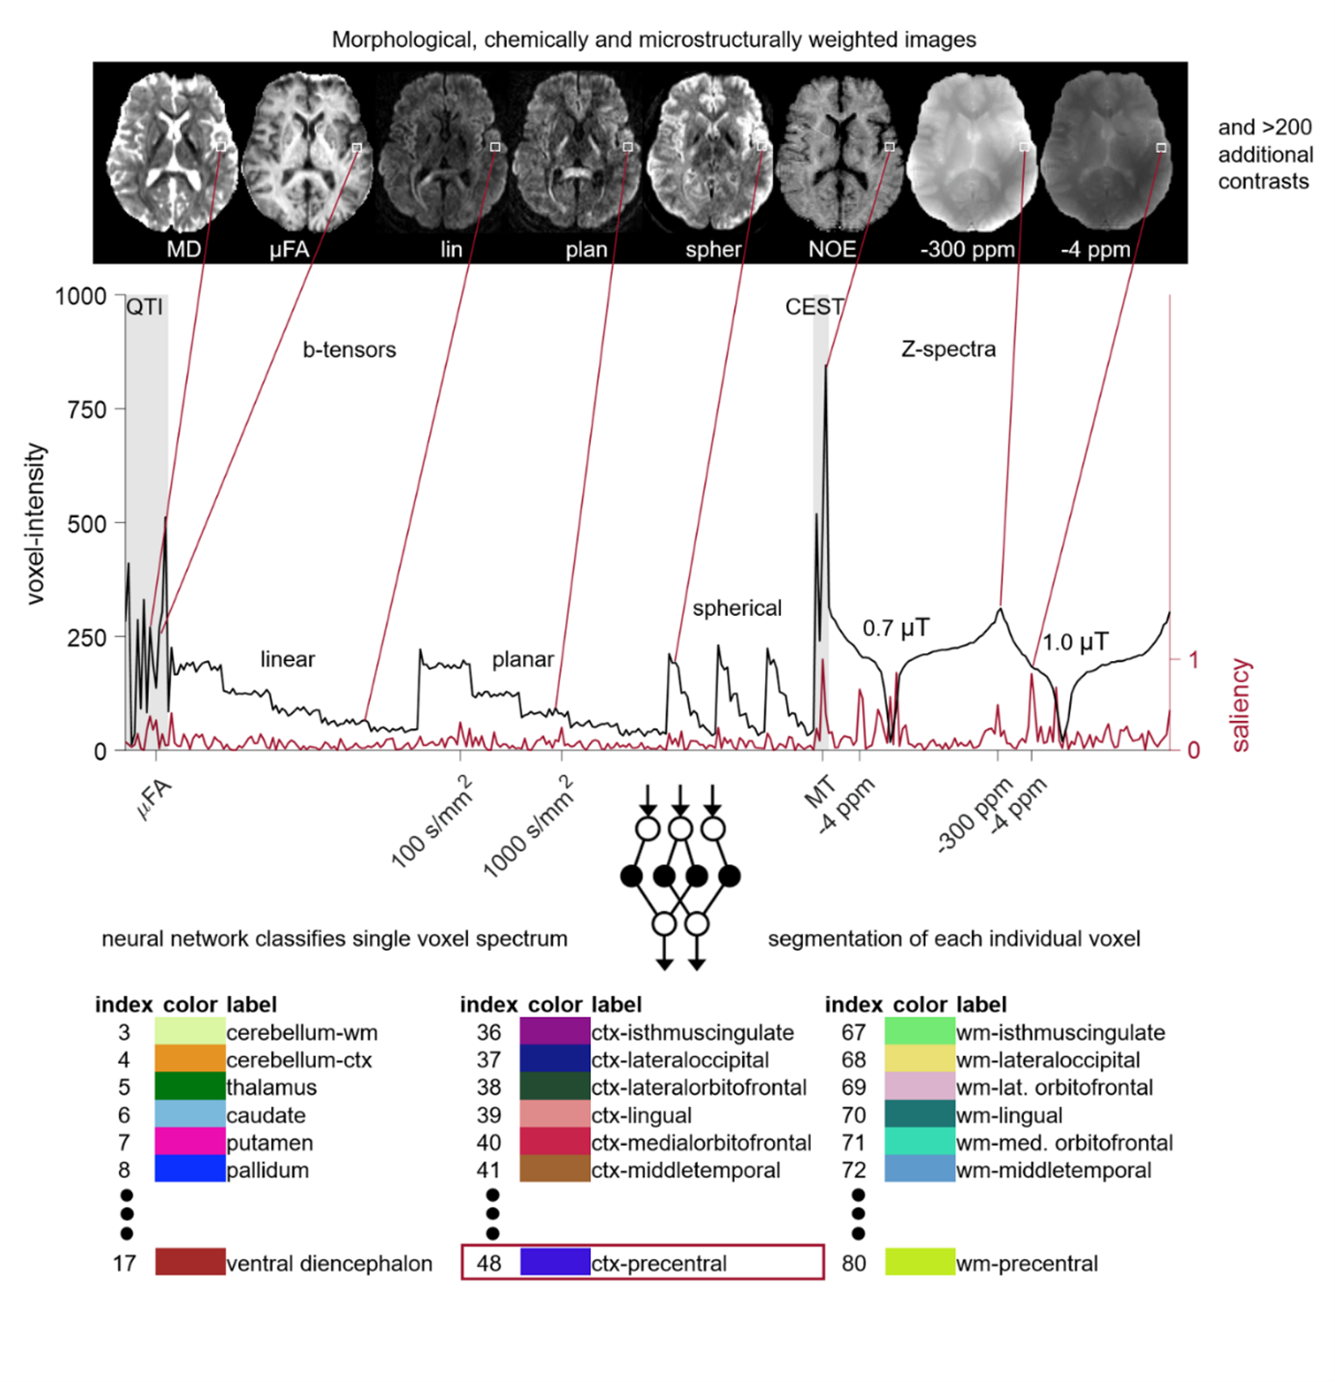
Fig. 1. Visualization of the
classification approach.
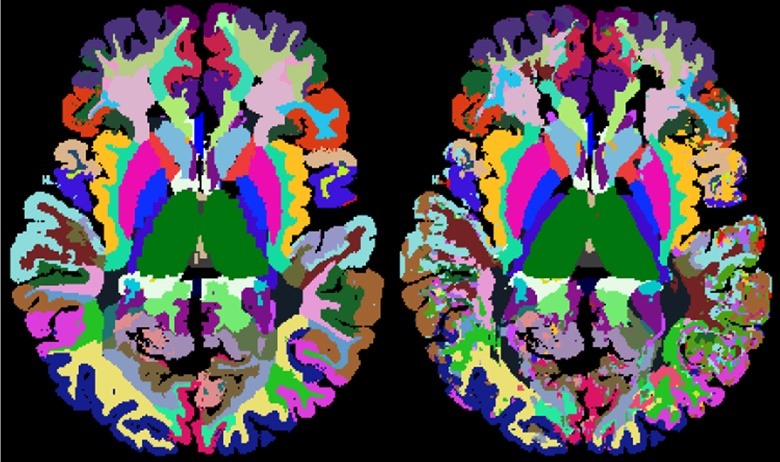
Fig. 2. Visualization of the segmentation. A slice from the test
participant is classified using single-voxel information only (right) and compared
to the gold-standard segmentation in the image domain (left).
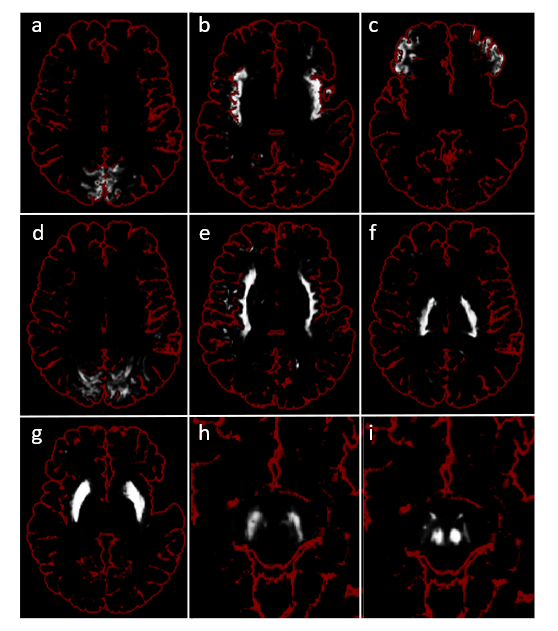
Fig. 3. Single-voxel
softmax probabilities of nine tissues. Output of the softmax
probability layer of the fitted neural network for each voxel of different
brain slices of the validation participant as grayscale intensity with brain
outline for orientation. a) ctx-cuneus; b) ctx-insula; c) ctx-parsorbitalis; d)
wm-cuneus; e) wm-insula; f) post. internal capsule; g) putamen; h) substantia nigra;
i) nucleus ruber. h) and i) were equally magnified from the same slice and
position in MPRAGE space.
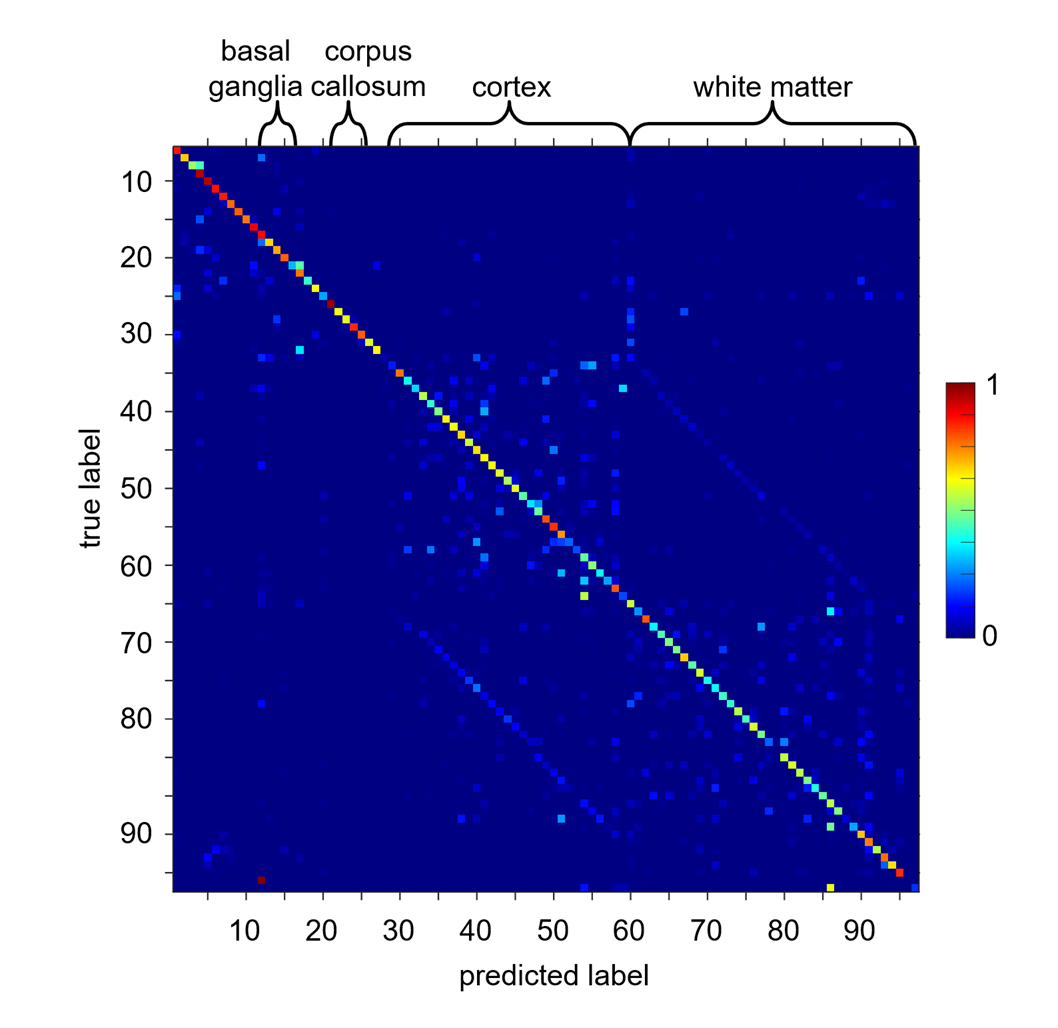
Fig. 4. Single-voxel
classification accuracy across brain tissues. Row normalized
confusion matrix of single-voxel classification and true labels as determined
by image segmentation. Square 28-59 corresponds to cortex areas, square 60-91
to white matter regions, the two diagonal parallel lines correspond to respective
cortex-white matter pairs. For detailed labels please refer to Fig. 1.
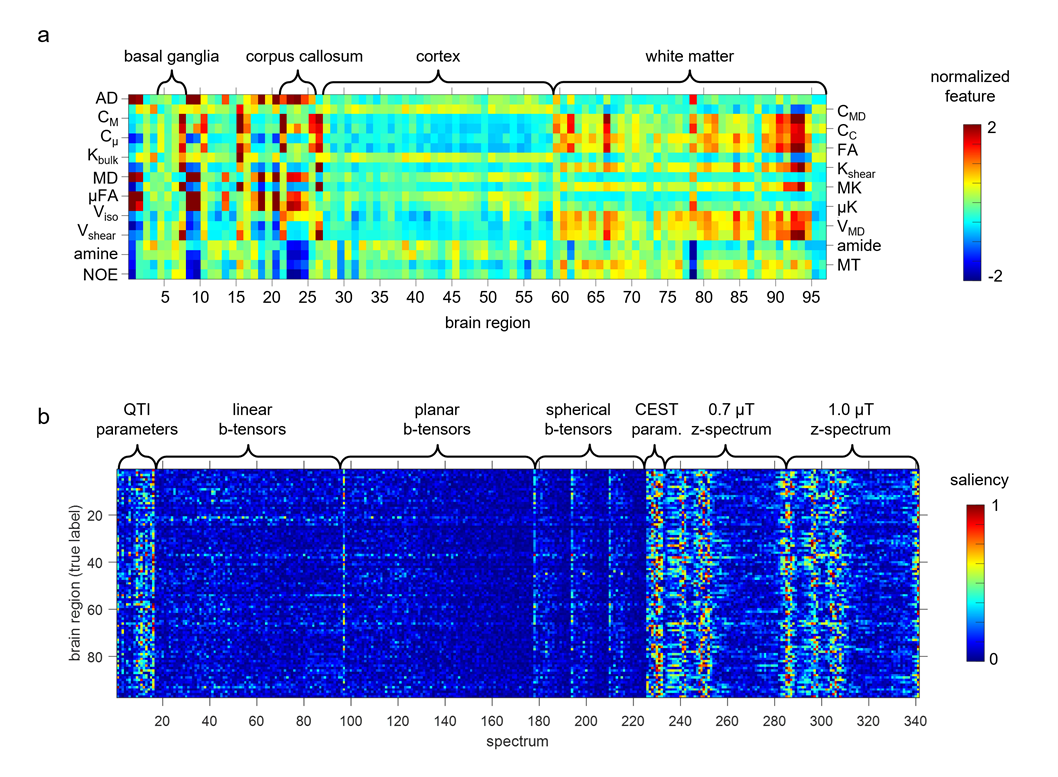
Fig. 5. Origin of the
segmentation accuracy and of confusions. a) Normalized microstructural and chemical features
of brain tissues, averaged over all voxels from all study participants. b)
Saliency vectors for brain tissues of the test subject.