3247
Importance of Clinical MRI Features in Predicting Epilepsy Drug Treatment Outcome for Pediatric Tuberous Sclerosis Complex1Research Centre for Medical AI, Shenzhen Institute of Advanced Technology, Chinese Academy of Sciences, Shenzhen, China, 2University of Chinese Academy of Sciences, Beijing, China, 3Department of Radiology, Shenzhen Children’s Hospital, Shenzhen, China, 4Paul C. Lauterbur Research Centre for Biomedical Imaging, Shenzhen Institute of Advanced Technology, Chinese Academy of Sciences, Shenzhen, China, 5Department of Neurology, Shenzhen Children’s Hospital, Shenzhen, China
Synopsis
Predicting epilepsy drug treatment outcome is important for treating children with tuberous sclerosis complex (TSC). Here, the best performing model was selected to explore the contribution of the features, using permutation importance (PIMP). An approach similar to PIMP was used to compare the magnetic resonance imaging (MRI) and non-MRI features. The best model multilayer perceptron (MLP) with a hidden layer size of 60 and 30 features selected by F-test achieved the best performance. The results based on 103 children patients showed that some features were more important than others, and MRI features contributed more than non-MRI features in prediction.
INTRODUCTION
TSC is caused by the mutation of the TSC1 or TSC2 genes 1, 2. Different symptoms may appear with the development of hamartomas in many organs 1. Almost 2/3 of the TSC patients with epilepsy have seizure onset in the first year of life, and 60% of them have drug-resistant epilepsy 3, leading to higher mortality 4. Therefore, to better treat TSC patients, it is important to predict drug-resistant epilepsy. Based on clinical experience, the locations and types of the cortical tubers have a certain relationship with the drug treatment outcomes, and machine learning models have been applied to predict the outcomes 5. However, the contributions of the features to the results are still unclear. In this study, we further improve the model performance and explore the feature contributions. The results based on 103 pediatric patients show that MRI features contribute more than non-MRI features.METHODS
The analysis of variance F-test was used for feature selection. Three models, including MLP 6, Naive Bayes, and random forest 7 were used for the prediction. PIMP and a similar method were used to explore the contribution of the features. The area under curve (AUC) was used as the evaluation metric in the experiments.The IRB approved data were obtained from 103 TSC children patients who had anti-epileptic drug (AED) treatments for at least one year, and consisted of MRI and non-MRI parts. Also, the brain was divided into 5 lobes, denoted as FL, PL, TL, OL, and IC. Cortical tubers were classified into 16 types based on medical knowledge, and each type of cortical tubers in each lobe was counted, respectively. These numbers were used as features whose naming formats were Lobe-Type. Other clinical features were also added, to get better performance. Furthermore, the target was whether epilepsy had been controlled by the AEDs.
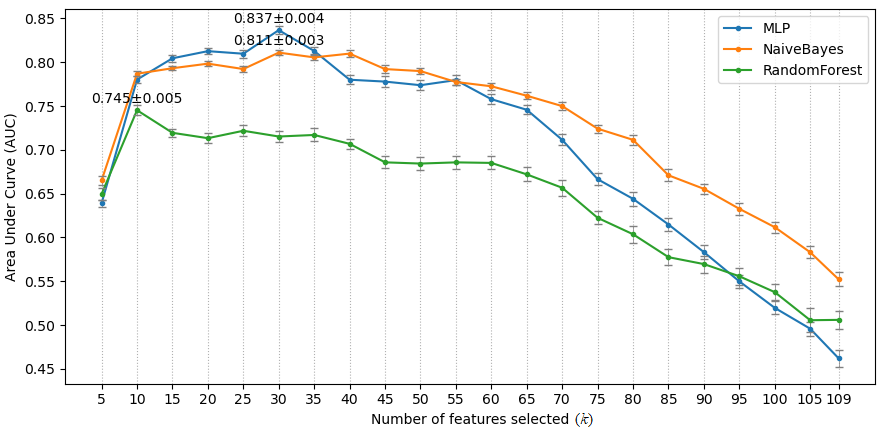
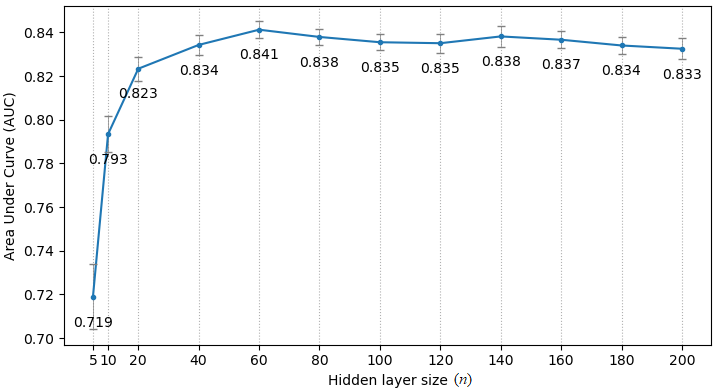
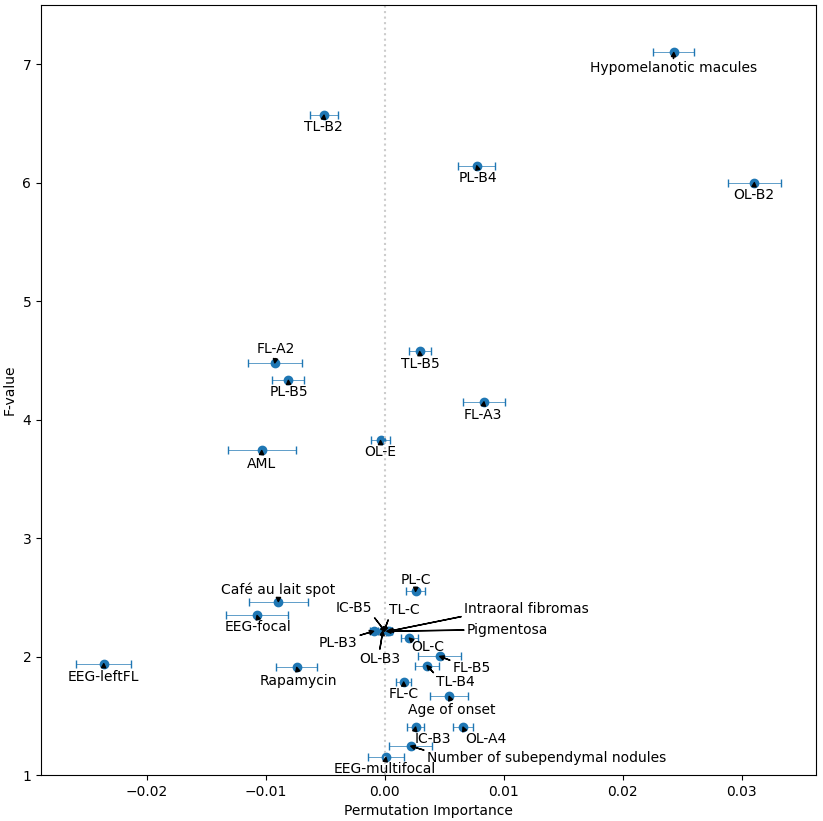
Experiments were implemented using Scikit-learn 8. Stratified 10-fold cross-validation was used. Every experiment was repeated 50 times to calculate the mean value and 95% confidence interval (CI) of the AUCs. Initially, the hyper-parameters of the three models were kept at default. Multinomial Naive Bayes was used because the MRI features were lesion counts, and other features were natural numbers or had been converted. The number of features selected by F-test is denoted as k. Due to the small amount of data, making a trade-off on k was needed. Multiple k, ranging from 5 to 109, were tried on the 3 models. The best model MLP with k = 30, was selected for the following experiment. The number of the hidden layer size of the MLP is denoted as n. Similarly, a trade-off was made on the value of n. Multiple n, ranging from 5 to 200, were evaluated. Then, the best performing n was selected for the next experiment. The PIMP of feature f is the decrease in model performance after randomly permuting f. The PIMPs of the selected 30 features were calculated. For comparison, their F-values in the feature selection step were gathered. Based on the idea of PIMP, the MRI and non-MRI features were permuted in two settings. For comparison, two additional settings were added, one of which permuted all features, and the other did nothing. Then the receiver operating characteristic (ROC) curves of the four settings were calculated.
RESULTS & DISCUSSION
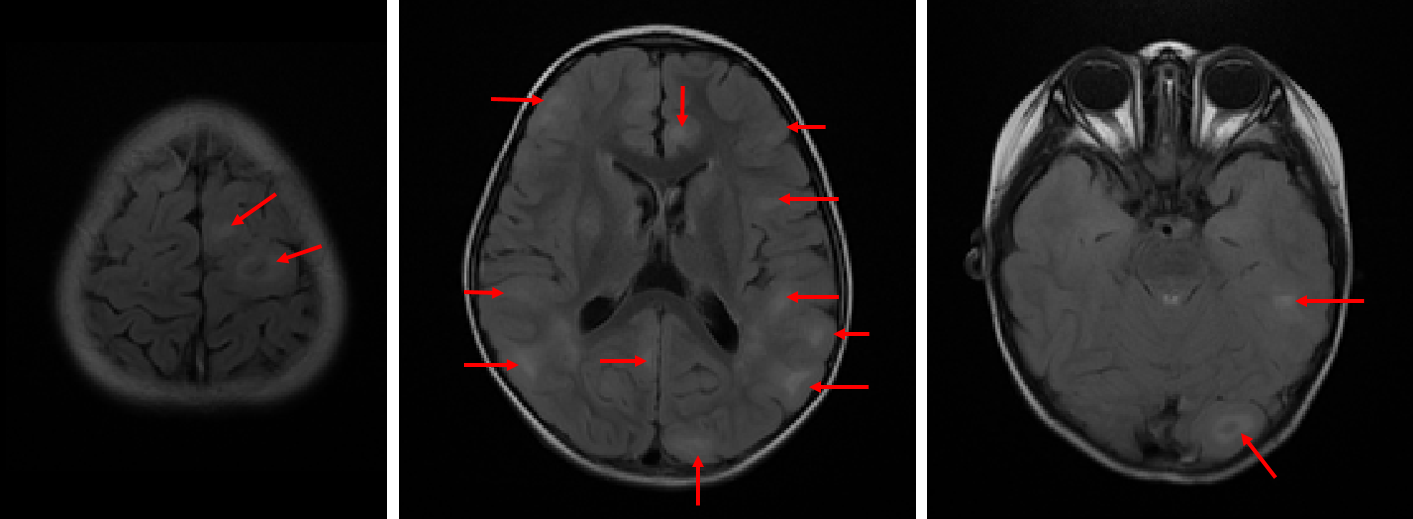
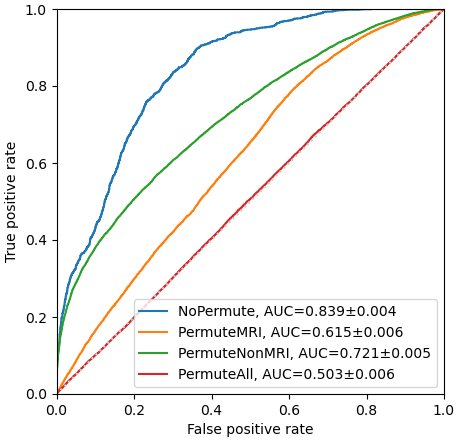
Fig. 1 shows an example of cortical tubers observed in an MRI of a pediatric TSC patient. The AUCs of the three models with different k are shown in Fig. 2. The highest AUCs (95% CI) of MLP, Naïve Bayes, and random forest, were 0.837 (±0.004) at k=30, 0.811 (±0.003) at k=30, and 0.745 (±0.005) at k=10, respectively. Also, the AUCs of the MLP with different n are shown in Fig. 3, and the highest AUC (95% CI) was 0.841 (±0.004), at n=60. Furthermore, the PIMPs and F-values of the selected 30 features are shown in Fig. 4. The top 3 features of PIMP were OL-B2 (of 0.031), hypomelanotic macules (of 0.024), and FL-A3 (of 0.0084), where the importance increases with the PIMP. Meanwhile the top 3 features of F-values were hypomelanotic macules, TL-B2, and PL-B4. The results showed that a higher F value does not necessarily mean higher PIMP. There were 20 MRI features and 10 non-MRI features in the 30 selected features. The ROC curves of the four settings are shown in Fig. 5. The AUC of permuting MRI features (0.615) was lower than permuting non-MRI features (0.721). Based on this, we can consider that MRI features were more important than non-MRI features in prediction.CONCLUSION
The model MLP with 60 neurons in the hidden layer and using 30 features selected by F-test achieves the best AUC in predicting epilepsy drug treatment outcome for TSC children patients. Also, the PIMPs of the selected 30 features were calculated, and the results based on 103 pediatric patients show that some features are more important than others. Especially, among the selected 30 features, MRI features contribute more than non-MRI features in prediction.Acknowledgements
Some of the work was partially supported by the Sanming Project of Medicine in Shenzhen (SZSM201812005), the Shenzhen Peacock Plan Team Program (KQTD20180413181834876), and the Natural Science Foundation of Guangdong Province (2018A0303130132).References
1. M. Słowińska, S. Jóźwiak, A. Peron, J. Borkowska, D. Chmielewski, K. Sadowski, E. Jurkiewicz, A. Vignoli, F. L. Briola, M. P. Canevini, and K. Kotulska-Jóźwiak, “Early diagnosis of tuberous sclerosis complex: a race against time. How to make the diagnosis before seizures?,” Orphanet Journal of Rare Diseases, vol. 13, no. 1, 2018.
2. K. A. Orlova and P. B. Crino, “The tuberous sclerosis complex,” Annals of the New York Academy of Sciences, vol. 1184, no. 1, pp. 87–105, 2010.
3. M. Fohlen, D. Taussig, S. Ferrand-Sorbets, M. Chipaux, N. Dorison, O. Delalande, and G. Dorfmüller, “Refractory epilepsy in preschool children with tuberous sclerosis complex: Early surgical treatment and outcome,” Seizure, vol. 60, pp. 71–79, 2018.
4. S. An, K. Malhotra, C. Dilley, E. Han-Burgess, J. N. Valdez, J. Robertson, C. Clark, M. B. Westover, and J. Sun, “Predicting drug-resistant epilepsy — A machine learning approach based on administrative claims data,” Epilepsy & Behavior, vol. 89, pp. 118–125, 2018.
5. J. Yang, C. Zhao, S. Su, D. Liang, Z. Hu, H. Wang, H. Liao. “Machine Learning in Epilepsy Drug Treatment Outcome Prediction Using Multi-modality Data in Children with Tuberous Sclerosis Complex,” Proc. of the 6th International Conference on Big Data and Information Analytics (BigDIA), Shenzhen, China, pp. 100-103, Dec. 2020.
6. K. Hornik, M. Stinchcombe, and H. White, “Multilayer feedforward networks are universal approximators,” Neural Networks, vol. 2, no. 5, pp. 359–366, 1989.
7. L. Breiman, “Random Forests,” Machine Learning, vol. 45, no. 1, pp. 5–32, 2001.
8. F. Pedregosa, G. Varoquaux, A. Gramfort, V. Michel, B. Thirion, O. Grisel, M. Blondel, P. Prettenhofer, R. Weiss, V. Dubourg, J. Vanderplas, A. Passos, D. Cournapeau, M. Brucher, M. Perrot, and E. Duchesnay. Scikit-learn: Machine learning in Python. Journal of Machine Learning Research, vol. 12, pp. 2825–2830, 2011.
Figures