3246
No-Reference Quality Assessment of MRIs for Clinical Application
Ke Lei1, Shreyas Vasanawala2, and John Pauly1
1Electrical Engineering, Stanford University, Stanford, CA, United States, 2Radiology, Stanford University, Stanford, CA, United States
1Electrical Engineering, Stanford University, Stanford, CA, United States, 2Radiology, Stanford University, Stanford, CA, United States
Synopsis
We proposed a CNN model that automatically assesses image quality within seconds after a scan is finished to reduce the number of patient recalls and inadequate images. Our model is deployed to the clinics where it alerts technicians to take action for low-quality images while the patient is still in the scanner. Our model achieves super-human performance on assessing perceptual noise level in 2D fast spin echo (FSE) MRIs. It can also be used to automatically guide other computational processes, like training of a denoising model or choice of a regularization weight for reconstruction.
Introduction
In a busy clinical settings it can be difficult to review all of images during the study. Often the first image assessments are several days later when the radiologist reads the study for diagnosis. At this point, if the image is of low quality (i.e., has a low SNR or motion corrupted), either the patient is called back for rescan or the radiologist has to contend with the poor image quality. We propose a neural network (NN) based model to assess the image quality right after each scan is finished. The technician can then take action while the patient is still in the scanner. Our model can also be used to automatically guide other computational processes, like training a denoising model or choosing a regularization weight for reconstruction. Our model exceeds human performance in assessing perceptual noise level in fast spin echo (FSE) MRIs.Methods: Training
Our model is a supervised convolutional NN that takes a 2D image and outputs a scalar score. We first need to define the target/label scalar score to use for training. In most existing no-reference image quality assessment tasks1,2, a label score for every single image is generated from multiple objective scores given by different raters. This approach for defining the training label is labor heavy. We want our model to learn from radiologist input while keeping the labeling workload manageable.For images in the training set, we take an unmodified image $$$x^{[5]}_i$$$ and inject four levels of while Gaussian noise in its k-space to generate $$$x^{[v]}_i,\ v=1, ..., 4$$$. For labels in the training set, we first use general no-reference assessment algorithms, $$$Q(\cdot)$$$, to automatically generate heuristic scores for each image in the training set, then collect one human label $$$h_i\in\{1, ..., 6\}$$$ per set of five images $$$x^{[v]}_i,\ v=1, ..., 5$$$ to refine/calibrate the heuristic scores (see Fig.1). The estimate-then-calibrate process is define as follows:
$$y^{[v]}_i=Q(x^{[v]}_i)\\ \mu=\frac{1}{n}\sum^n_{i=1}y_i^{[h_i]}\\ \hat{y}\ ^{[v]}_i=y^{[v]}_i+\eta\big(\mu-y_i^{[h_i]}\big),\ h_i\leq 5\\ \hat{y}\ ^{[v]}_i=y^{[v]}_i+\eta\big(\mu-2y_i^{[5]}+y_i^{[4]}\big),\ h_i=6$$
where $$$\hat{y}$$$ and $$$y$$$ are the heuristic and calibrated label scores, $$$h_i$$$ is the version with the minimum satisfactory signal to noise level, $$$\eta$$$ is a calibration strength coefficient which controls how close we want the scores of all selected slices to be. The training loss is the mean-square error between the model output and the label.
Methods: Inference
Once a model is trained, we use image rulers (Fig.2) to interpret its scalar output for human users. The intuition for using an image ruler to bridge model and human interpretation is that images from the same type of scan with similar quality should get similar scores from our trained model. We get reference scores $$$r^{[v]}=M(x^{[v]}_r),\ v=0,...,7$$$ by inference on the image ruler so that we can match a test image to one of the eight versions in the ruler by:$$class=\arg\!\min_v|r^{[v]}-M(x_{test})|$$
Then the class of 0-7 can be interpreted by referring to the images in a ruler. A radiologist can pick a preferred threshold from the image ruler for a pass/fail classification. With the scalar output and the image ruler, we have the flexibility of changing the standard for classification tasks for different types of scan $$$-$$$ only need to modify the ruler image and thresholds instead of re-training the model.
When the model is deployed on a scanner, two plots in Fig.3 are shown to the technicians for an overview of the quality of a stack of slices.
Results
Our test set consists of 452 FSE slices with various contracts from seven anatomies. To generate ground-truth labels for the test, we ask two radiologists to match each test image to one version in the image ruler with the nearest level of noise and indicate a threshold in each image ruler for the pass/fail classification. The 8-way classification performance is an indicator of the model performance with varying thresholds. We evaluate human performance by comparing the sets of labels independently given by two radiologists.Table I shows the accuracy and 8-way class error ($$$|true\_class-predicted\_class|$$$) for the binary and 8-way classification tasks, respectively. Our model is compared with two non-learning-based statistical methods3,4, and three learning-based methods5-7. We then compare our model trained with uncalibrated scores and calibrated scores, where the uncalibrated scores are given by two existing methods. Both sets of comparisons prove the effectiveness of the proposed calibration step. We find $$$\eta=0.85$$$ to be the optimal calibration coefficient. Fig.4 shows the confusion matrices from our best performing model. Our NN model consists of four convolutional layers completed with one fully-connected layer. We use a biological vision model8 inspired divisive normalization transform9 as the activation function.
Conclusion
We proposed a CNN model that automatically assesses image quality within seconds after a scan is done to reduce the number of patient recalls and inadequate images. No referencing image is used in either training or testing.We are deploying the proposed model on clinical scanners and collecting feedback from the real clinical environment. Other ongoing works include training the model on motion corrupted images and training a model to simultaneously detect motion and noise in images. We will also apply the model for supervising the training of a reconstruction network.
Acknowledgements
Work in this paper was supported by the NIH R01EB009690 and NIH R01EB026136 award, and GE Precision Healthcare. The labeling graphic interface is developed by Cedric Yue Sik Kin. The MRI raw data used for training and testing is collected at Stanford Lucile Packard Children's Hospital and managed by Marcus Alley.References
- Sheikh H R, Sabir M F, Bovik A C. A statistical evaluation of recent full reference image quality assessment algorithms. IEEE Transactions on Image Processing, vol. 15, no. 11, pp. 3440-3451, Nov. 2006.
- Ponomarenko N, et al. Image database TID2013: Peculiarities results and perspectives. Signal Process. Image Commun., vol. 30, pp. 57-77, Jan. 2015.
- Liu X, Tanaka M, Okutomi M. Noise level estimation using weak textured patches of a single noisy image. 19th IEEE International Conference on Image Processing, Orlando, FL, 2012, pp. 665-668.
- Ponomarenko M, Gapon N, Voronin V, Egiazarian K. Blind estimation of white Gaussian noise variance in highly textured images. CoRR, vol. abs/1711.10792, 2017.
- Xue W, Zhang L, Mou X. Learning without human scores for blind image quality assessment. Proc. IEEE Conf. Comput. Vis. Pattern Recognit., pp. 995-1002, Jun. 2013.
- Zhang L, Bovik A C. A feature-enriched completely blind image quality evaluator. IEEE Trans. Image Process., vol. 24, no. 8, pp. 2579-2591, Aug. 2015.
- Ma K, Liu W, Zhang K, Duanmu Z, Wang Z, Zuo W. End-to-End Blind Image Quality Assessment Using Deep Neural Networks. IEEE Transactions on Image Processing, vol. 27, no. 3, pp. 1202-1213, March 2018, doi: 10.1109/TIP.2017.2774045.
- Carandini M, Heeger D J. Normalization as a canonical neural computation. Nature Rev. Neurosci., vol. 13, pp. 51-62, Jan. 2012.
- Ballé J, Laparra V, Simoncelli E P. Density modeling of images using a generalized normalization transformation. 4th International Conference on Learning Representations, ICLR 2016, San Juan, Puerto Rico.
Figures
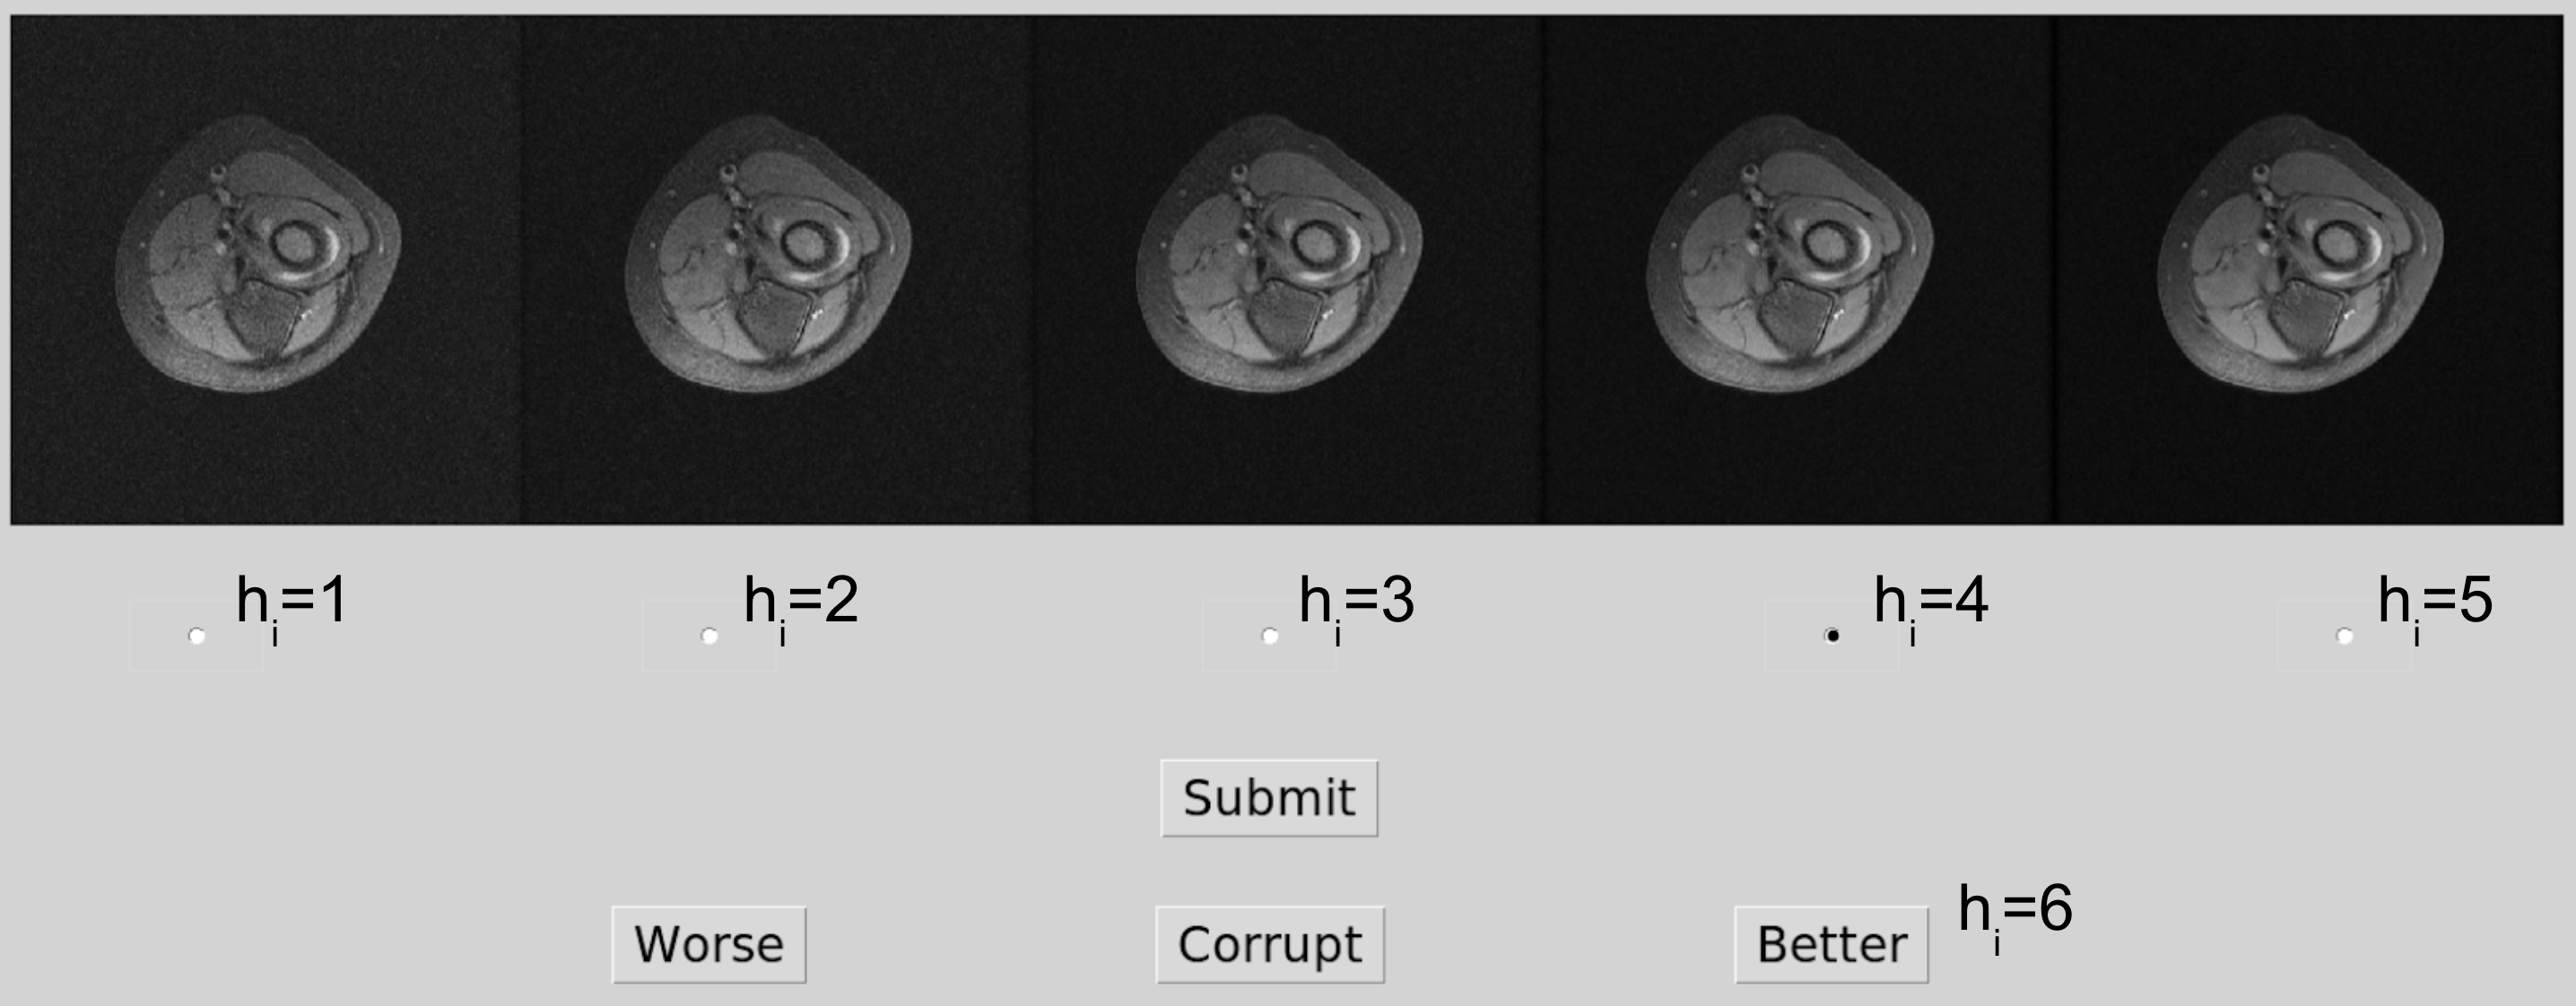
Figure 1. Training set labeling.
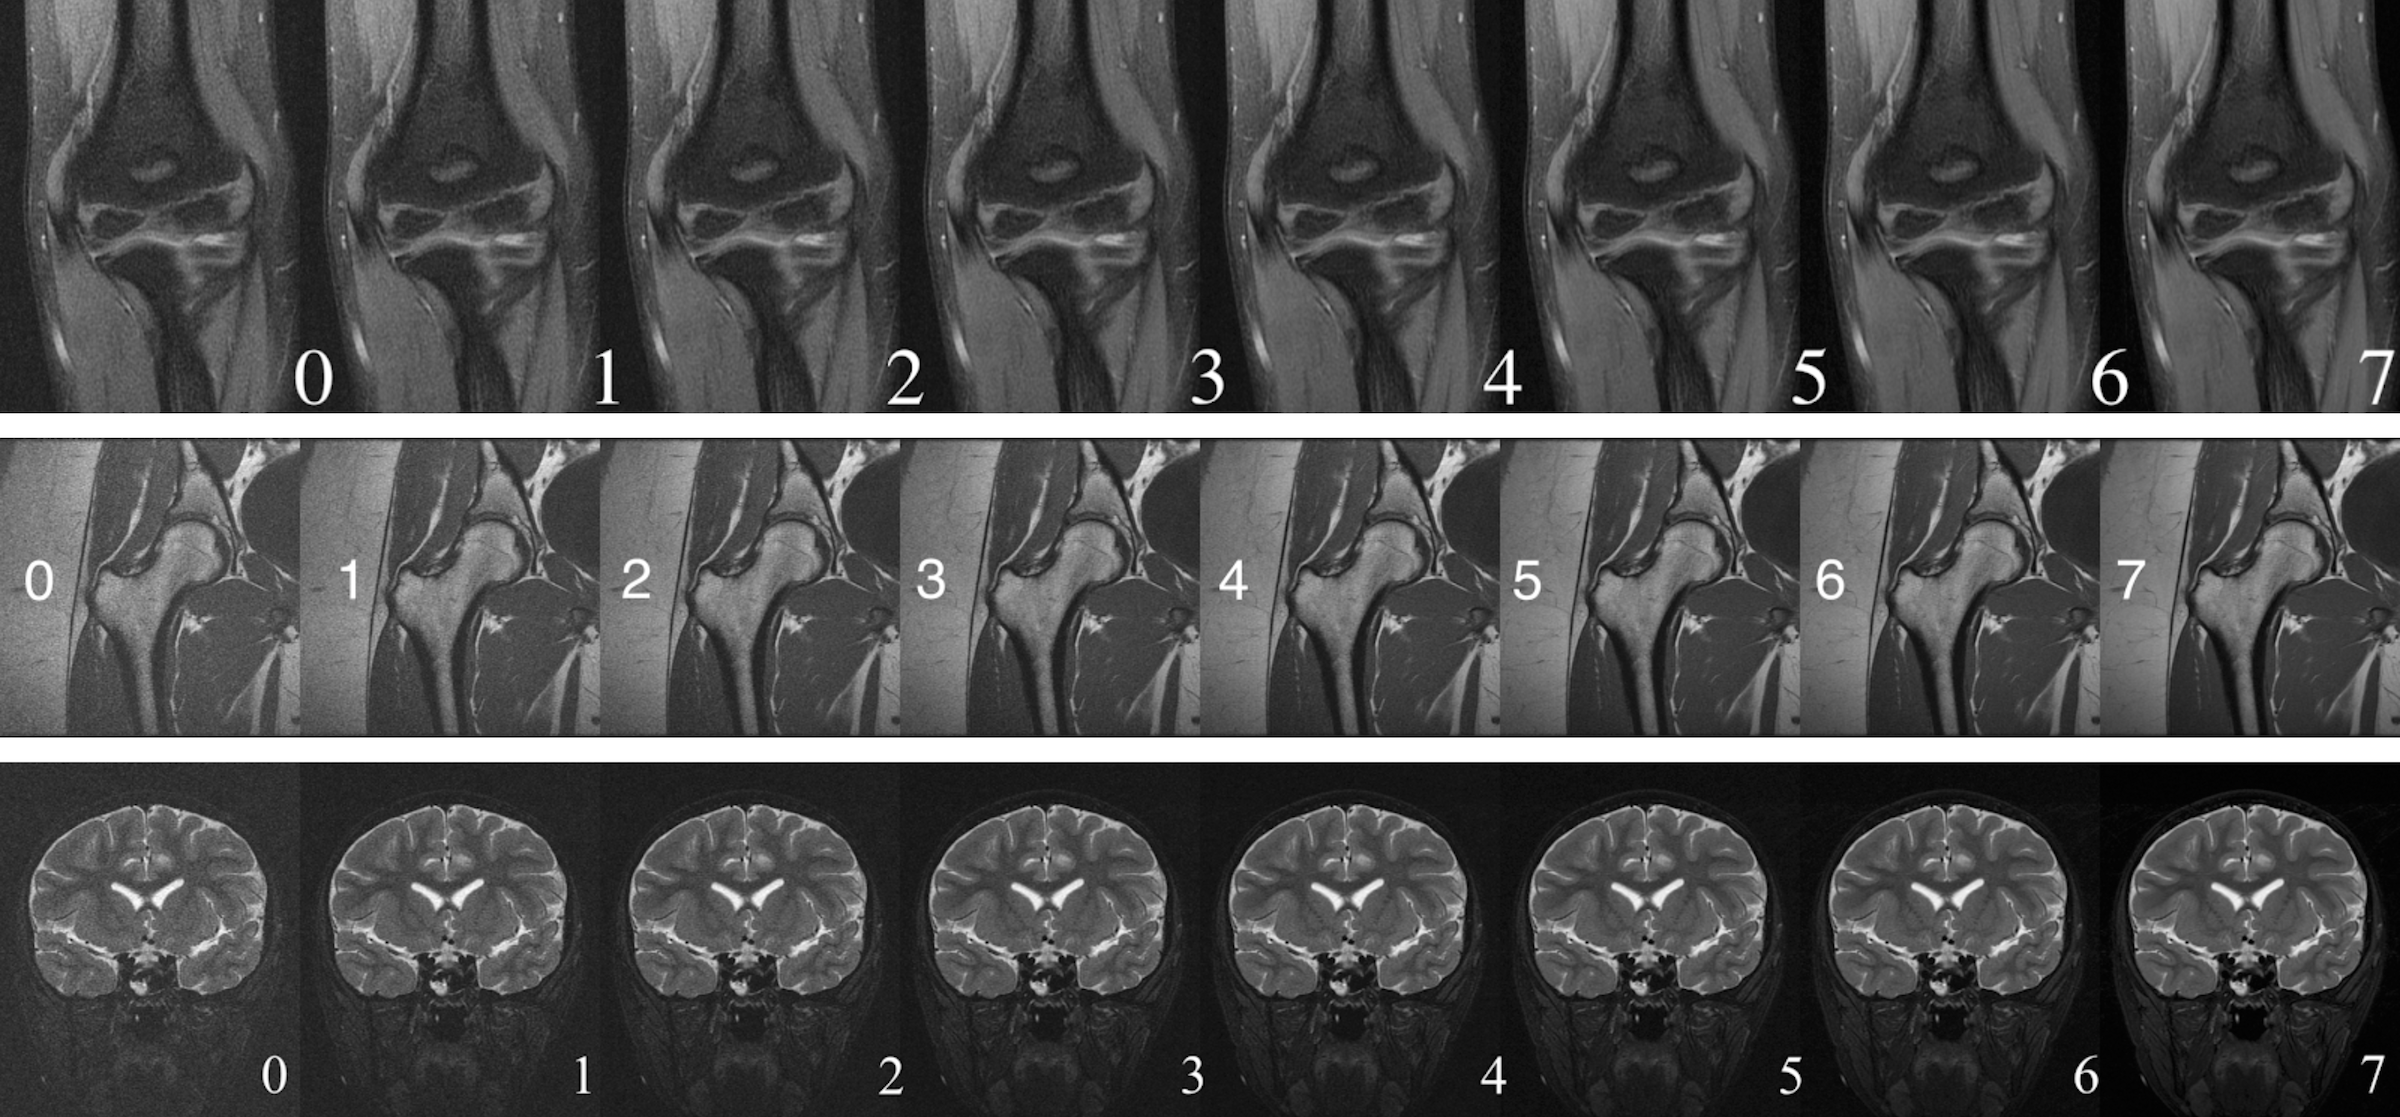
Figure 2. Three samples of the nine image rulers in use. From top to bottom: for F/S elbow, hip, and F/S brain scans.
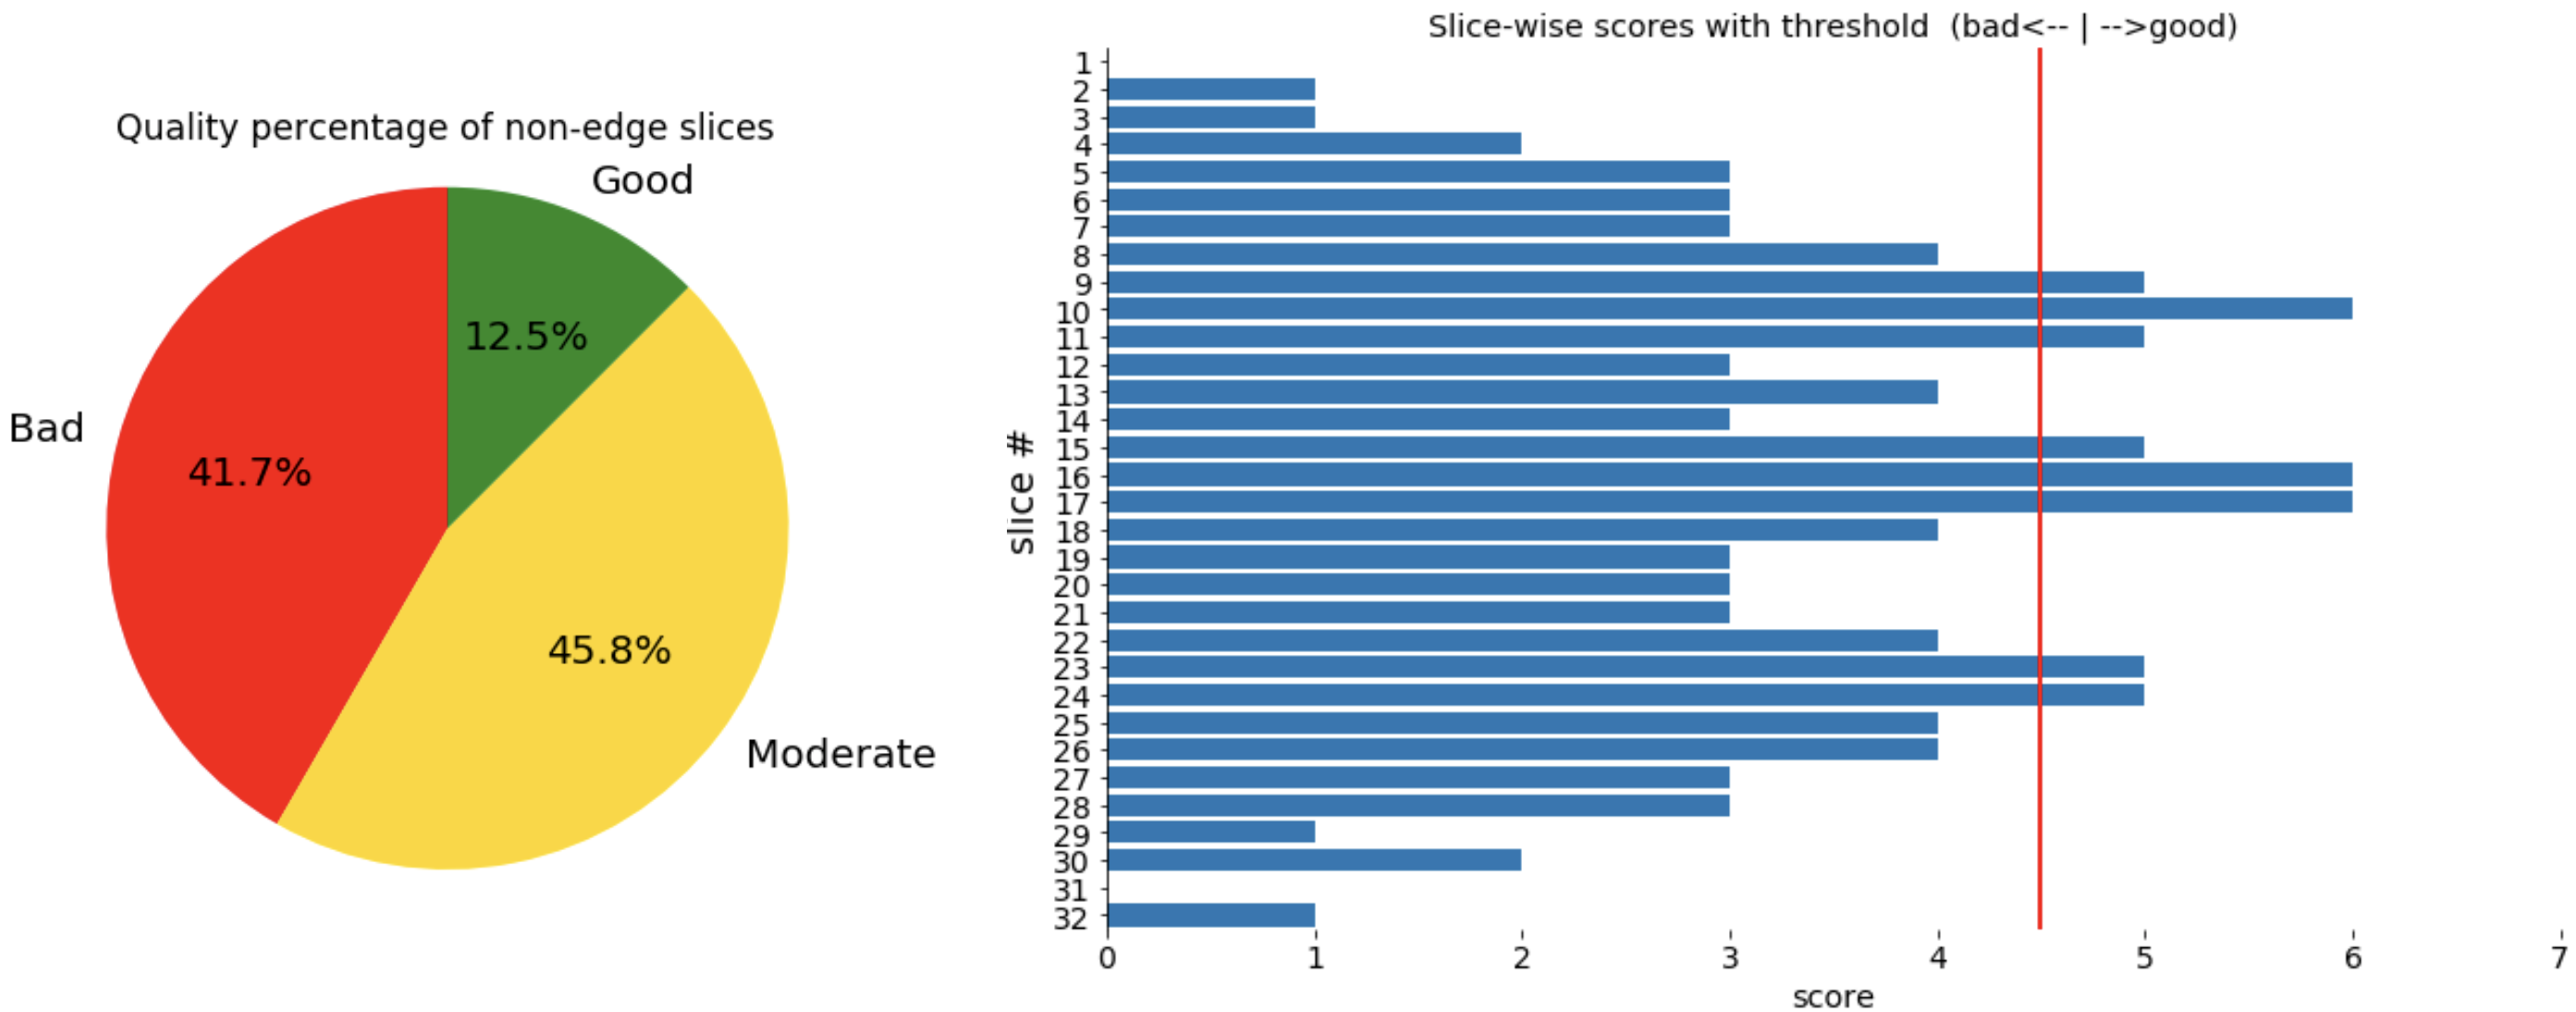
Figure 3. Plots shown to technicians on scanner. The red threshold line is chosen by radiologists, and the two class scores around it are defined as moderate for the pie chart.
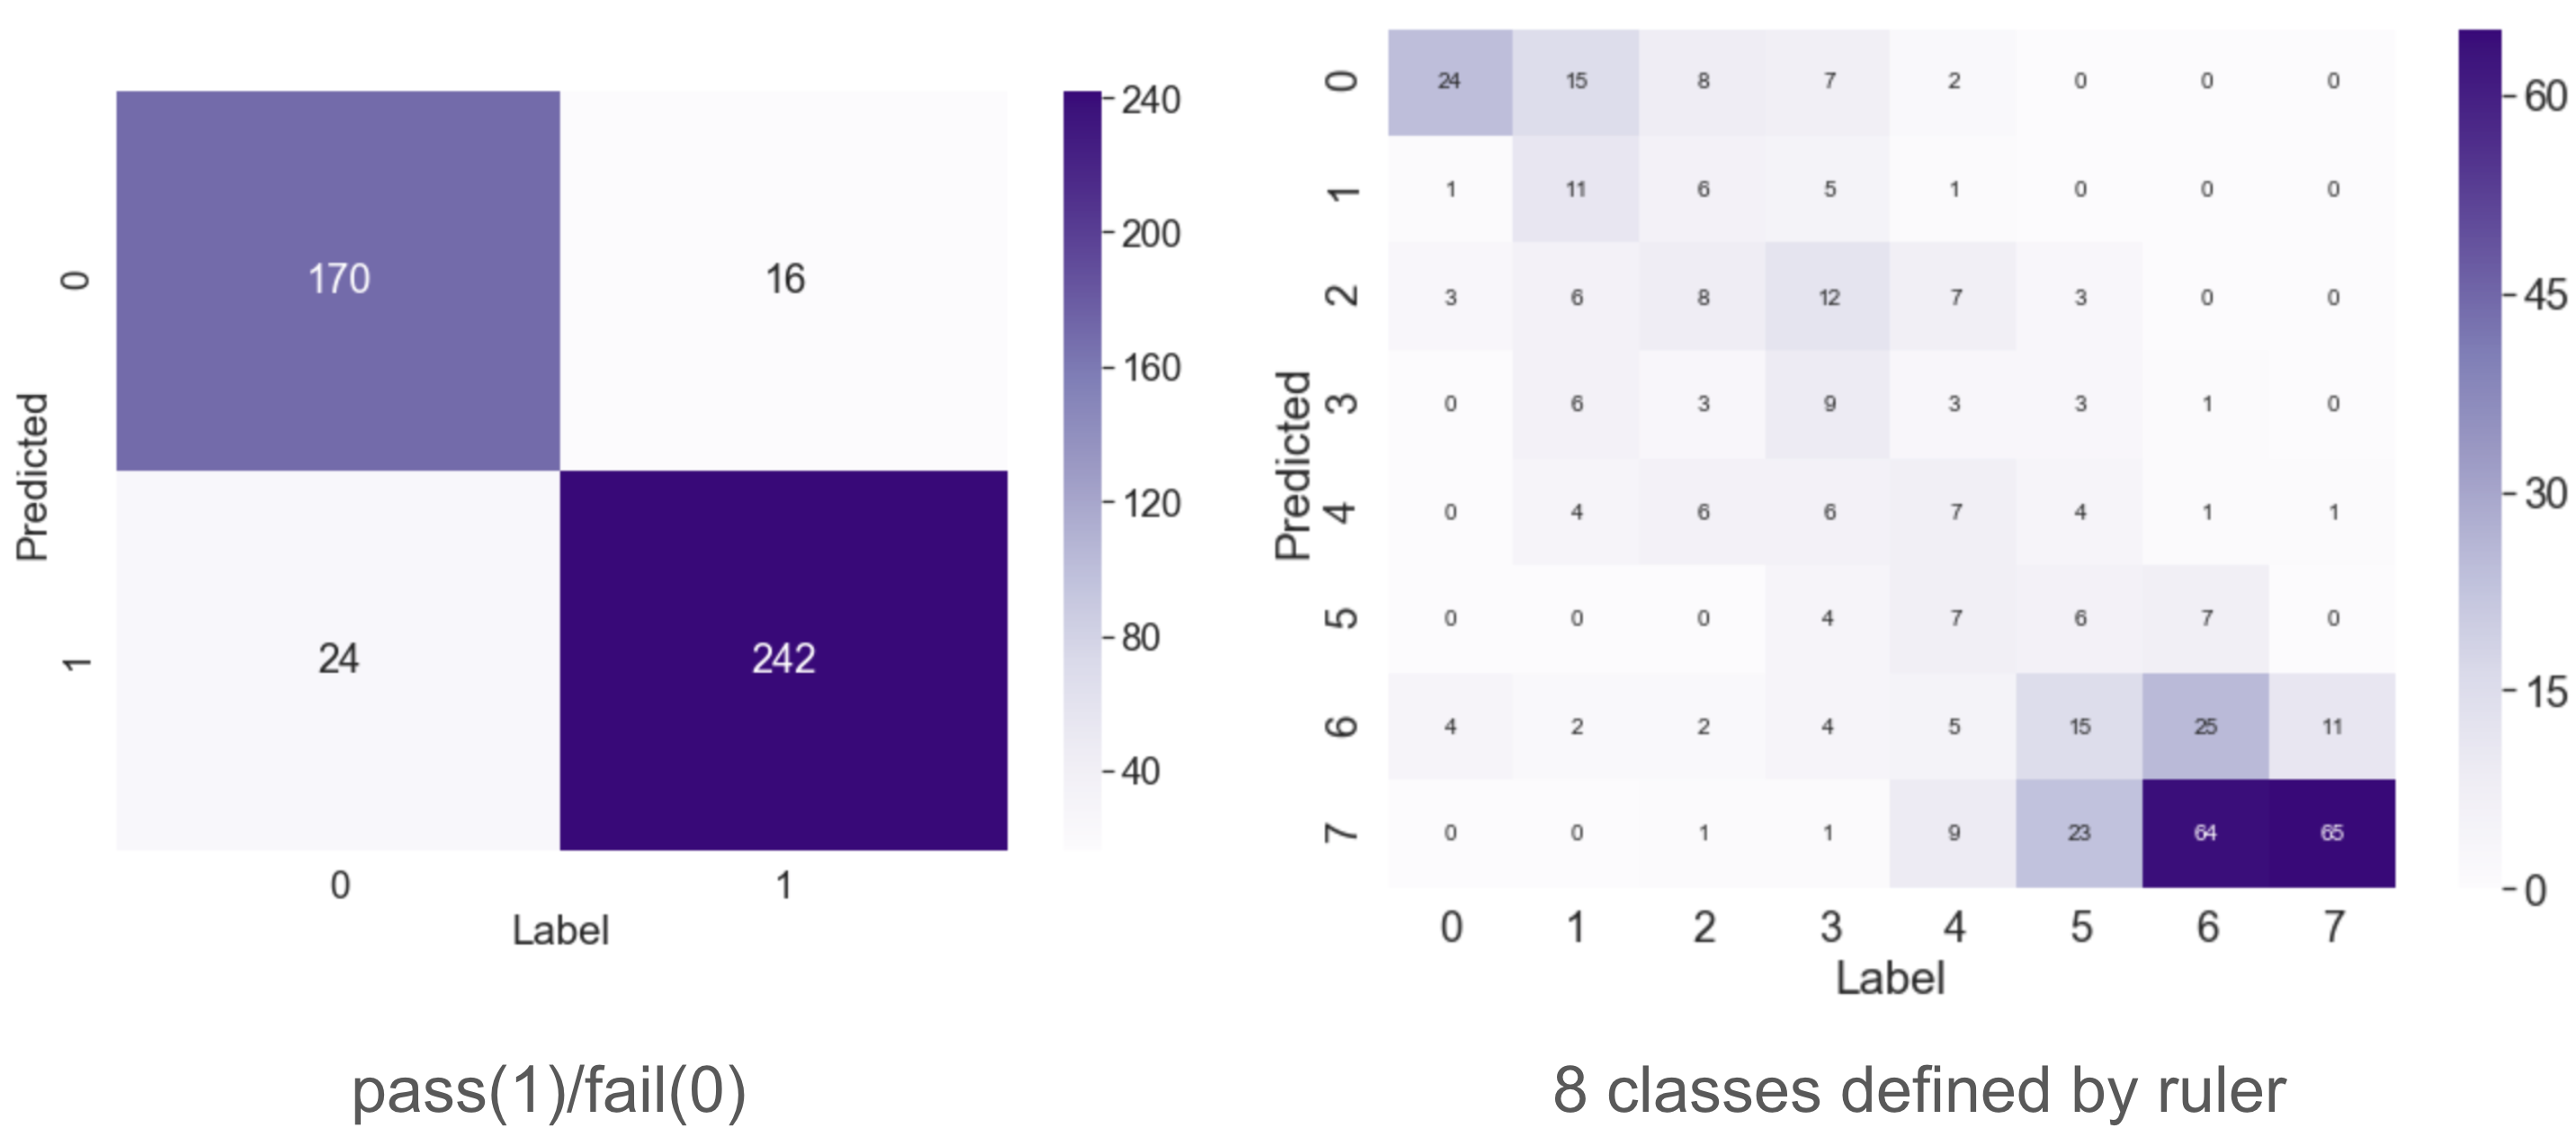
Figure 4. Confusion matrices of the binary and 8-way classification performance of NN-cMEON.
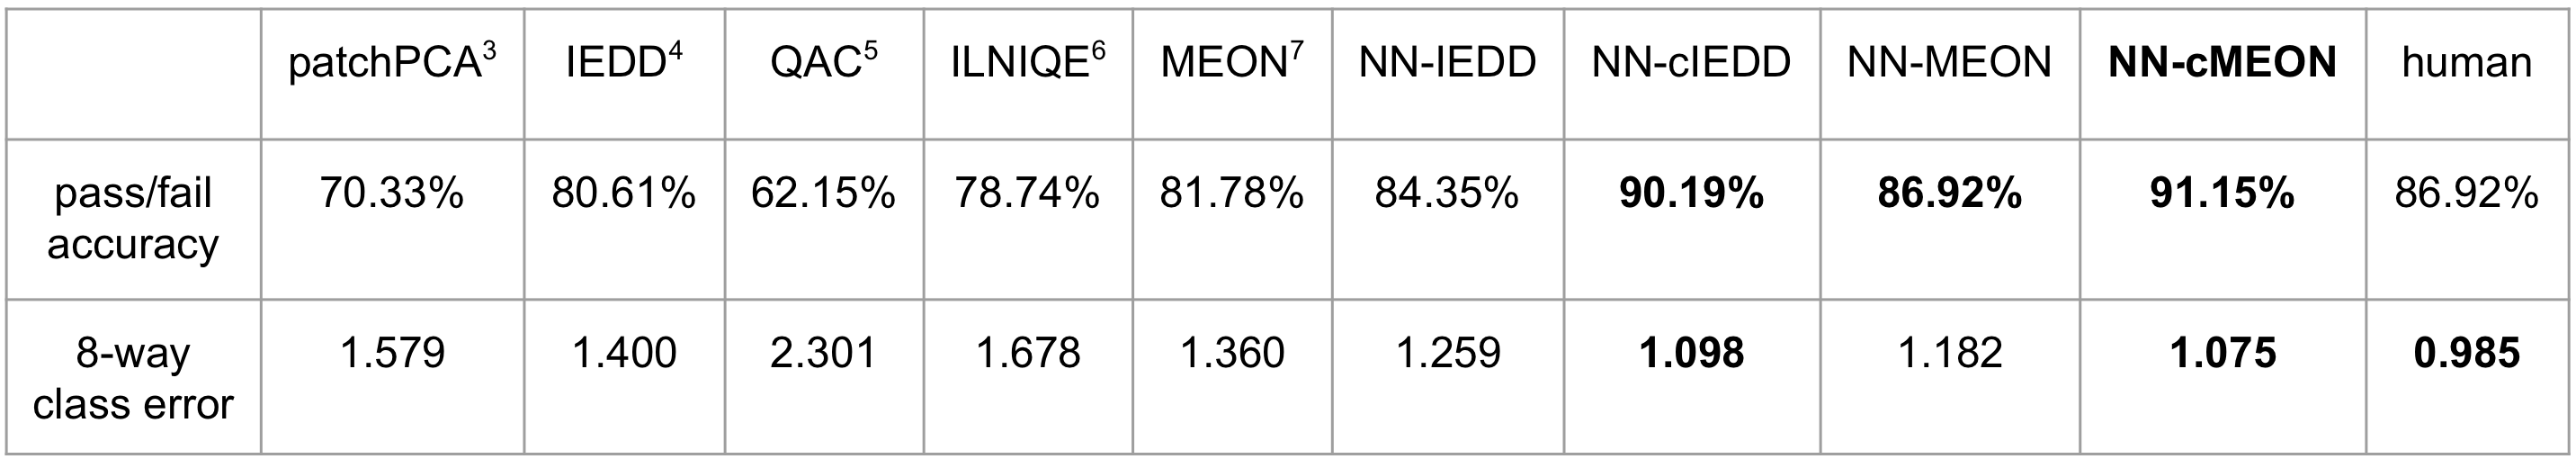
Table I. Binary classification accuracy and 8-way classification average class error for nine methods compared with human performance.