3245
Classification Between Epilepsy Patients and Healthy Controls Using Multi-Modal Structure-Function Brain Network1Icahn School of Medicine at Mount Sinai, New York, NY, United States
Synopsis
Epilepsy patients (EP) endure harmful effects both on their health and quality of life. Early identification of these individuals would be incredibly helpful to gauge management and expectations. Implementing a novel multilayer network analysis, considering communication within functional and structural networks as well as the interactions between them, we tested whether this whole-brain comprehensive network hierarchy can be used as predictors of epilepsy. Using multilayer network features as predictors in a machine learning algorithm we were able to classify EP and controls with overall accuracy of 84%, demonstrating the applicability of multi-modal imaging for diagnostics of epilepsy.
Introduction
Accurate prediction and classification of epilepsy is a challenging task of great clinical significance. Focal epilepsy brain abnormalities are visually qualitatively identified by neuroradiologists. However, ~30% of the patients do not have an identifiable lesion and are considered non-lesional1,2. Also, accumulative research indicates that epilepsy is a network disease and identifying network features is key to providing better diagnosis3-5.The mathematical field of graph theory emerged as a tool for characterizing the brain connectome (comprehensive map of neural connections) that can distinguish between healthy and pathological states6-8. Recent studies have shown that epilepsy patients exhibit altered connectome properties9. In addition, impaired network communication can be caused by gray matter or white matter deficits10. Accordingly, different neuroimaging modalities such as functional MRI (fMRI) and diffusion weighted imaging (DWI) provide different assessments of the same brain network. Therefore, each MRI modality on its own is only partially explanatory. However, most studies examine either structural or functional networks, lacking a comprehensive model of structure-function interactions.As a multimodal network perspective approach, we have harnessed recent developments in graph theory by utilizing a multilayer network analysis11-13 for the integration of both functional and structural brain networks. Applying this novel analysis on ultra-high field 7T MRI data, we tested whether the multilayer network features can be used as predictors in a machine learning algorithm to classify epilepsy patients (EP) and healthy controls (HC).Methods
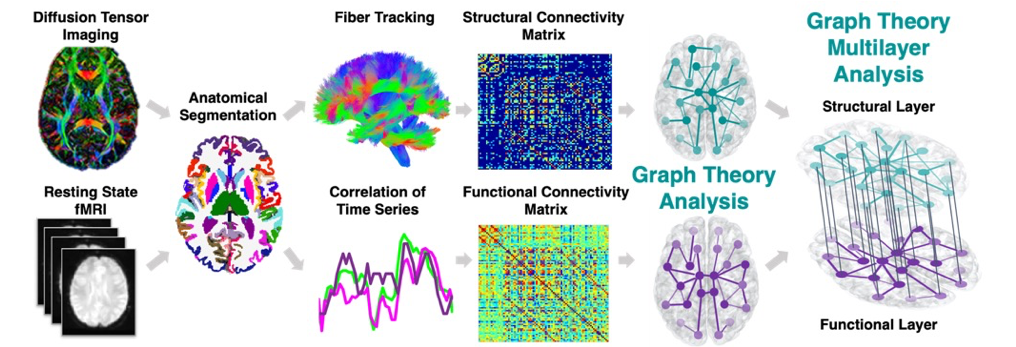
Data were acquired on a Siemens Magnetom 7T MRI scanner (Erlangen, Germany). 19 non-lesional focal EP and 20 HC underwent resting state fMRI and DWI. Functional images were preprocessed using the multi-echo independent component analysis implemented in AFNI14 and diffusion images using MRtrix3.The connectomic procedure is illustrated in Figure 1. Each subject’s anatomical T1-weighted image was segmented into Desikan-Killiany Atlas15 using FreeSurfer v.6.0 and co-registered into the DWI or fMRI space to construct the structural and functional connectomes respectively. Each of the segmented 84 regions of interest (ROIs) represents a node in the graph. The structural connectome edges (links) are defined by the streamline count between any pairwise ROIs derived from diffusion probabilistic tractography. The functional connectome edges are defined by the correlation between the mean time-series of all pairwise ROIs and normalized using Fisher r-to-Z transformation. To enable comparison across subjects, we used a sparsity threshold S, which retains S% of the top connections for each subject16.Next, we applied a multilayer analysis, using R package ‘mplex’ (www.github.com/Achab94/mplex) where the structural and functional connectomes are the layers. The regional multilayer degree centrality coefficients (number of connections) were calculated using a tensorial approach17.Support vector machine (SVM)18 was used for group classification (EP vs. HC) using Matlab (The MathWorks Inc., Natick, MA), where the multilayer centrality measures were used as the model inputs. We then assessed the generalization ability through fivefold cross-validation. For statistical significance permutation tests were performed conducting 1,000 repetitions on shuffled datasets. The overall accuracy, sensitivity, specificity, and ROC curve area under the curve (AUC) were computed for each classifier. The same procedure was conducted on the single structural or functional layers, where the centrality measures (number of connections within the single layer) were used as predictors. Differences in predictive values of the multilayer versus single layer classification was tested using Wilcoxon paired signed rank test.Results
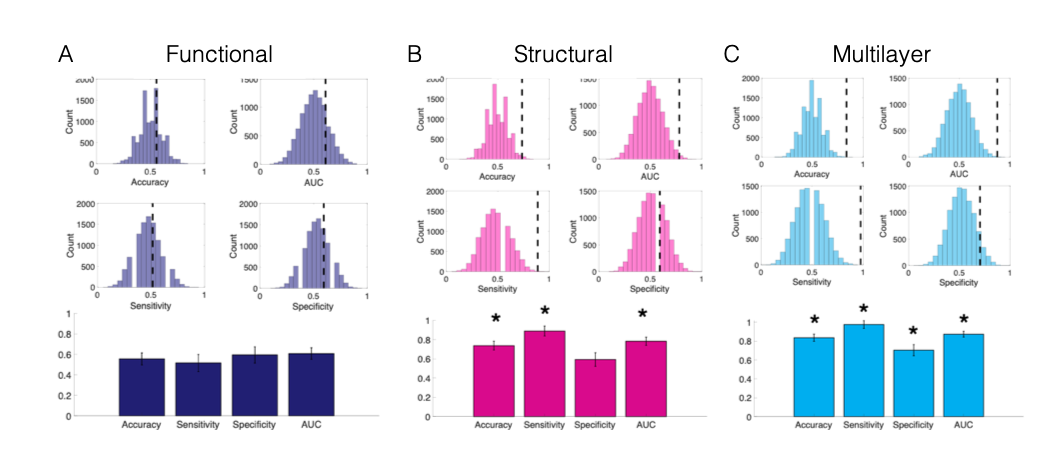
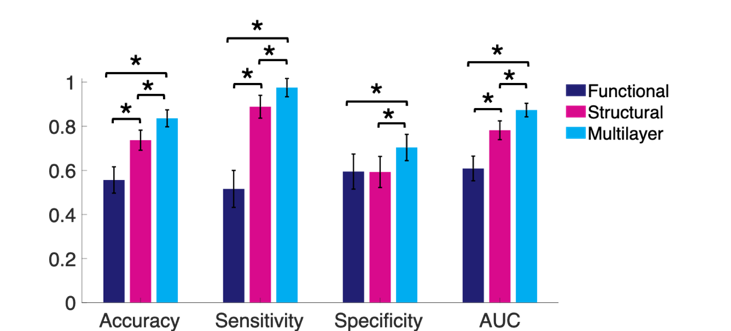
The single modality SVM model using the functional connectome centrality values as predictors resulted in a very poor classification power with overall accuracy of 56% (0.56 ± 0.037, n.s.) (Figure 2A). The SVM model using the structural connectome centrality values as predictors resulted in a better classification power (Figure 2B). The overall accuracy was 74% (0.74 ± 0.05, p<0.01), with sensitivity of 89% (0.89 ± 0.05, p<0.01), specificity of 59% (0.59 ± 0.07, n.s.) and AUC of 78% (0.78 ± 0.04, p<0.01). Conversely, the multi-modal SVM model using the multilayer network centrality values as predictors resulted in higher significant classification power (Figure 2C). The overall accuracy was 84% (0.84 ± 0.04, p<0.001), with sensitivity of 98% (0.98 ± 0.04, p<0.001), specificity of 70% (0.70 ± 0.06, p<0.05) and AUC of 87% (0.87 ± 0.03, p<0.001). Overall, the multilayer based classification model resulted in higher predictive values compared to classification models based on single layer of structural (ZAccuracy =13.04, p<0.001) or functional (ZAccuracy =27.22, p<0.001) connectomes (Figure 3).Discussion
Using the multilayer network centrality measures as predictors in an SVM machine learning algorithm we were able to classify EP and controls with total accuracy of 84%. Importantly, the multilayer based classification model resulted in significantly higher predictive values compared to classification models based on single layer of only structural or functional connectomes. By using the same number of input features as the single modality network (the 84 ROIs’ centrality measures) the multilayer network model achieved a much-improved classification of the two groups.Conclusion
Our results demonstrate the advantage of multilayer network features as biomarkers for the diagnostics of non-lesional focal epilepsy. Further research is needed to replicate and improve the generalization and predictive capacity for robust clinical translation. Specifically, our dataset consists only of non-lesional epilepsy patients, further study using additional datasets of focal epilepsy patients with apparent lesions is needed.Acknowledgements
This work was supported by the National Institutes of Health - National Institute of Neurological Disorders and Stroke - R00 NS070821; National Institute of Mental Health - R01 MH109544; Icahn School of Medicine Capital Campaign; BioMedical Engineering Imaging Institute; Department of Radiology, Icahn School of Medicine at Mount Sinai.
References
1. Duncan, J. S., Sander, J. W., Sisodiya, S. M. & Walker, M. C. Adult epilepsy. The Lancet 367, 1087-1100 (2006).
2. Nguyen, D. K., Mbacfou, M. T., Nguyen, D. B. & Lassonde, M. Prevalence of nonlesional focal epilepsy in an adult epilepsy clinic. Canadian journal of neurological sciences 40, 198-202 (2013).
3. Spencer, S. S. Neural networks in human epilepsy: evidence of and implications for treatment. Epilepsia 43, 219-227 (2002).
4. Fang, M., Xi, Z.-Q., Wu, Y. & Wang, X.-F. A new hypothesis of drug refractory epilepsy: neural network hypothesis. Medical Hypotheses 76, 871-876 (2011).
5. Stefan, H. & Lopes Da Silva, F. H. Epileptic neuronal networks: methods of identification and clinical relevance. Frontiers in neurology 4, 8 (2013).
6. Bullmore, E. & Sporns, O. Complex brain networks: graph theoretical analysis of structural and functional systems. Nature Reviews Neuroscience 10, 186-198 (2009).
7. Sporns, O. Networks of the Brain. (MIT press, 2011).
8. Bassett, D. S. et al. Hierarchical organization of human cortical networks in health and schizophrenia. J Neurosci 28, 9239-9248, doi:28/37/9239 [pii]10.1523/JNEUROSCI.1929-08.2008 [doi] (2008).
9. Haneef, Z. & Chiang, S. Clinical correlates of graph theory findings in temporal lobe epilepsy. Seizure 23, 809-818, doi:https://doi.org/10.1016/j.seizure.2014.07.004 (2014).
10. Drevets, W. C., Price, J. L. & Furey, M. L. Brain structural and functional abnormalities in mood disorders: implications for neurocircuitry models of depression. Brain structure and function 213, 93-118 (2008).
11. Muldoon, S. F. & Bassett, D. S. Network and Multilayer Network Approaches to Understanding Human Brain Dynamics. Philosophy of Science 83, 710-720, doi:10.1086/687857 (2016).
12. Vaiana, M. & Muldoon, S. F. Multilayer Brain Networks. Journal of Nonlinear Science, doi:10.1007/s00332-017-9436-8 (2018).
13. De Domenico, M. Multilayer modeling and analysis of human brain networks. Gigascience 6, 1-8, doi:10.1093/gigascience/gix004 (2017).
14. Kundu, P., Inati, S. J., Evans, J. W., Luh, W. M. & Bandettini, P. A. Differentiating BOLD and non-BOLD signals in fMRI time series using multi-echo EPI. NeuroImage 60, 1759-1770, doi:10.1016/j.neuroimage.2011.12.028 (2012).
15. Desikan, R. S. et al. An automated labeling system for subdividing the human cerebral cortex on MRI scans into gyral based regions of interest. NeuroImage 31, 968-980, doi:10.1016/j.neuroimage.2006.01.021 (2006).
16. Jacob, Y. et al. Neural correlates of rumination in major depressive disorder: A brain network analysis. NeuroImage: Clinical 25, 102142, doi:https://doi.org/10.1016/j.nicl.2019.102142 (2020).
17. De Domenico, M. et al. Mathematical Formulation of Multilayer Networks. Physical Review X 3, 041022, doi:10.1103/PhysRevX.3.041022 (2013).
18. LaConte, S., Strother, S., Cherkassky, V., Anderson, J. & Hu, X. Support vector machines for temporal classification of block design fMRI data. NeuroImage 26, 317-329 (2005).
Figures