3243
Pulmonary functional MR imaging with simultaneous multiple-breath washout tests1Division of Respiratory Medicine, Department of Pediatrics, Inselspital, University of Bern, Bern, Switzerland, 2Division of Radiological Physics, University Hospital Basel, Basel, Switzerland, 3Department of Biomedical Engineering, University Hospital Basel, Basel, Switzerland, 4Institute for Biomedical Engineering, University and ETH Zurich, Zurich, Switzerland
Synopsis
Simultaneous acquisition of oxygen-enhanced MRI and Multiple Breath Washout (MBW) testing is an unexplored and innovative methodology for lung function assessment. Until date, these techniques have been conducted separately. Combined use provides complementary and simultaneous information on pulmonary ventilation, diffusion and perfusion, and has several advantages compared to separate measurements. In this study, we performed oxygen-enhanced relaxometry and non-contrast enhanced ventilation and perfusion mapping using matrix pencil MRI, simultaneously with the MBW.
Introduction and Purpose
Combined use of imaging techniques and lung function tests is performed in clinical routine for monitoring of lung disease on a regular basis. Oxygen-enhanced (OE) MRI and Multiple Breath Washout (MBW) lung function testing are modalities for assessing lung disease that both require breathing of 100% oxygen (O2)1,2. Despite overlap in test methodology, these techniques until now have been conducted separately. While MBW provides accurate insight into global lung function, OE-MRI can highlight regional differences within the lungs. Simultaneous usage of the two methods can thus yield complementary information and have high clinical potential1,3. This is technically challenging, as it requires novel MR-MBW setups. In this study, we performed dynamic oxygen-enhanced relaxometry as well as perfusion and ventilation imaging simultaneously with pulmonary lung function test MBW.Methods
Measurement protocolWe performed dynamic OE imaging, matrix pencil (MP) MRI and morphological MRI of the lung simultaneously with MBW measurements. Sets of longitudinal relaxation time (T1) maps were used to assess changes in T1 during the O2 wash-in phase. Pulmonary functional MRI with matrix pencil decomposition was used for non-invasive assessment of both lung ventilation and perfusion simultaneously. The MBW device was placed in the scanner room and was controlled from outside the scanner room. The MBW device continuously recorded gas flow and gas concentrations and managed the supply and switch between room air and 100% O2 during the imaging-MBW tests. MBW measurements were performed in supine position. We used a custom build MRI compatible adaptation of a commercially available MBW device (Exhalyzer D, Ecomedics, Duernten, Switzerland and analysis software Spiroware 3.3.0-RESEARCH (Ecomedics). Room air and 100% O2 were delivered via the MBW machine and a tight-fitting mask. Imaging was performed at 1.5T (MAGNETOM Avanto-Fit, Siemens Healthineers) in a healthy volunteer and in accordance with the local ethics. Informed consent was obtained.
MR imaging acquisition and post processing
T1 mapping for dynamic OE relaxometry was performed with an inversion-recovery ultra-fast balanced steady-state free precession sequence1,4. Parameters were as previously described, but with only one inversion block to reduce the scan time to less than 4 seconds and allowing for timed end-expiration breath-holding imaging. For ventilation and perfusion weighted imaging, an ultra-fast balanced steady-state free precession sequence was used5. The acquisition of one slice during free breathing lasted 50 seconds.
Spatial misalignments between consecutive T1 maps were corrected using elastic image registration6. A conventional asymptotic exponential fit was performed on the sets of T1 maps acquired during every expiratory phase to calculate the oxygen wash-in and gas concentrations. MP-MRI post processing was conducted as previously described6.
MBW
The MBW technique was used to assess ventilation inhomogeneity. The Lung Clearance Index (LCI) is the primary MBW outcome, describing the quantity of lung turnovers [functional residual capacity (FRC)] required to clear out resident nitrogen (N2) gas from the lungs2. In order to clear out the lung till 2.5% of the initial N2 concentration, breathing of 100% O2 (O2 wash-in) is required2. Global quantitative markers of ventilation as expired O2 concentration at certain wash-in times were compared between MBW and MRI.
Results
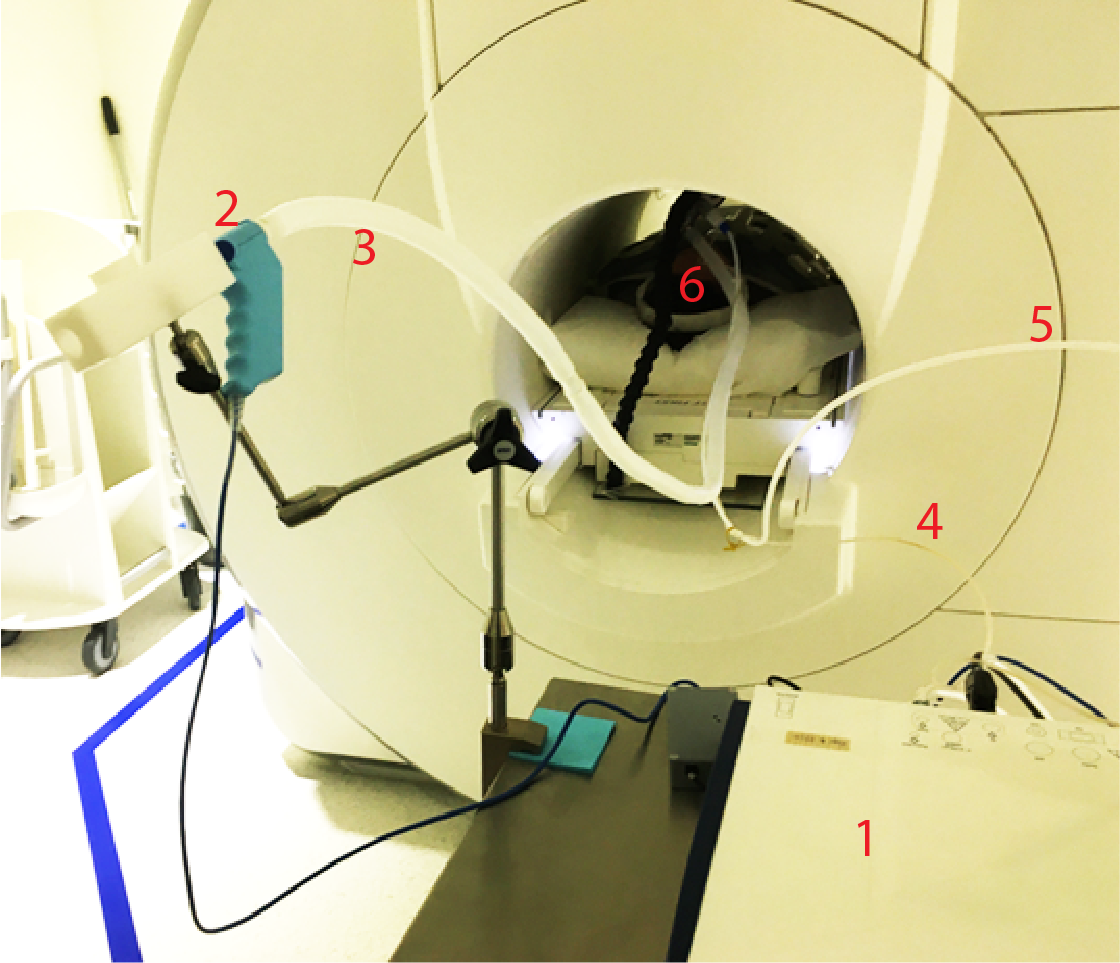
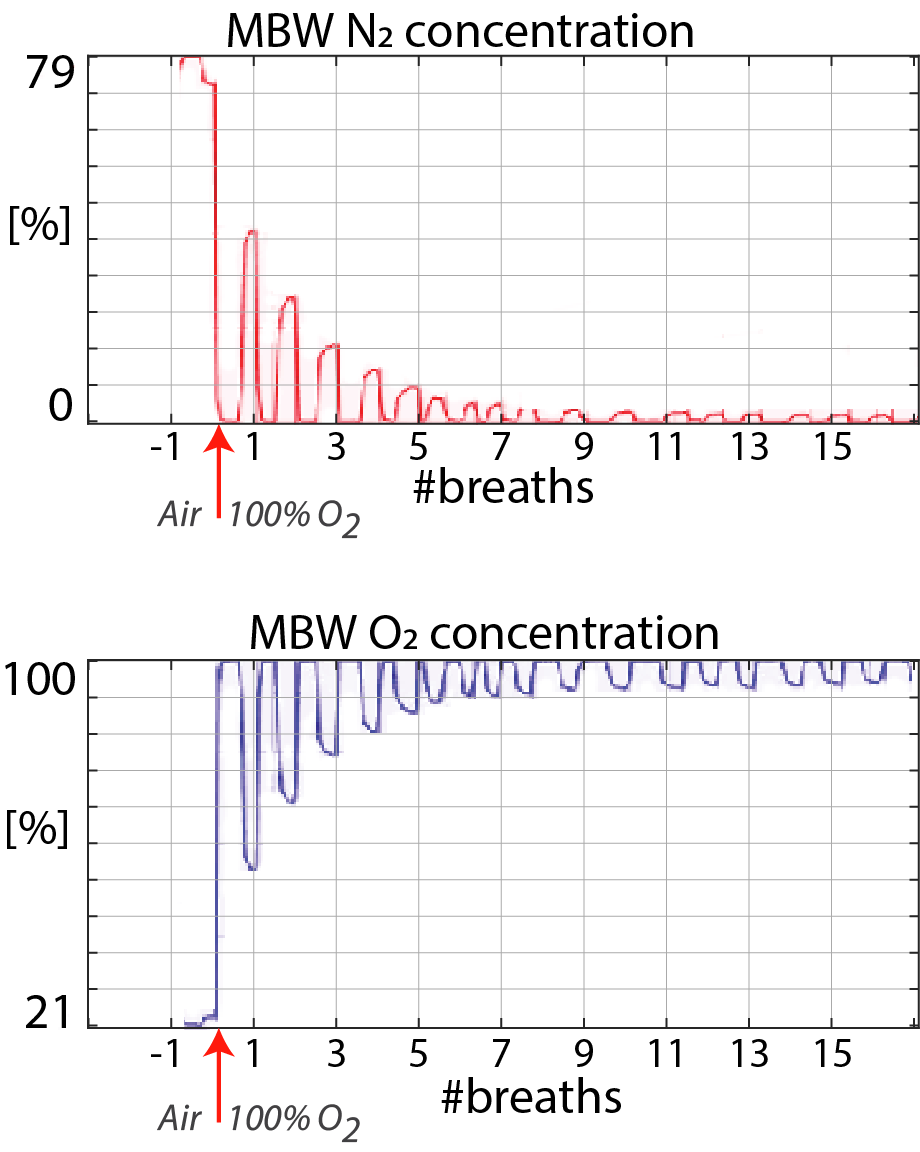
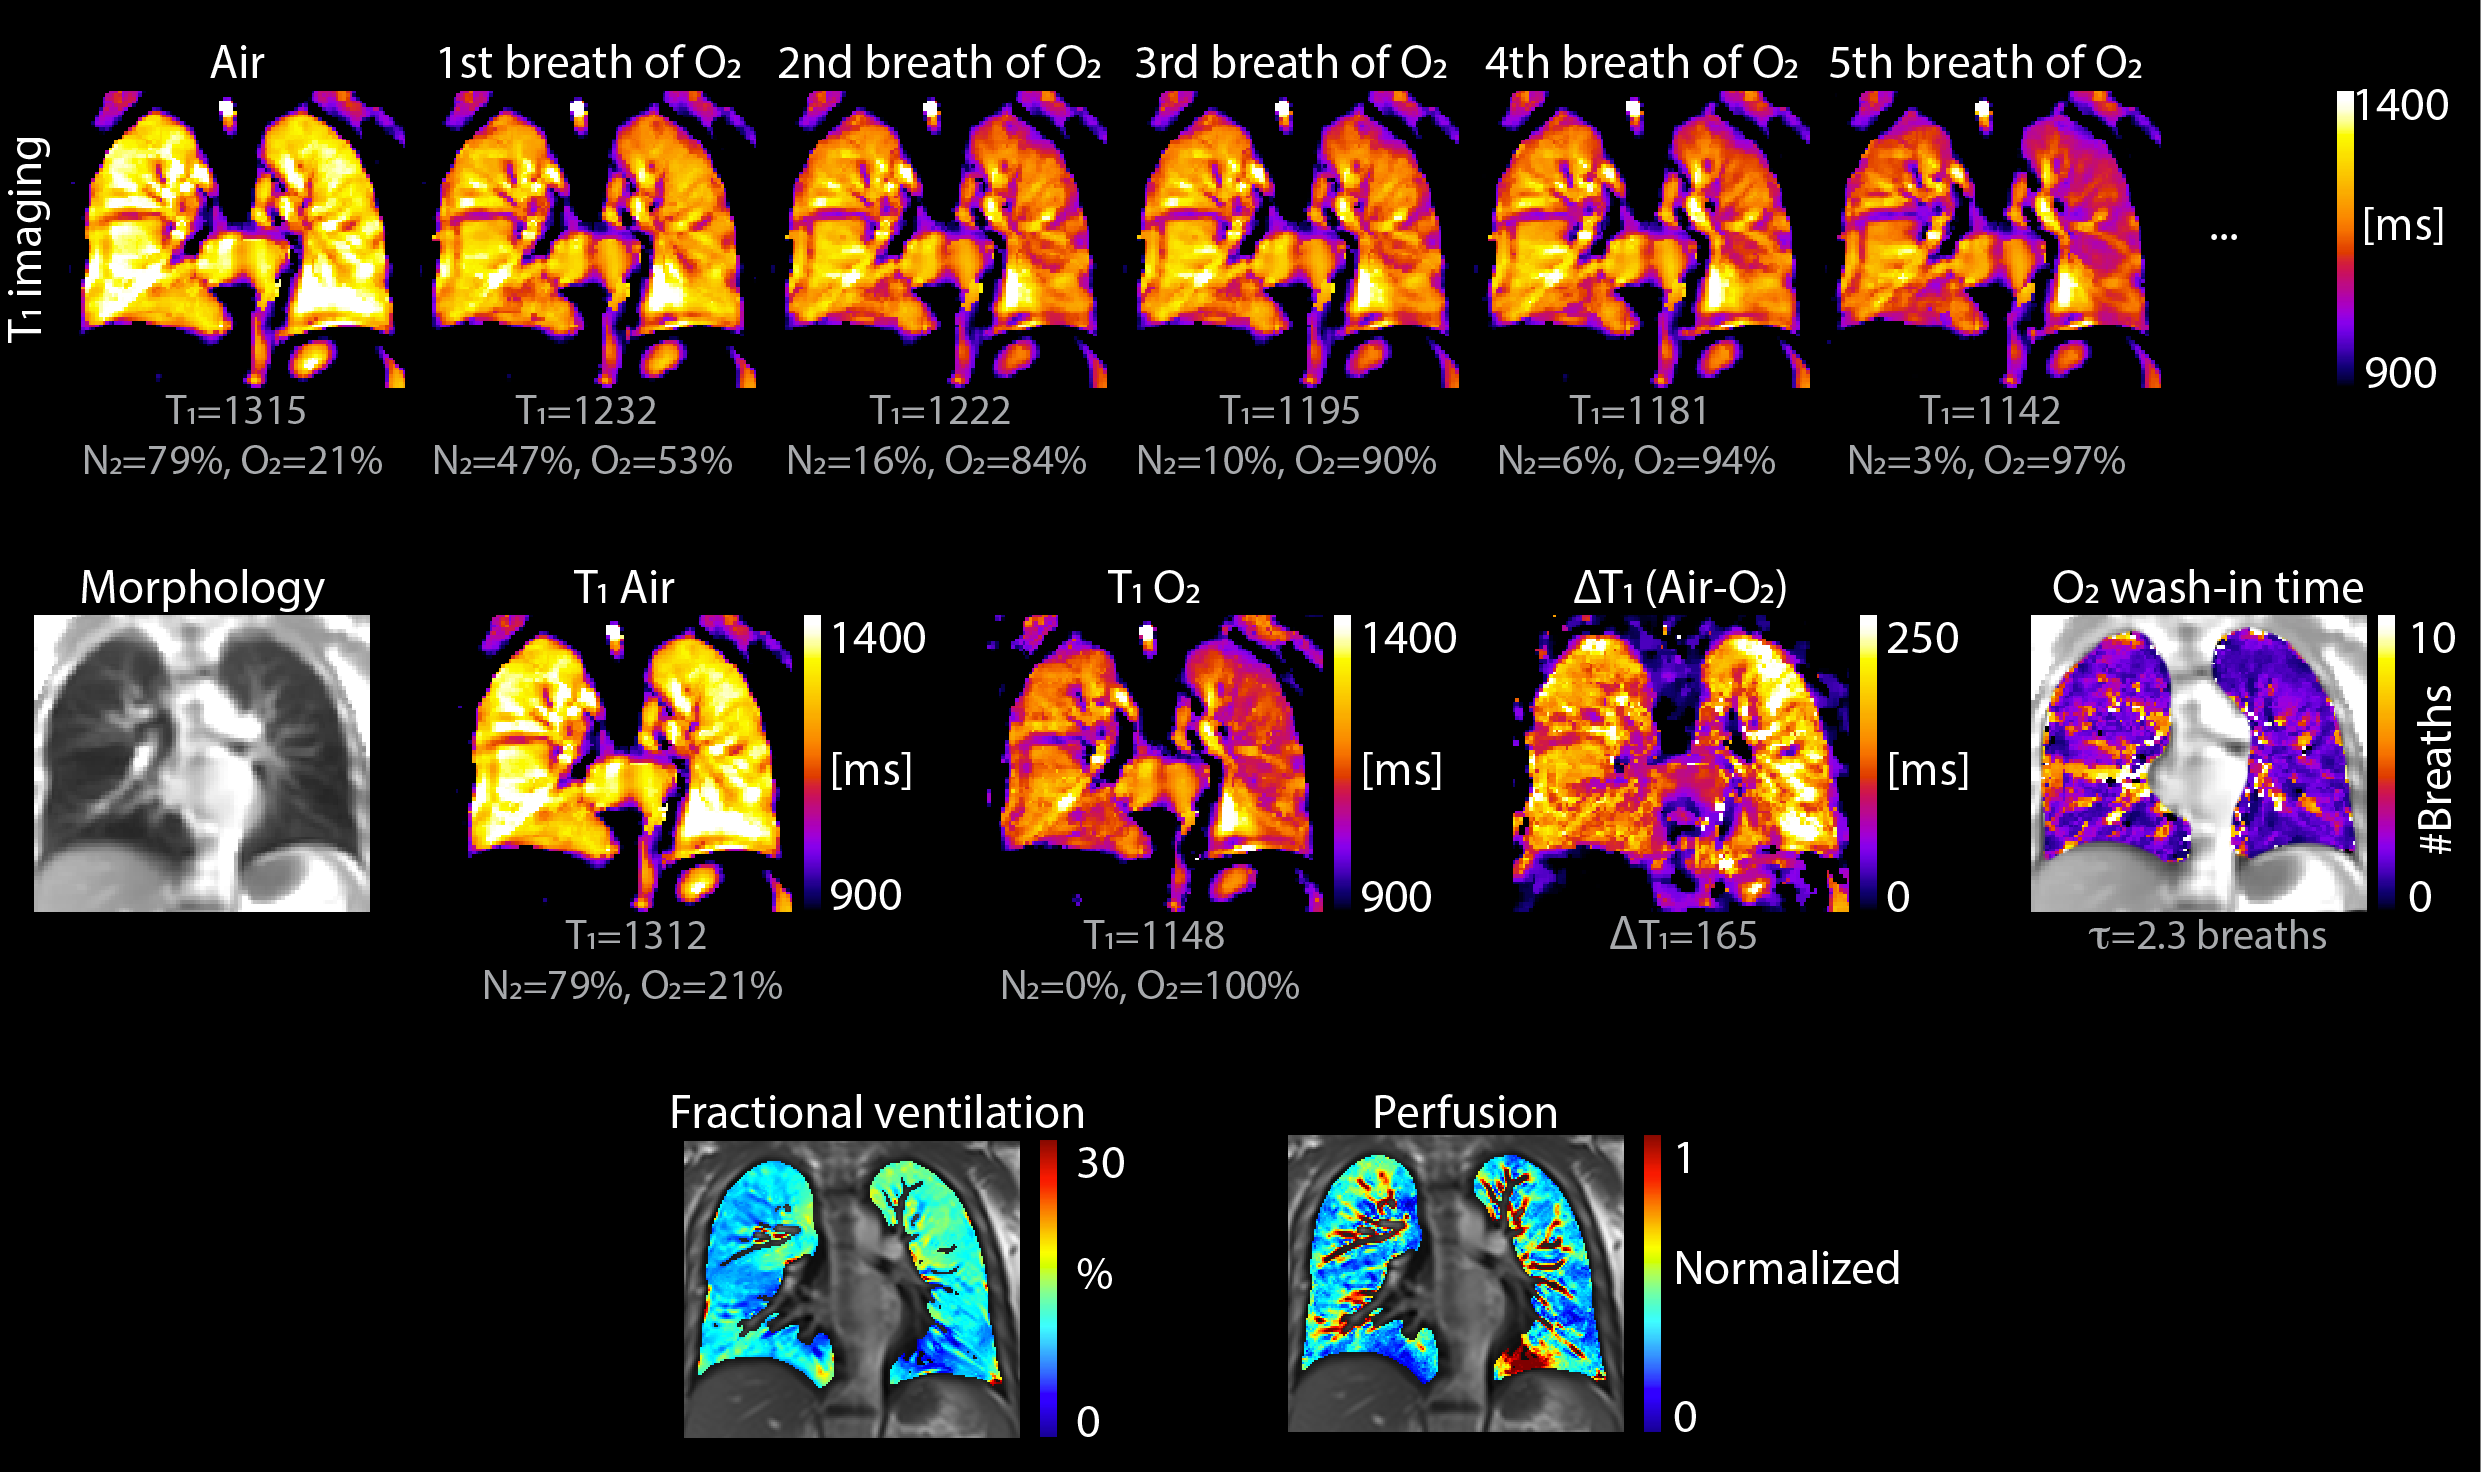
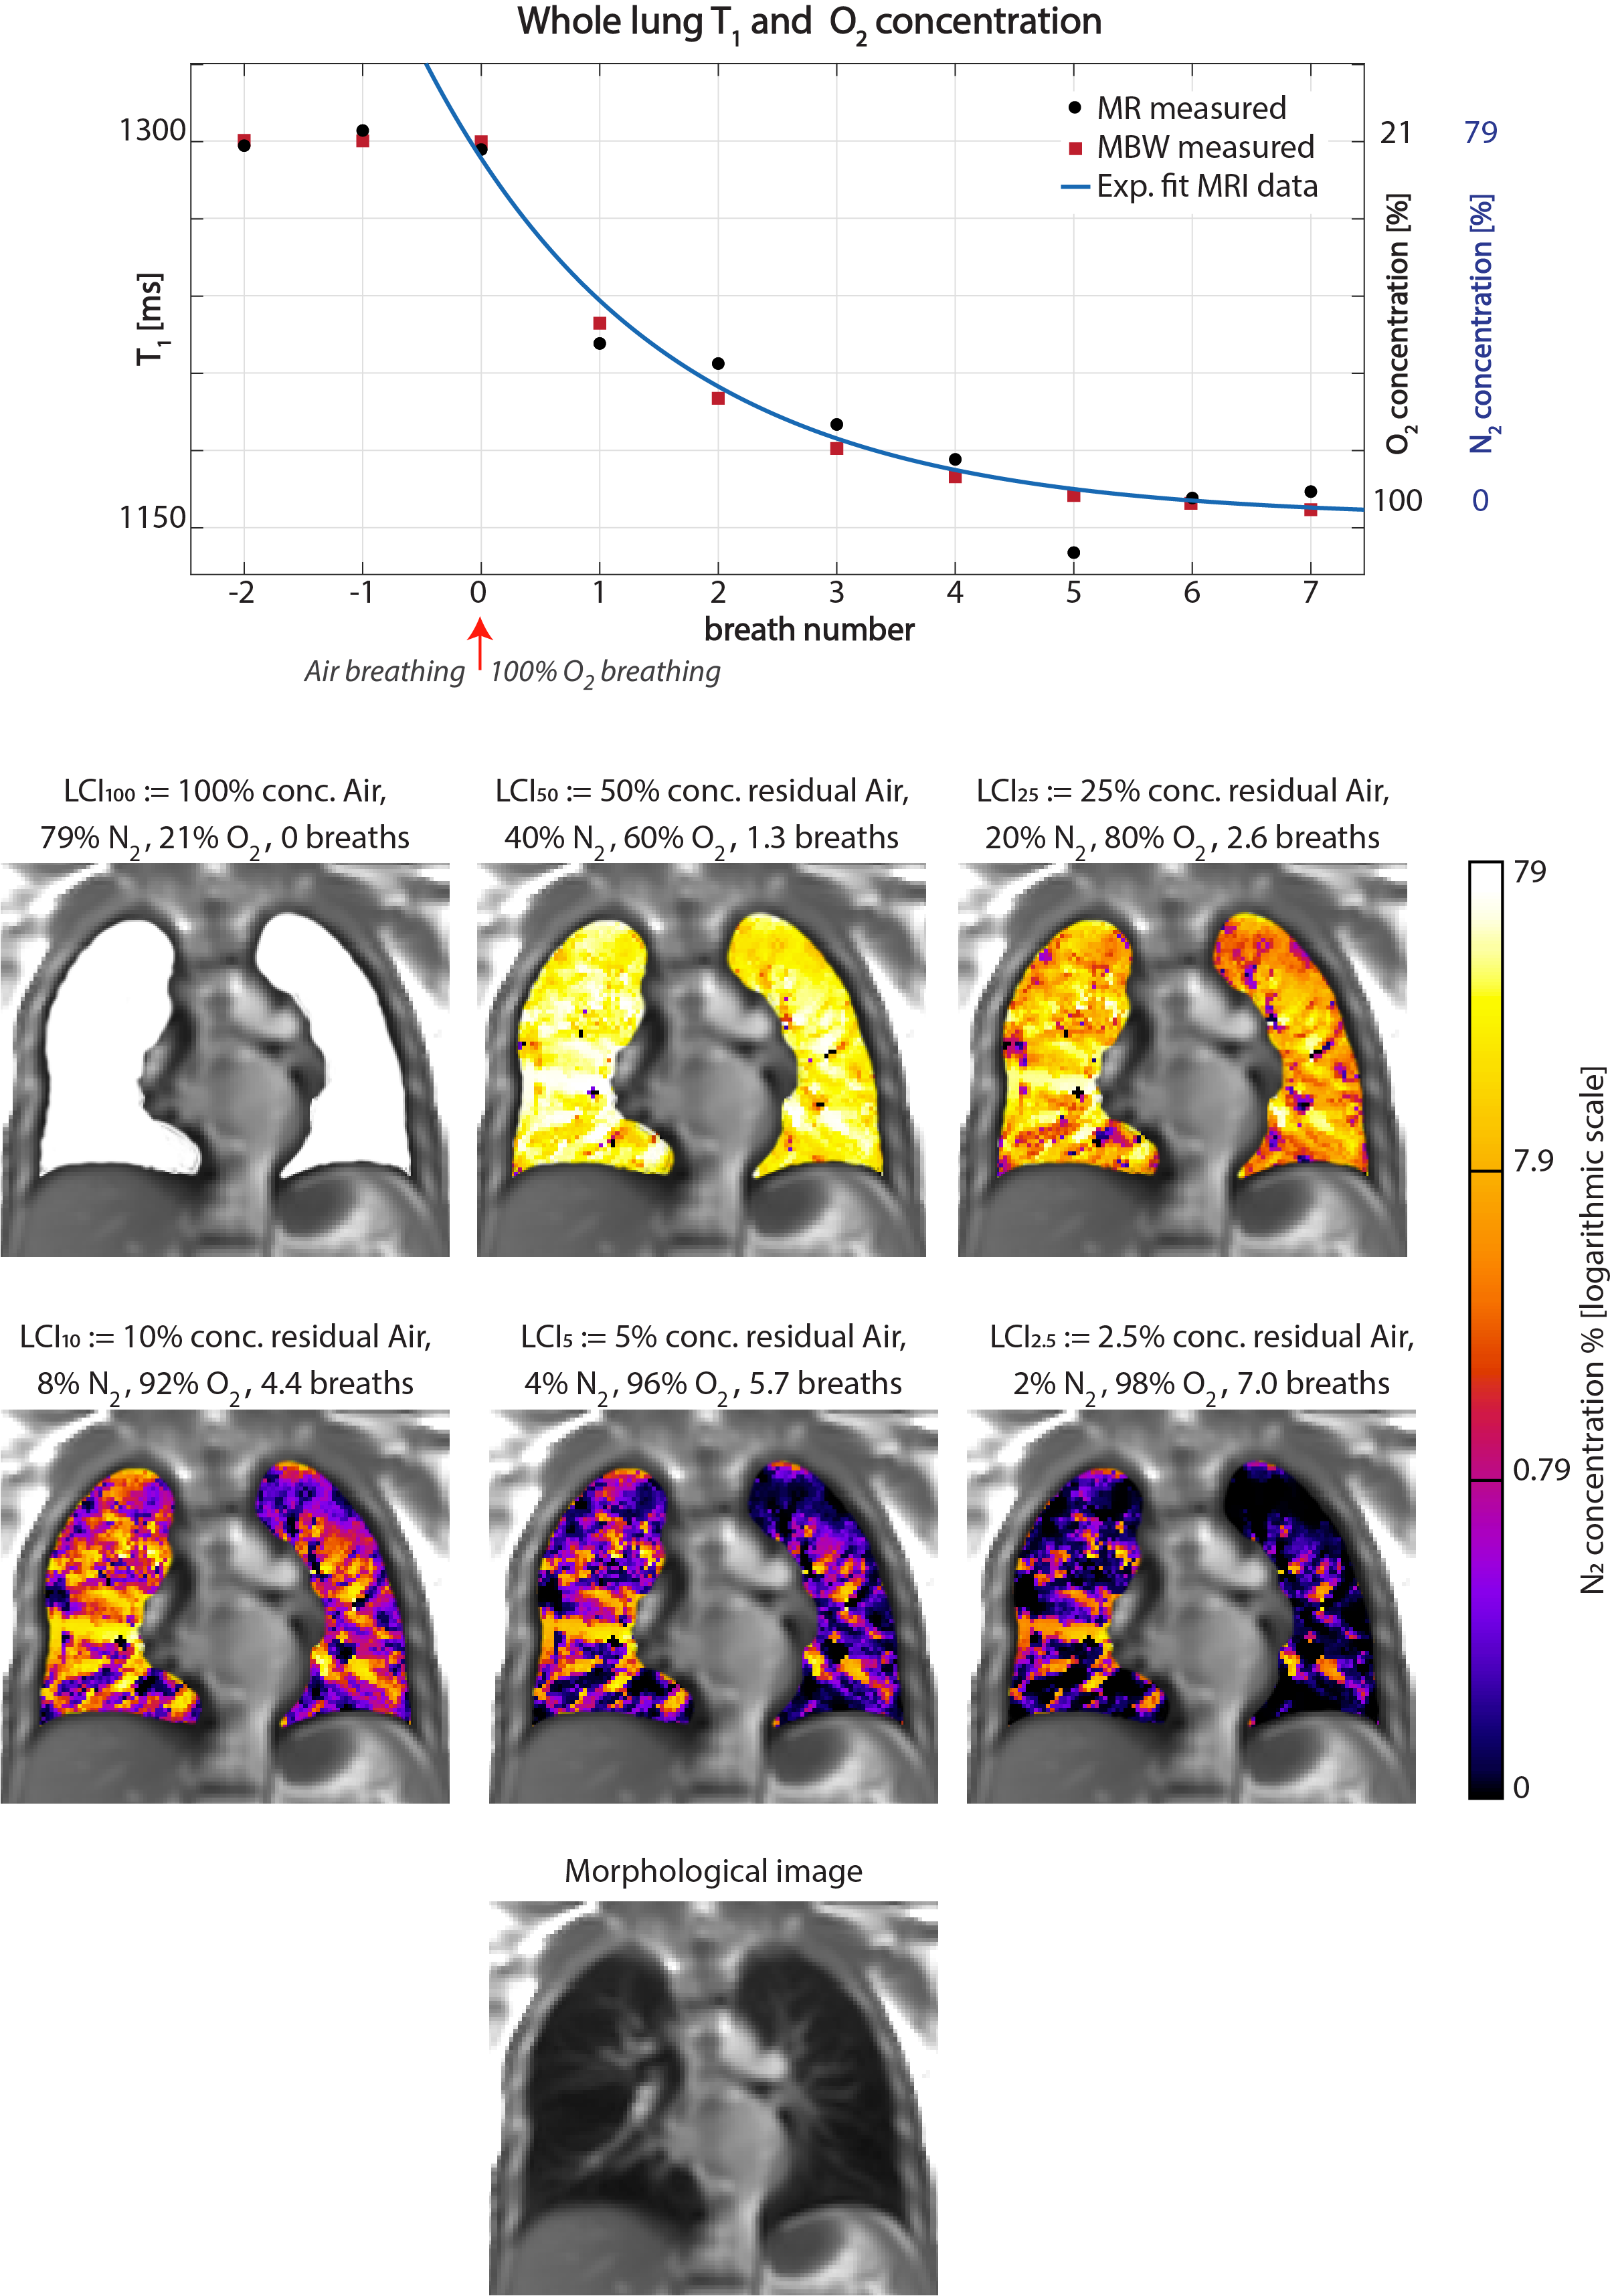
OE-MRI and MP-MRI could be performed simultaneously with MBW, using the experimental setup shown in Figure 1. Gasses were delivered by using the MBW device and gas concentrations were recorded. Exemplary N2 and O2 concentrations signals obtained during simultaneous OE-MRI MBW measurements are shown in Figure 2. The feasibility of dynamic and static oxygen enhanced T1 imaging as well as ventilation and perfusion mapping is displayed in Figure 3. From the first breath with 100% O2 supply onwards, T1 in the lung quickly decreases. To note, the decrease in T1 during oxygen delivery symbolizes accumulation of O2 in the lungs and dissolution into the blood. Figure 4 displays the mean lung T1 and gas concentrations, as well as maps of residual N2 concentration as a function of the number of oxygen breaths. The oxygen concentration measured with the MBW and MRI showed general agreement. Wash-in time constants were 2.3 and 2.4 breaths for MRI and MBW, respectively. The LCI was 9.6 during OE-MRI and 10.3 during MP-MRI respectively. The FRC was 3.3L and 3.1L respectively.Discussion and conclusion
In this proof of principle study, we showed that simultaneous performance of OR-MRI and MP-MRI with a custom build MRI compatible MBW setup is feasible. OR-MRI and MP-MRI image quality was comparable to results obtained in previous studies1,7. Application in a larger dataset may allow for direct correlation between OR-MRI and MBW. The LCI values were higher than published reference values and showed a high variability8. This is likely due to the specification of the MRI-compatible MBW setup and physiological differences of measurement set up, such as MBW function testing in breath-holding.The combination of MRI with MBW might add novel acquisition strategies and better understanding of lung function due to simultaneous measurements. Further feasibility studies and research are needed to improve both MBW MRI compatibility and MBW outcome robustness; moreover, to assess the methodological requirements and potential clinical value.
Acknowledgements
Anne-Christianne Kentgens acknowledges the support of the Swiss Government, Excellence Scholarship from the Swiss Confederation, Federal Department of Economic Affairs, Education and Research (EAER). Orso Pusterla acknowledges the support from the Strategic Focus Area initiative “Personalized Health and Related Technologies (PHRT, grant #2018-223)” of the ETH Domain, Switzerland. The authors acknowledge the support of a Vertex Innovation Grant.References
1. Bauman G, Pusterla O, Santini F, Bieri O. Dynamic and steady-state oxygen-dependent lung relaxometry using inversion recovery ultra-fast steady-state free precession imaging at 1.5 T. Magn Reson Med. 2018 Feb;79(2):839-845.
2. Robinson PD, Latzin P, Verbanck S, Hall GL, Horsley A, Gappa M, Thamrin C, Arets HG, Aurora P, Fuchs SI, King GG, Lum S, Macleod K, Paiva M, Pillow JJ, Ranganathan S, Ratjen F, Singer F, Sonnappa S, Stocks J, Subbarao P, Thompson BR, Gustafsson PM. Consensus statement for inert gas washout measurement using multiple- and single- breath tests. Eur Respir J. 2013 Mar;41(3):507-22. Erratum in: Eur Respir J. 2013 Nov;42(5):1432. Ranganathan, Sarah [corrected to Ranganathan, Sarath].
3. Nyilas S, Bauman G, Sommer G, Stranzinger E, Pusterla O, Frey U, Korten I, Singer F, Casaulta C, Bieri O, Latzin P. Novel magnetic resonance technique for functional imaging of cystic fibrosis lung disease. Eur Respir J. 2017 Dec 7;50(6):1701464.
4. Santini F, Kawel-Boehm N, Greiser A, Bremerich J, Bieri O. Simultaneous T1 and T2 quantification of the myocardium using cardiac balanced-SSFP inversion recovery with interleaved sampling acquisition (CABIRIA). Magn Reson Med. 2015 Aug;74(2):365-71.
5. Bauman G, Pusterla O, Bieri O. Ultra-fast Steady-State Free Precession Pulse Sequence for Fourier Decomposition Pulmonary MRI. Magn Reson Med. 2016 Apr;75(4):1647-53.
6. Klein S, Staring M, Murphy K, Viergever MA, Pluim JP. elastix: a toolbox for intensity-based medical image registration. IEEE Trans Med Imaging. 2010 Jan;29(1):196-205.
7. Bauman G, Bieri O. Matrix pencil decomposition of time-resolved proton MRI for robust and improved assessment of pulmonary ventilation and perfusion. Magn Reson Med. 2017 Jan;77(1):336-342.
8. Anagnostopoulou P, Latzin P, Jensen R, Stahl M, Harper A, Yammine S, Usemann J, Foong RE, Spycher B, Hall GL, Singer F, Stanojevic S, Mall MA, Ratjen F, Ramsey KA. Normative data for multiple breath washout outcomes in school-aged Caucasian children. Eur Respir J. 2020 Apr 3;55(4):1901302.
Figures