3242
Breathhold vs. free-breathing tyGA SoS for Lung Imaging1Department of Internal Medicine II, Ulm University Medical Center, Ulm, Germany, Ulm, Germany, 2Department of Radiology, Ulm University Medical Centre, Ulm, Germany, Ulm, Germany
Synopsis
Lung MRI is challenging due to the short T2* and respiratory and cardiac motion. In this study an UTE stack-of-stars sequence has been combined with tiny golden angle (tyGA SoS) for imaging of lung morphology (proton fraction, PF) and function (fractional ventilation, FV). Application of the techniques to smoker and non-smokers revealed significant differences in the PF thus indicating its sensitivity.
Purpose
To investigate the feasibility of breathhold (BH) and free breathing (FB) self-gated UTE stack-of-stars with tiny golden angle (tyGA SoS) angular increment for lung density and fractional ventilation quantification.Introduction
Due to the intrinsic low signal caused by the low proton density and the short T2*, and respiratory and cardiac motion, lung MR imaging as such is challenging. The application of ultrashort echo time (TE) techniques (UTE) combined with either breathhold or self-gating motion compensation, have been proven to provide sufficient signal in the lung parenchyma for the assessment of lung morphology and function (1–4).Even though minimal TEs can be realized with 3D center-out encoding the related long acquisition times caused by the isotropic field-of-view and resolution often limits its application in patients. As efficient variant, in-plane UTE has been combined with through-plane Fourier encoding (SoS) thus enabling rather short TEs with rather short scan times (5).
It was the objective of this study to combine SoS with tiny golden angular increments (tyGA SoS) (6) for self-gating and breathhold lung imaging and to investigates its potential to derive lung density and fractional ventilation.
Methods
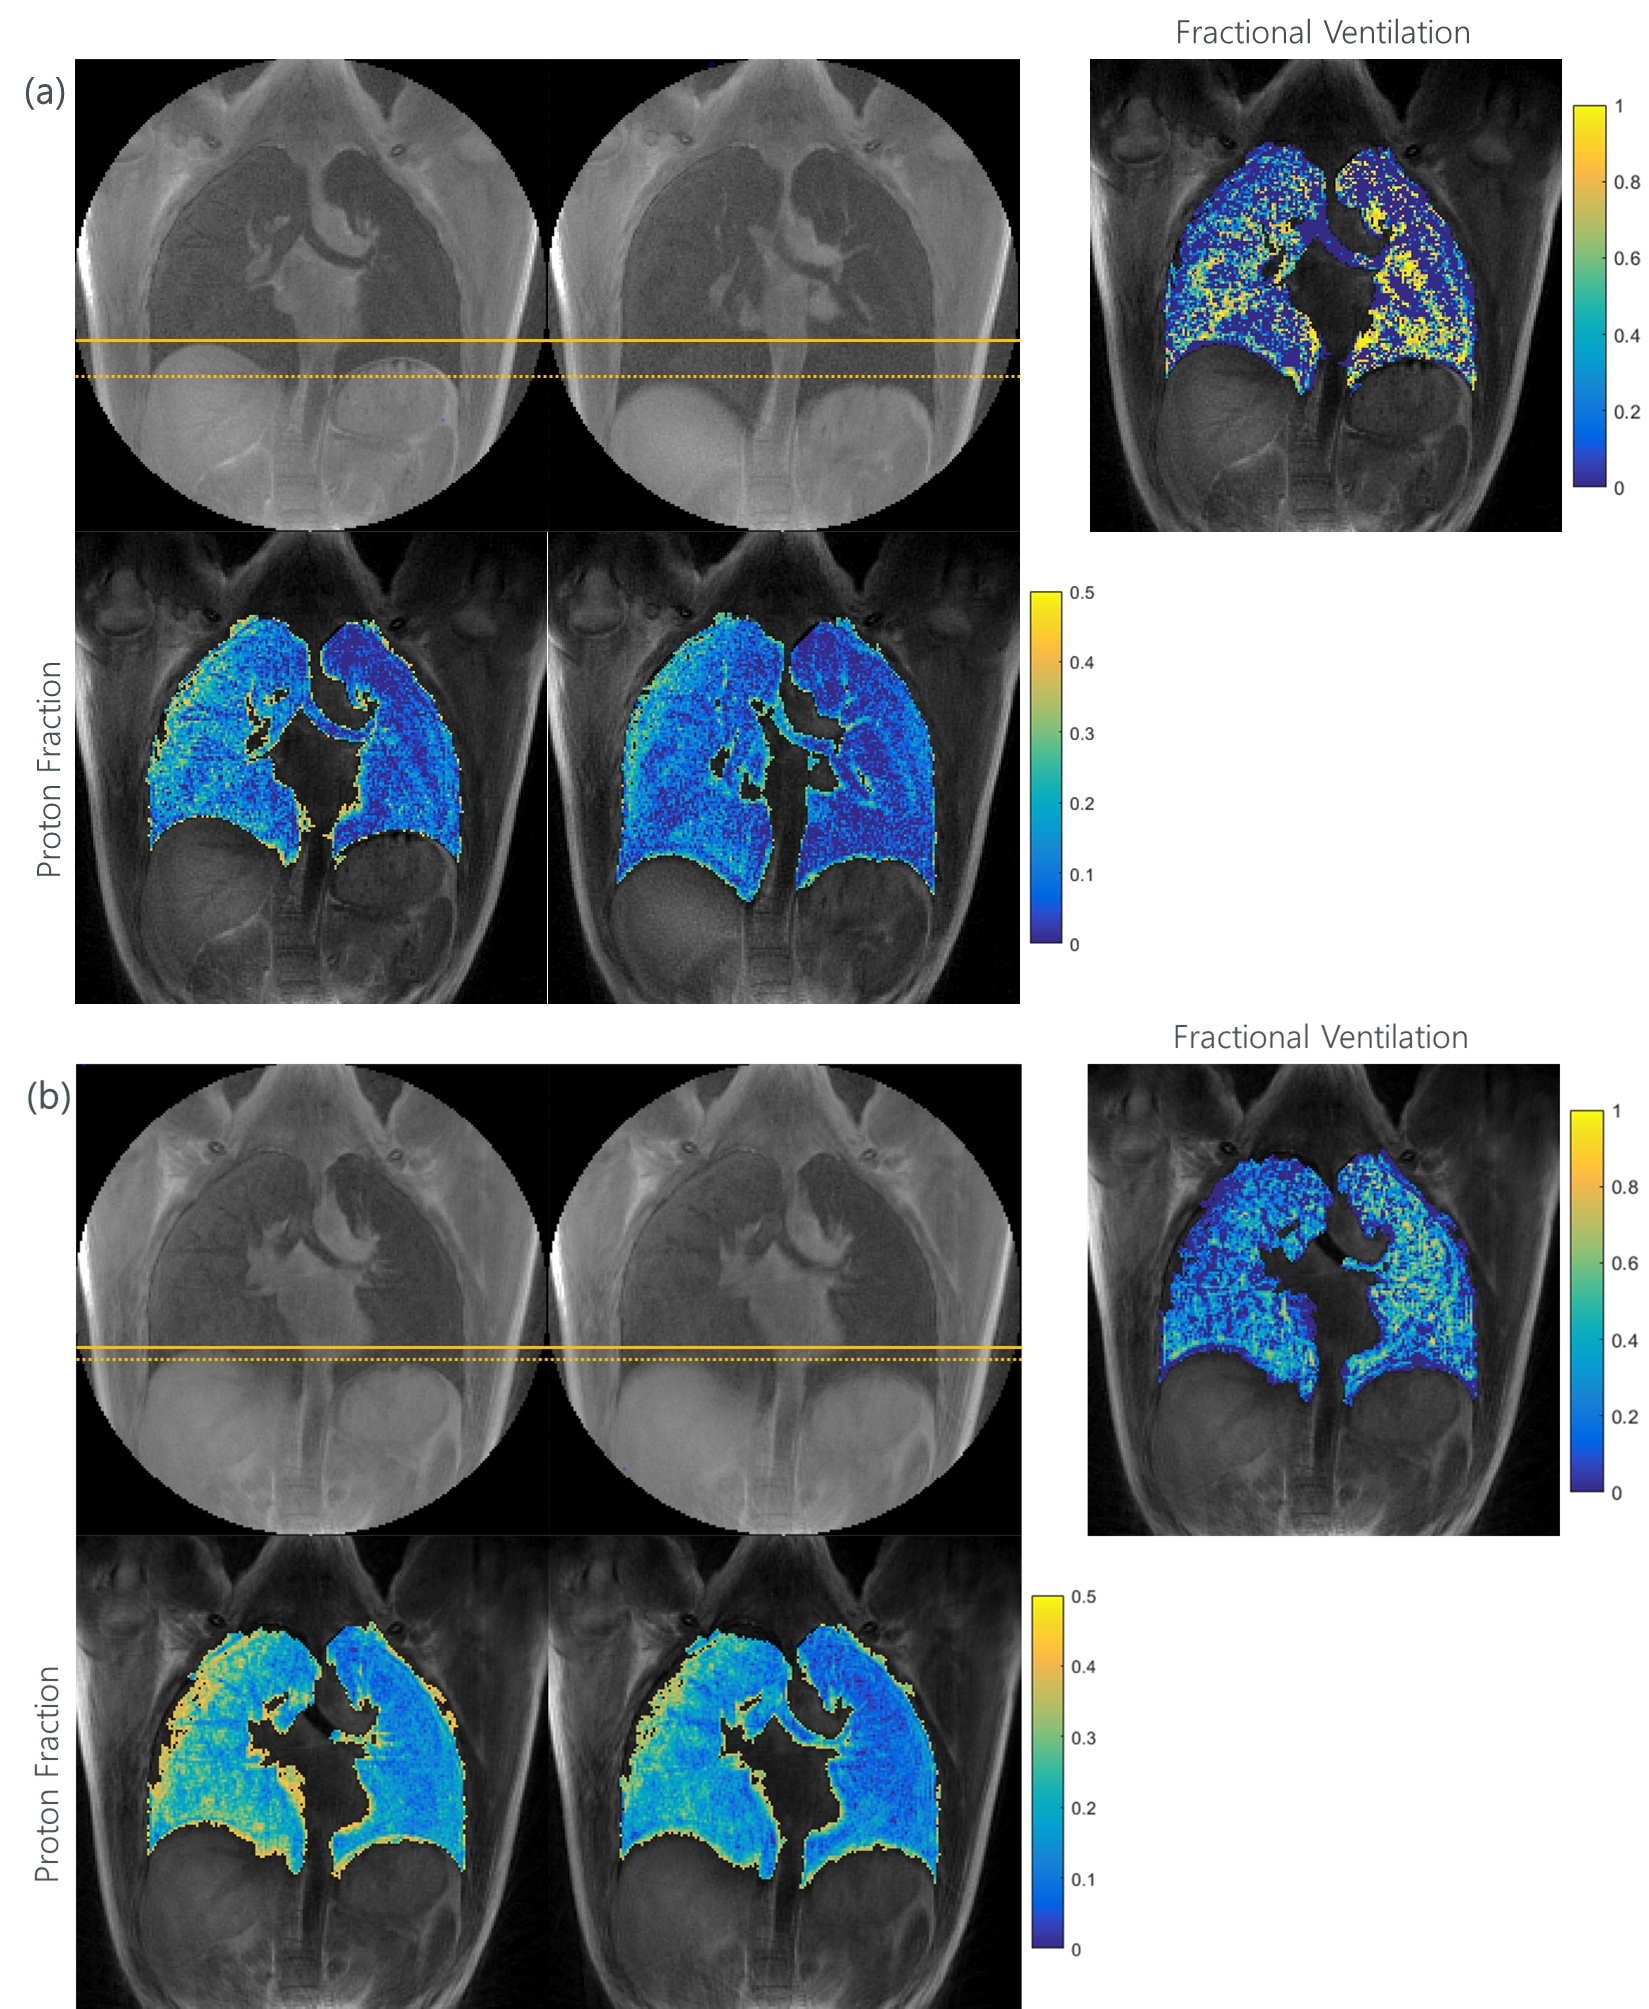
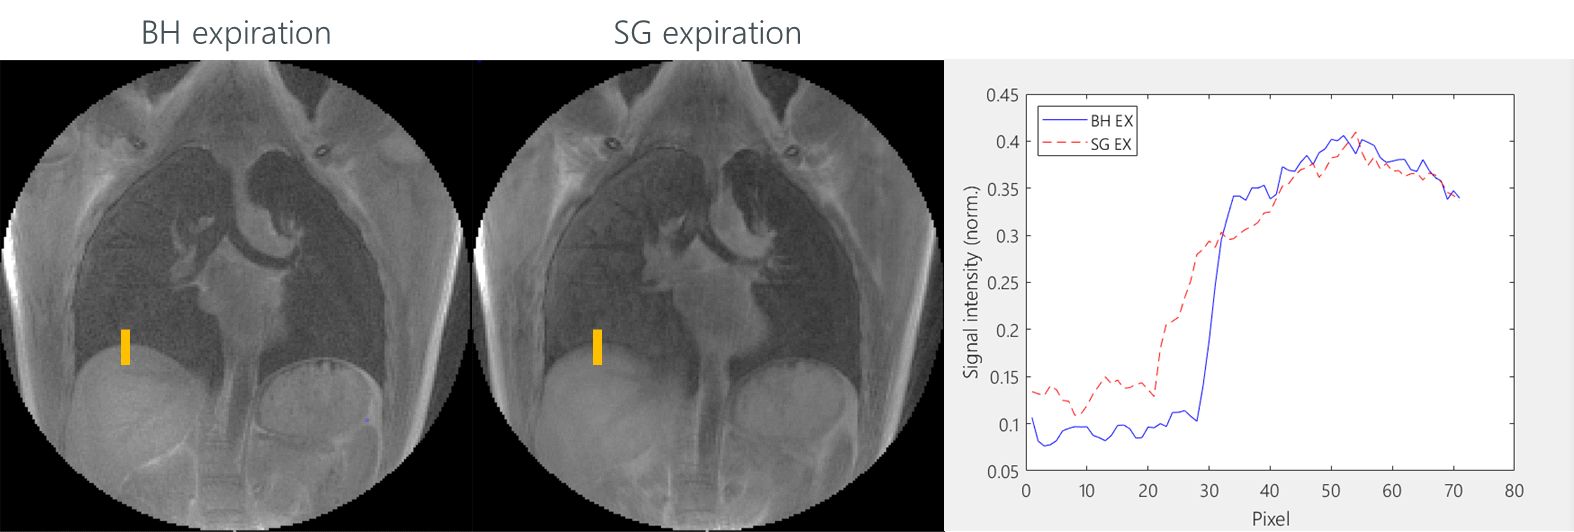
tyGA SOS data of eight healthy volunteers (5 non-smoker, 3 smoker) were acquired during breathhold and free-breathing with a 3T MR whole-body system (Ingenia 3T, Philips Healthcare, Best, The Netherlands) in coronal slice. The parameters were as: TE=0.17ms, TR=2.0ms(BH)/2.3ms(FB), flip angle=4°, slice thickness=8mm, FOV=400mmx400mm, tiny golden angle φ7. In FB 13-fold oversampling was used to ensure sufficient multi-respiratory phase data after gating. The number of the slices was adopted to the actual volunteer to ensure complete coverage of the lung. Applying image-based self-gating technique (7) images in the end-expiration (EX) and end-inspiration (IN) phase were reconstructed from the FB data.From the signal intensities in the lung parenchyma the fractional ventilation (FV) (8,9), proton fraction (PF) (4,10) and signal-to-noise ratio (SNR) (11) were calculated. Additional the sharpness of the lung-liver interface was compared between the BH and FB images according to the slope (m) of the SI curve in a defined ROI (Figure 4) over the lung-liver interface obtained in the normalized magnitude images.
Results
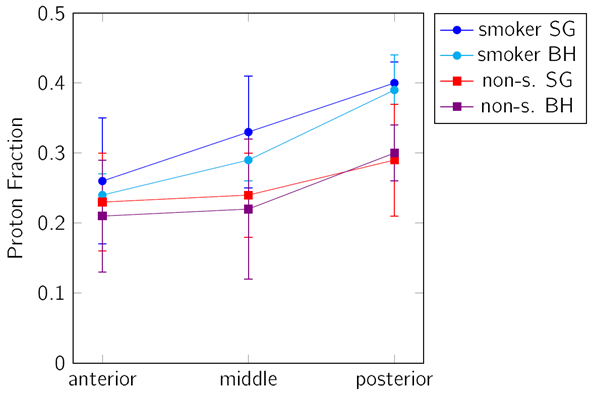
BH as well as FB tyGA SoS yielded sufficient lung parenchymal signal to perform further analysis. The respiratory amplitude resulted larger in the BH (40.79±10.57mm) than in the SG images (7.21±4.37mm). FV and PF could be quantified in all dataset. A clear difference of the signal intensities was observed between expiration and inspiration thus allowing for FV map calculation (Figure 1). The average value for FV was 0.25±0.10 (SG) and 0.46±0.08 (BH). There was no significant difference between the smoker (0.23±0.10 SG, 0.49±0.05 BH) and the non-smoker (0.27±0.10 SG, 0.45±0.09 BH) cohort.A trend to increasing PF values was observed from anterior to posterior was observed with a significant difference between EX and IN (p<0.001). PV values obtained with the BH technique resulted slightly lower as compared to the FB data (Figure 2).
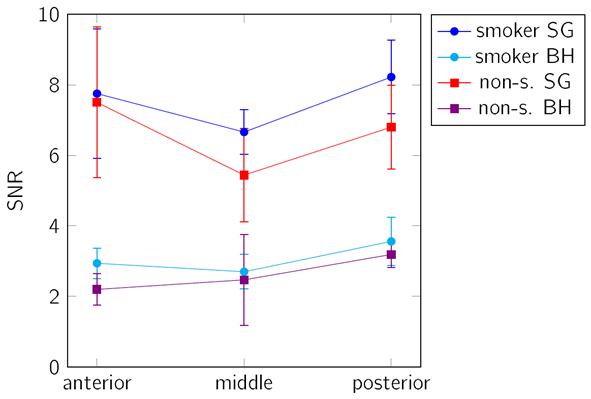
A significant (p<0.001 for SG and p<0.05 for BH) difference between the smoker and non-smoker group was identified. As expected, the SNR resulted significantly higher in the SG images (p<0.001), and showed a significant differences (p<0.001) between EX and IN for both sequences (Figure 3). The sharpness (mBH = 0.060±0.029) of the lung-liver interface resulted superior in the BH images (Figure 4) than in the FB approach (mFB = 0.016±0.007).
Discussion and Conclusion
The feasibility of a free-breathing and breathhold tyGA SoS at 3T for lung parenchyma morphological and functional imaging could be shown. In both cases sufficient SNR for assessment of changes in the lung parenchyma density over the respiratory cycle was observed. Where the self-gating approach showed limitations in case of irregular breathing pattern and due to the on-average small respiratory amplitudes, the application of BH appeared limited by the rather long breathhold duration. Due to the homogenous k-space coverage of the tyGA approach, even in case of residual motion, image artifacts were limited to a slight image blur but no distinct artifacts like streaks could were apparent. This appears also obvious from the inferior image sharpness in FB, which indicates some residual motion within the chosen 20% bin.The observed differences for the PF were as expected and clear differences between EX and IN as well as the increase from anterior to posterior has been reported earlier (1). The slightly increased PF in the SG images may be explained by a slight image blur introduced by the 20% acceptance window. Further, the SNR in the FB images was significantly higher and the noise may have less impact on the final evaluation. The lower SNR in the BH images was expected, because the scan time in BH is shorter.
The sensitivity of the BH and FB approach is sufficient to reveal differences between smoker and non-smoker, with smoker showing significantly higher PF but similar FV has already described in (12). This can likely be explained by an initial inflammatory response of the lung parenchyma, which ha not yet led to a functional impairment.
Acknowledgements
The authors thank the Ulm University Center for Translational Imaging MoMAN for its support.References
1. Lederlin M, Crémillieux Y. Three-dimensional assessment of lung tissue density using a clinical ultrashort echo time at 3 tesla: a feasibility study in healthy subjects. J. Magn. Reson. Imaging 2014;40:839–847.
2. Tibiletti M, Kjørstad A, Bianchi A, Schad LR, Stiller D, Rasche V. Multistage self-gated lung imaging in small rodents. Magn. Reson. Med. 2016;75:2448–2454.
3. Tibiletti M, Paul J, Bianchi A, et al. Multistage three-dimensional UTE lung imaging by image-based self-gating. Magn. Reson. Med. 2016;75:1324–1332.
4. Hatabu H, Alsop DC, Listerud J, Bonnet M, Gefter WB. T2* and proton density measurement of normal human lung parenchyma using submillisecond echo time gradient echo magnetic resonance imaging. Eur. J. Radiol. 1999;29:245–252.
5. Liu J, Spincemaille P, Codella NC, Nguyen TD, Prince MR, Wang Y. Respiratory and cardiac self-gated free-breathing cardiac CINE imaging with multiecho 3D hybrid radial SSFP acquisition. Magn. Reson. Med. 2010;63:1230–1237.
6. Wundrak S, Paul J, Ulrici J, Hell E, Rasche V. A small surrogate for the golden angle in time-resolved radial MRI based on generalized fibonacci sequences. IEEE Trans. Med. Imaging 2014;34:1262–1269.
7. Paul J, Divkovic E, Wundrak S, et al. High-resolution respiratory self-gated golden angle cardiac MRI: comparison of self-gating methods in combination with k-t SPARSE SENSE. Magn. Reson. Med. 2015;73:292–298.
8. Zapke M, Topf H-G, Zenker M, et al. Magnetic resonance lung function–a breakthrough for lung imaging and functional assessment? A phantom study and clinical trial. Respir. Res. 2006;7:106.
9. Kjørstad \AAsmund, Corteville DM, Henzler T, et al. Quantitative lung ventilation using Fourier decomposition MRI; comparison and initial study. Magn. Reson. Mater. Phys. Biol. Med. 2014;27:467–476.
10. Yu J, Xue Y, Song HK. Comparison of lung T2* during free-breathing at 1.5 T and 3.0 T with ultrashort echo time imaging. Magn. Reson. Med. 2011;66:248–254.
11. Rasche V, Binner L, Cavagna F, et al. Whole-heart coronary vein imaging: A comparison between non-contrast-agent-and contrast-agent-enhanced visualization of the coronary venous system. Magn. Reson. Med. Off. J. Int. Soc. Magn. Reson. Med. 2007;57:1019–1026.
12. Balasch A, Metze P, Stumpf K, et al. 2D Ultrashort Echo-Time Functional Lung Imaging. J. Magn. Reson. Imaging 2020;52:1637–1644 doi: https://doi.org/10.1002/jmri.27269.
Figures