3240
Perfusion evaluation in small animal with 2D tiny golden angle UTE1Department of Internal Medicine II, Ulm University Medical Center, Ulm, Germany, Ulm, Germany, 2Core Facility Small Animal Imaging (CF-SANI), Ulm University, Ulm, Germany, Ulm, Germany
Synopsis
In this study, a two dimensional ultra-short echo-time technique was combined with tiny golden angle angular ordering for investigating its feasibility of qualitative assessment of contrast agent dynamics in the lungs after systemic injection.
Purpose
The feasibility of deriving perfusion information, a 2D tiny golden angle UTE (2D tyGA UTE) multi-slice acquisition during systemic administration of contrast agent (CA).Introduction
Due to the small anatomy dimensions, high respiratory and heart rate and the very short T2* value for the lung tissue in high magnetic fields (1,2) lung imaging is intrinsically challenging in small animals. Ultra-short echo-time imaging showed promising results in the past (3,4). In this contribution, a 2D tyGA UTE sequence with interleaved multi-slice acquisition was applied during systemic administration of contrast agent. Perfusion data was derived from dynamic reconstructions with different temporal resolutions.Methods
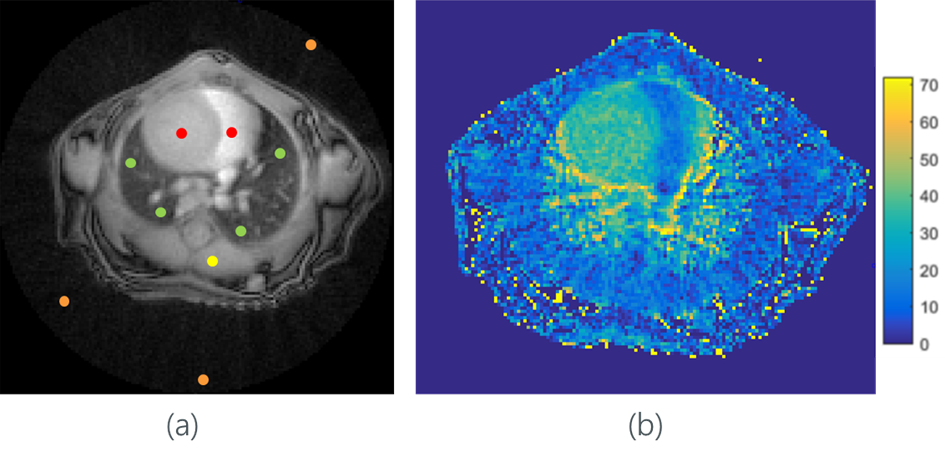
Seven healthy female mice (mean age 12 weeks, mean weight 22.21g±1.09g at the beginning of the study) were investigated on a 11.7T small animal MR system (BioSpec 117/16, Bruker Biospin, Ettlingen, Germany). The animals were anesthetized with isoflurane (5% for induction, 1%-1.5% to maintain the respiratory frequency between 100-120 respiratory cycles per minute) in medical air (0.1 L/min). The investigation was done with a 2D tyGA UTE sequence including interleaved multi-slice acquisition with n=8 slices. The acquisition parameters were: TE = 0.253ms, TR = 3ms, FA = 10°, slice thickness sD = 1mm, matrix = 150x150, FOV = 30mmx30mm, resolution = 0.2²mm², tiny golden angle ψ7 (5), continuous data acquisition over 5 minutes. After two minutes scanning the contrast agent (single bolus of around 35-50ul with triple-dose Gd3+, 0.3mmol/kg gadolinium) was injected into the tail vein.Sliding window reconstructions with the in-house developed reconstruction were performed to reconstructed time series with a constant temporal increment (ninc = 25 projections, Δt = n*TR*ninc = 600ms) and different window width (nW = 100, 250, 500 and 1000 projections, tW = 2.4s, 6s, 12s, 24s). Signal intensities of different ROIs in heart, lung, muscle and background (Figure 1a) were investigated over time. The lung ROIs ware carefully chosen to avoid vessels. The perfusion was evaluated by the calculation of the percentage change of the signal intensity after CA injection (6).
Results
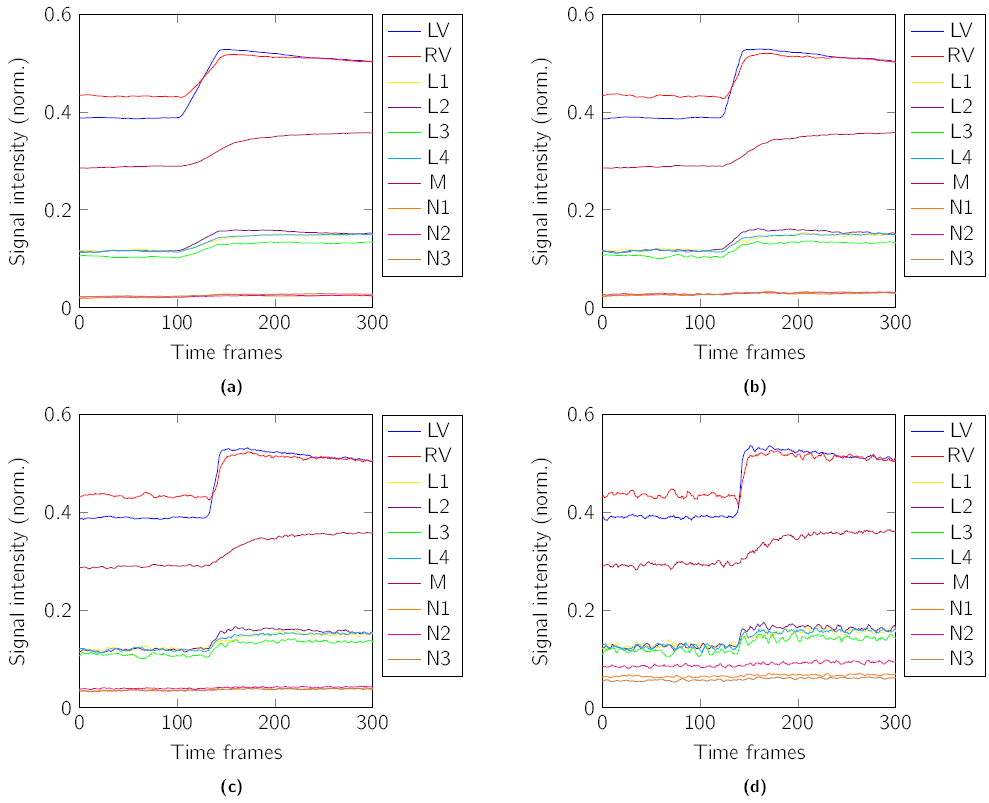
In all mice the protocol was successfully applied. The inflow of the contrast agent was visible in heart, lung and muscle (Figure 2). In the heart, left (LV) and right (RV) ventricle, and lung areas (L1-4) a rapid uptake could be observed. In the muscle the uptake was slower. In the heart a slight but steady signal decrease was observed after the peak enhancement. In the lung area the enhancement was constant. The sliding window reconstructions with higher temporal resolution showed more details of the contrast agent dynamics although the noise has increased. The percentage change between prior and post CA injection resulted in 38±12% (LV), 24±12% (RV), 41±15% (lung) and 31±10% (muscle) (Figure 1b).Discussion and Conclusion
The study showed the feasibility of the combination of the tyGA technique with the single bolus Gd injection to qualitative assess lung perfusion. The increases of the signal intensities demonstrated the characteristics of the different tissues. With the unique angular ordering of the tyGA technique trading temporal vs spatial resolution or SNR is feasible thus enabling application tailored image quality.Acknowledgements
The authors thank the Ulm University Center for Translational Imaging MoMAN for its support.References
1. Takahashi M, Kubo S, Kiryu S, Gee J, Hatabu H. MR microscopy of the lung in small rodents. Eur. J. Radiol. 2007;64:367–374.
2. Bianchi A, Tibiletti M, Kjørstad A, et al. Three-dimensional accurate detection of lung emphysema in rats using ultra-short and zero echo time MRI. NMR Biomed. 2015;28:1471–1479.
3. Tibiletti M, Kjørstad A, Bianchi A, Schad LR, Stiller D, Rasche V. Multistage self-gated lung imaging in small rodents. Magn. Reson. Med. 2016;75:2448–2454.
4. Tibiletti M, Bianchi A, Kjørstad \AAsmund, Wundrak S, Stiller D, Rasche V. Respiratory self-gated 3 D UTE for lung imaging in small animal MRI. Magn. Reson. Med. 2017;78:739–745.
5. Wundrak S, Paul J, Ulrici J, Hell E, Rasche V. A small surrogate for the golden angle in time-resolved radial MRI based on generalized fibonacci sequences. IEEE Trans. Med. Imaging 2014;34:1262–1269.
6. Togao O, Ohno Y, Dimitrov I, Hsia CC, Takahashi M. Ventilation/perfusion imaging of the lung using ultra-short echo time (UTE) MRI in an animal model of pulmonary embolism. J. Magn. Reson. Imaging 2011;34:539–546 doi: https://doi.org/10.1002/jmri.22645.
Figures