3239
Pulmonary Ventilation Analysis Using 1H Ultra-Short Echo Time (UTE) Lung MRI: A Reproducibility Study1Bioengineering, UC Berkeley - UCSF, San Francisco, CA, United States, 2GE Healthcare, Menlo Park, CA, United States, 3Radiology and Biomedical Imaging, University of California, San Francisco, San Francisco, CA, United States
Synopsis
In this abstract, we conducted a reproducibility study on the Jacobian determinant-based regional ventilation quantification of 1H phase-resolved ultrashort-echo (UTE) lung MRI. We evaluated its feasibility on five healthy adult volunteers and the influence of three registration approaches, cyclic registration, multi-b-spline, and symmetric image normalization (SyN). Regional ventilation maps of two scans, split violin plots of each individual’s regional ventilation distribution, within-subject coefficient of variation, and Bland-Altman plot and linear regression of total ventilation are presented. We demonstrated that Jacobian determinant ventilation quantification and the registration methods are reproducible and may be applied to patient studies in the future.
Introduction
1H ultra-short echo time (UTE) MRI is favorable for free-breathing lung imaging because it enables imaging of short T2* species and is motion robust. XD-GRASP1 and self-navigated motion-resolved reconstruction2 utilize the center of k-space or low spatial high temporal resolution images as self-navigators to reconstruct lung images at different respiratory positions. Building on these ideas, we proposed a phase-resolved reconstruction3, which further distinguishes the data acquired during inhalation and exhalation and reconstructs a set of 4D images, and applied a Jacobian determinant-based method for ventilation quantification4. However, regional ventilation analysis relies heavily on the accuracy of the registration algorithm. In this study, we aim at evaluating the robustness of the Jacobian determinant-based ventilation quantification and the effects of registration methods by a reproducibility study.Methods
The lung MR images of five healthy volunteers (age 23-30) were acquired using a 3T clinical scanner (MR750, GE Healthcare, Waukesha, WI) with an 8-channel cardiac coil. The pipeline for the study is shown in Fig.1.A variable-density 3D radial UTE sequence5 with golden angle ordering was used during the free-breathing scan. The key parameters were: flip angle=4°, FOV=40 cm, TE/TR=0.1/2.4ms, BW=+/-125 kHz, #spokes=200,000, resolution=2.5mm isotropic(Fig.1A). For studying reproducibility, we scanned each subject with the same sequence twice in the same day, re-setting up the coils between the scans.
The data were first binned into 12 phases according to their respiratory cycle timing(Fig.1B-D) derived from the center of k-space. Then the 4D phase-resolved images, three spatial dimensions plus a respiratory phase dimension, were reconstructed using the Berkeley Advanced Reconstruction Toolbox6 parallel imaging and compressed sensing function(Fig.1E).
Then, we registered the image of each respiratory state to the end-expiration state(Fig.1F) with three different methods: 1) B-spline 3D+t cyclic registration7 to utilize the cyclic characteristic of breathing pattern, 2) multi B-spline registration8 to account for sliding motion across the chest wall, and 3) symmetric image normalization (SyN)9 with mutual information metric to minimize the effect of intensity change during breathing. The first two were implemented in Elastix10 and the third in ANTs11,12.
Lastly, the ratio of volume at each respiratory state $$$V_{resp}$$$ to the end-expiration $$$V_{end-expi}$$$ was calculated by the Jacobian determinant (JD) of the motion field (D), where x,y,z are the spatial dimensions and Id is the 3-by-3 identity matrix.
$$JD=\frac{V_{resp}}{V_{end-expi}}=\left|\det\left[Id+\frac{\partial(D_x,D_y,D_z)}{\partial(x,y,z)}\right]\right|$$
The regional ventilation definition from(13) was adopted to show the local percentage of lung volume change.
$$RVent=\frac{V_{resp}-V_{end-expi}}{V_{end-expi}}=JD-1$$
The logarithm within-subject coefficient of variation14 metric is used as the reproducibility measurement. JD1 and JD2 are Jacobian determinants from the 1st and 2nd scan and N are the total number of voxels within the lung.
$$CV=\exp\left\{\sqrt{\frac{1}{N}\sum_{n=1}^N\frac{[\log(JD_1)-\log(JD_2)]^2}{2}}\right\}-1$$
Results
Figure 2 depicts the regional ventilation map overlayed on the registered phase-resolved lung MR images for the three registration methods of one representative volunteer. As seen in the figure, this volunteer exhibits evolving regional ventilation across respiratory phases, and the cyclic b-spline registration method provides the smallest between-scan difference.Figure 3 includes the split violin plots of all five volunteers and three registration methods. The median regional ventilation for a volunteer ranges from 0.15 to 0.2, corresponding to a 15%-20% volume expansion. Subject 3 and 4 have higher regional ventilation in general.
Figure 4 shows the within-subject coefficient of variation table and a summary boxplot. The table indicates that reproducibility varies with phases and registration methods. The boxplot suggests that cyclic B-spline is the most reproducible, followed by SyN.
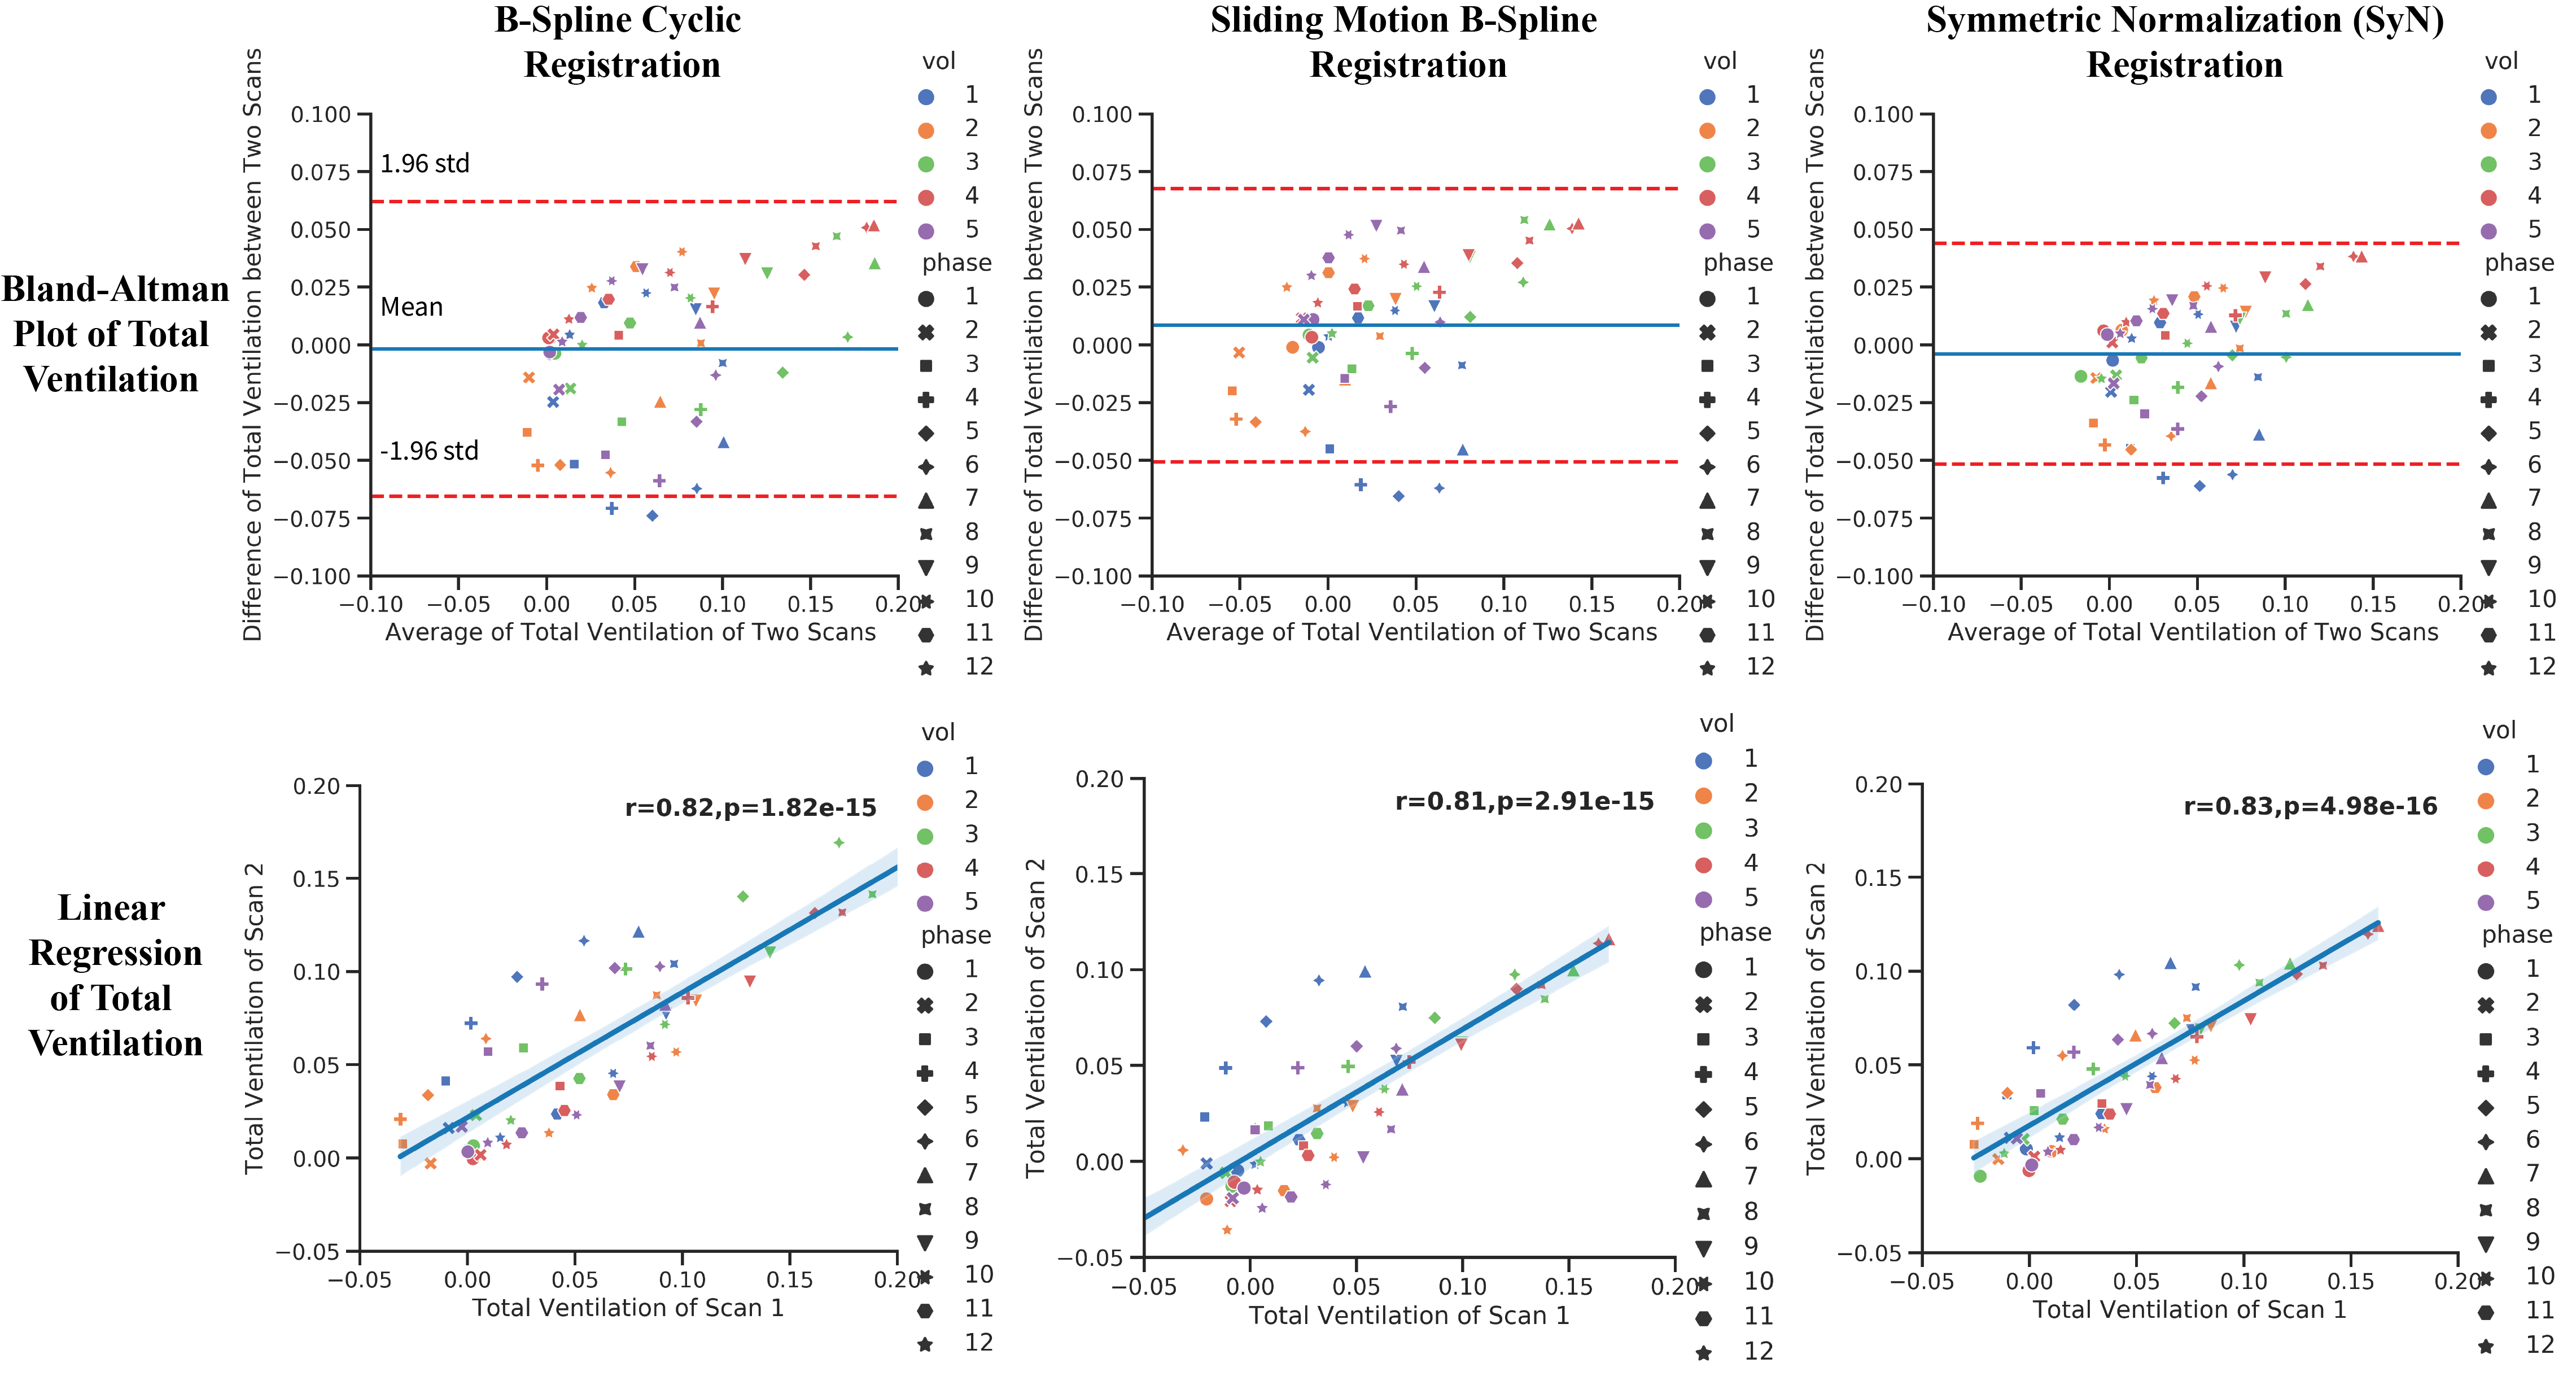
Figure 5 are the Bland-Altman plot and linear regression of the total ventilation. Both plots suggest that there is a slight bias between the two measurements. The markers on the upper-right in each Bland-Altman plot indicate that the respiratory phases closer to end-inspiration, phase 4-8, are less reproducible than the phases closer to the end-expiration. All three registration methods showed high correlations in linear regression, with Spearman r values 0.81-0.83 and p-values close to 0. Total ventilation of volunteer 1 deviates most from the regression line, which matches our observation from the split violin plot.
Discussion
In the split violin plots, sometimes one scan has lower medians during the inspiratory phases and higher values in the expiration phases. This phenomenon could occur from a phase shift in the reconstructed image. Healthy adult volunteers spend more time in expiration states than inspiration states, causing several images to represent the end-expiration state and making an automatic choice of the starting phase challenging. This could be overcome by careful binning of data or adding end-expiration selection criterion.In the regional ventilation maps of the representative volunteer, we observe smaller differences between the scans in the cyclic b-spline registration method. However, in linear regression, the SyN method had a higher correlation between scans. This could be induced by the regional averaging or the smaller dynamic range of regional ventilation in the SyN method.
Conclusion
In conclusion, the regional ventilation calculated by the Jacobian determinant of the motion field is feasible and reproducible in healthy volunteers. The three registration methods showed similar reproducibility in total ventilation, and the cyclic b-spline showed better reproducibility in regional ventilation. In the future, we aim at applying to pediatric patients with cystic fibrosis and other lung diseases to assist their diagnosis and precise treatments.Acknowledgements
This work is supported by NIH grant R01 HL136965.References
1. Feng L, Axel L, Chandarana H, Block KT, Sodickson DK, Otazo R. XD-GRASP: Golden-angle radial MRI with reconstruction of extra motion-state dimensions using compressed sensing. Magn. Reson. Med. 2016;75:775–788 doi: 10.1002/mrm.25665.
2. Jiang W, Ong F, Johnson KM, et al. Motion robust high resolution 3D free-breathing pulmonary MRI using dynamic 3D image self-navigator. Magn. Reson. Med. 2018;79:2954–2967 doi: 10.1002/mrm.26958.
3. Tan F, Zhu X, Larson PEZ. Dynamic 3D Ventilation Maps with Phase-Resolved Ultrashort Echo Time (UTE) MRI. In: Proc. Intl. Soc. Mag. Reson. Med. 28. ; 2020.
4. Tan F, Zhu X, Larson PEZ. Pulmonary Ventilation Analysis Using Motion-Resolved Ultrashort Echo (UTE) MRI. In: Proc. Intl. Soc. Mag. Reson. Med. 28. ; 2020.
5. Johnson KM, Fain SB, Schiebler ML, Nagle S. Optimized 3D ultrashort echo time pulmonary MRI. Magn. Reson. Med. 2013;70:1241–1250 doi: 10.1002/mrm.24570.
6. Uecker M, Tamir J, Lustig M. BART Toolbox for Computational Magnetic Resonance Imaging doi: DOI: 10.5281/zenodo.592960.
7. Metz CT, Klein S, Schaap M, van Walsum T, Niessen WJ. Nonrigid registration of dynamic medical imaging data using nD+t B-splines and a groupwise optimization approach. Med. Image Anal. 2011;15:238–249 doi: 10.1016/j.media.2010.10.003.
8. Delmon V, Rit S, Pinho R, Sarrut D. Registration of sliding objects using direction dependent B-splines decomposition. Phys. Med. Biol. 2013;58:1303–1314 doi:10.1088/0031-9155/58/5/1303.
9. Avants BB, Epstein CL, Grossman M, Gee JC. Symmetric diffeomorphic image registration with cross-correlation: Evaluating automated labeling of elderly and neurodegenerative brain. Med. Image Anal. 2008;12:26–41 doi: 10.1016/j.media.2007.06.004.
10. Klein S, Staring M, Murphy K, Viergever M a., Pluim J. elastix: A Toolbox for Intensity-Based Medical Image Registration. IEEE Trans. Med. Imaging 2010;29:196–205 doi: 10.1109/TMI.2009.2035616.
11. Avants BB, Tustison NJ, Song G, Cook PA, Klein A, Gee JC. A reproducible evaluation of ANTs similarity metric performance in brain image registration. Neuroimage 2011;54:2033–2044 doi: 10.1016/j.neuroimage.2010.09.025.
12. Avants BB, Tustison NJ, Stauffer M, Song G, Wu B, Gee JC. The Insight ToolKit image registration framework. Front. Neuroinform. 2014;8:1–13 doi: 10.3389/fninf.2014.00044.
13. Klimeš F, Voskrebenzev A, Gutberlet M, et al. 3D phase-resolved functional lung ventilation MR imaging in healthy volunteers and patients with chronic pulmonary disease. Magn. Reson. Med. 2021;85:912–925 doi: 10.1002/mrm.28482.
14. Bland JM, Altman DG. Measurement error proportional to the mean. BMJ 1996;313:106 doi: 10.1136/bmj.313.7049.106.
Figures