3238
Free-breathing oxygen-enhanced pulmonary imaging with self-gated stack-of-spirals ultra-short echo time sequence at 0.55T1Cardiovascular Branch, Division of Intramural Research, National Heart, Lung, and Blood Institute, National Institutes of Health, Bethesda, MD, United States, 2Siemens Medical Solutions USA Inc., Malvern, PA, United States, 3Siemens Healthcare GmbH, Erlangen, Germany
Synopsis
Recently, low-field MRI has been shown to improve the sensitivity of oxygen-enhanced (OE) MRI due to the increased relaxivity of oxygen at lower field strengths. In this work, we demonstrate that using self-gated 3D stack-of-spiral OE-MRI we can further improve the sensitivity and repeatability by: 1) using longer free-breathing acquisitions to increase the signal to noise ratio (SNR) of the acquired images, and 2) improving the consistency of respiratory position between two oxygen states. We also demonstrate that these two improvements give us higher temporal SNR which is a measure of sensitivity in quantitative MRI.
Introduction
High-performance low-field systems can improve the clinical feasibility of combined structural and functional MRI of the lungs1. Oxygen-enhanced MRI (OE-MRI) provides regional information on ventilation and perfusion and is more accessible than hyperpolarized gas MRI2. OE-MRI is improved with low-field MRI due to the increased T1 relaxivity of oxygen at lower field strengths3, which increases the percent signal enhancement between normoxia and hyperoxia images. Majority of OE-MRI methods rely on breath-held imaging4,5, and only a few studies have used free-breathing acquisitions6,7 with respiratory bellows, which are difficult to use and required additional hardware. Breath-holds are difficult for patients with lung disease, and in addition, inconsistent breath-holding position can be a source of quantification error6. Breath-held imaging is also limited in its image resolution and signal-to-noise ratio (SNR) because of the requirement to maintain short breath-hold durations.In this work, we 1) demonstrate the feasibility of self-gated free-breathing stack-of-spirals with an ultra-short echo time (UTE) acquisition for OE-MRI at 0.55T, and 2) compare the measurement repeatability of free-breathing (FB) and breath-held (BH) OE-MRI methods.
Methods
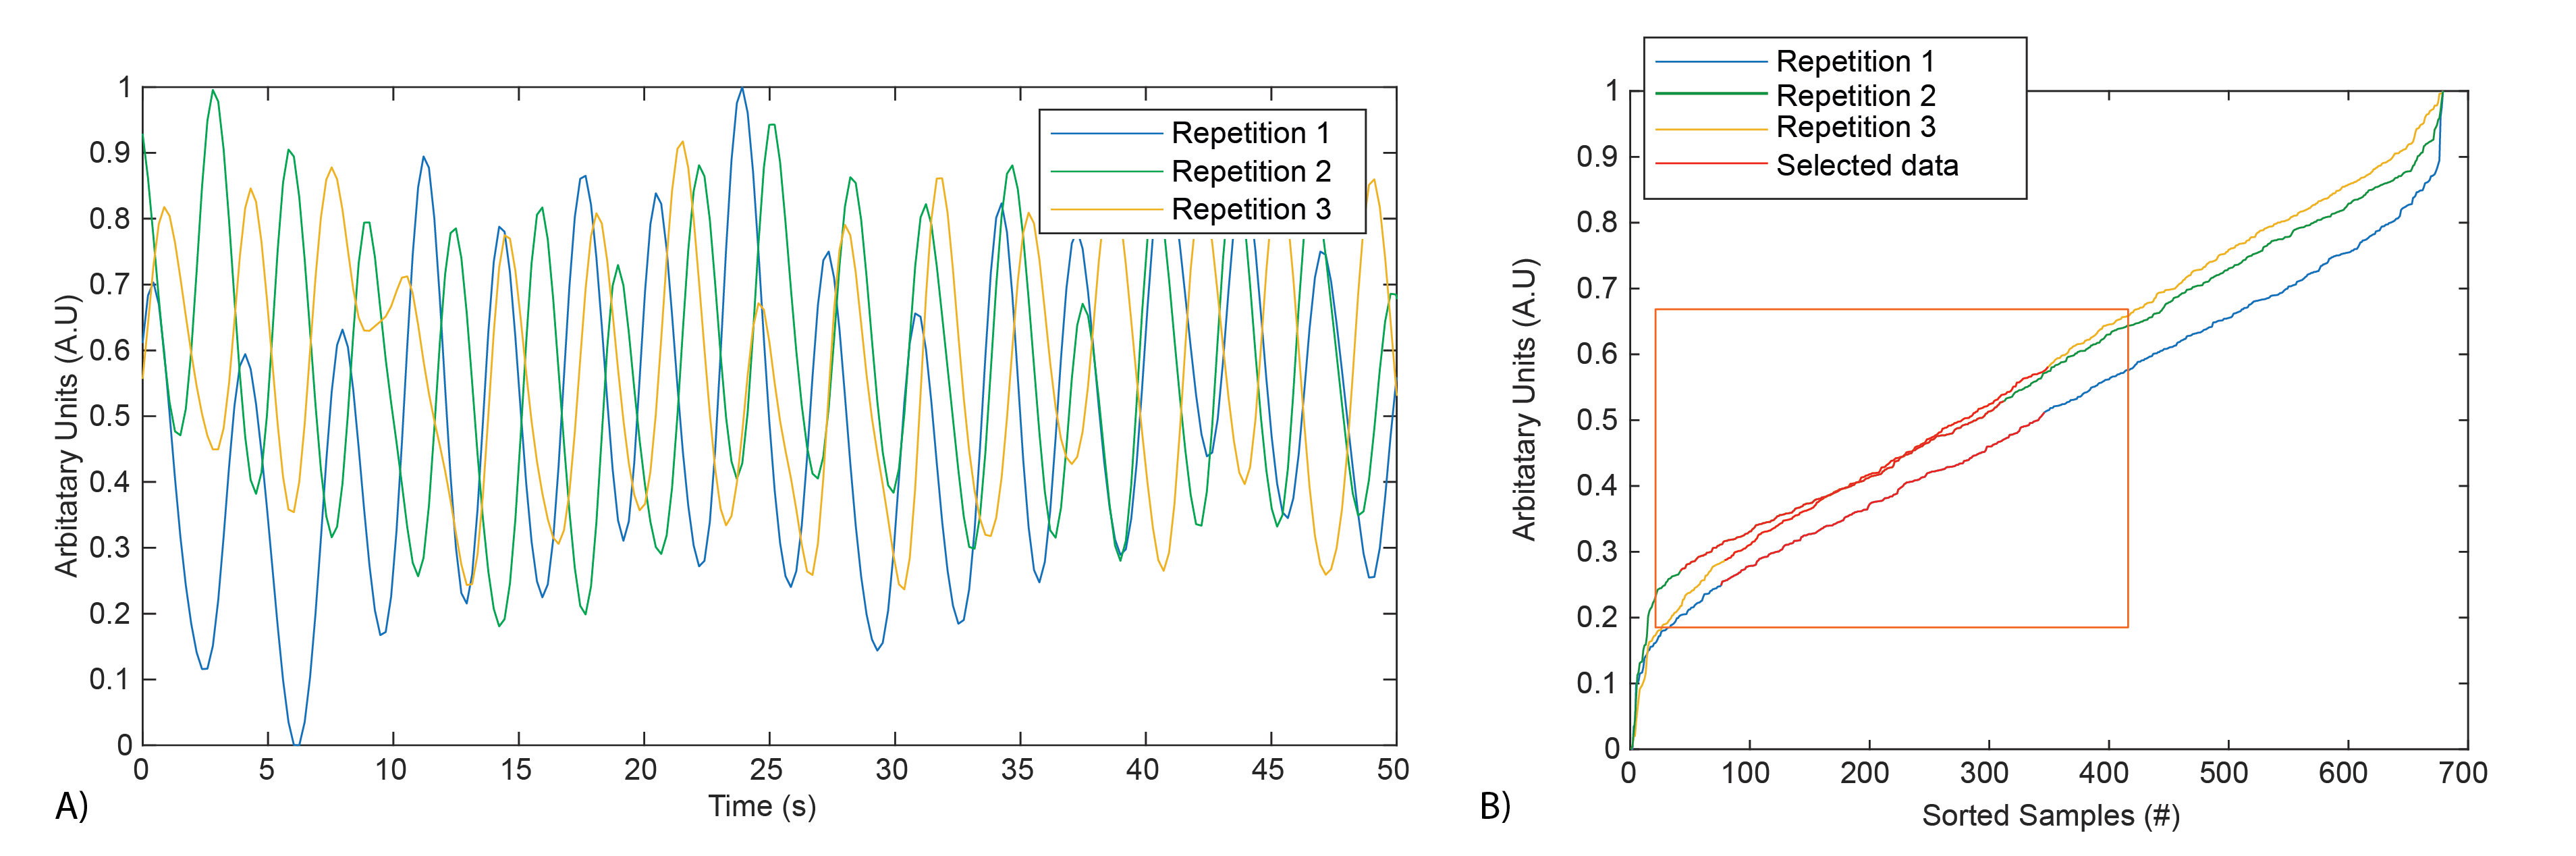
Data Acquisition: We used a prototype 3D T1-weighted UTE spoiled gradient echo stack-of-spirals sequence for imaging during normoxia and hyperoxia on a 0.55T MRI system (prototype MAGNETOM Aera, Siemens Healthcare, Erlangen, Germany). Hyperoxia was induced by inhalation of 15L/min 100% oxygen through a non-rebreather facemask. The transition between normoxia and hyperoxia states was approximately 3 min. Imaging parameters for both BH and FB scans were TE/TR 0.2/6.83 ms, spiral readout = 5 ms, flip angle = 17.5°, FOV = 450x450x320 mm, matrix size = 128x128x32, slice thickness = 10 mm. All scans used a constant density spiral-out readout with a 23 shot design. BH scans were 16s and acquired 61 over-sampled shots with 5.9° angle-increments between shots. FB scans lasted 2:25 min and acquired 591 shots with 137.5° (golden-angle) angle increments. Three navigator readouts were acquired in the FB scans along the superior-inferior (SI) direction for each slice-encoding loop to estimate the respiratory signal.Reconstruction: Respiratory waveforms were extracted from the navigator using previously published methods8. FB data was binned the most stable respiratory phase, chosen as the window of respiratory signal with the smallest gradient (Figure 1B). The amount of accepted data was empirically chosen to be 40%, such that no respiratory motion related blurring was observed in the reconstructed images. Data were reconstructed using Gadgetron9 for both FB and BH acquisitions. Density compensation weights were estimated using an iterative method10. Binned FB data was reconstructed using CG-SENSE.
Experiment: To assess intra-exam repeatability, 4 OE-MRI measurements were performed during a scan session using both the BH and proposed FB methods. Three healthy volunteers were imaged with local institutional review board approval. In 2 volunteers, the scan began with 100% oxygen (O2) and transitioned to room air (RA). In 1 volunteer, the order of physiological states was reversed to adjust for potential bias.
Analysis: OE-MRI analysis was performed in MATLAB (Mathworks, Natick MA). Normoxia images were registered to hyperoxia images using Advanced Normalization Tools (ANTs)11. The Jacobian determinant of the deformation fields from image registration (det(JT)) was used to correct for local signal intensity changes due to volumetric changes in the lung6. Percent signal enhancement (PSE) maps were generated using equation 1. Sixteen PSE maps were estimated from the set of 4 normoxia and 4 hyperoxia, images. Temporal SNR maps (mean signal across repetitions / standard deviation of signal across repetitions) were also calculated for registered and unregistered images to estimate the temporal stability of the lung signal during normoxia and hyperoxia for both BH and FB images.
$$ PSE = \frac{(Im_{hyperoxia} - Im_{normoxia} * det(J_T))}{Im_{normoxia} * det(J_T)} $$
Results
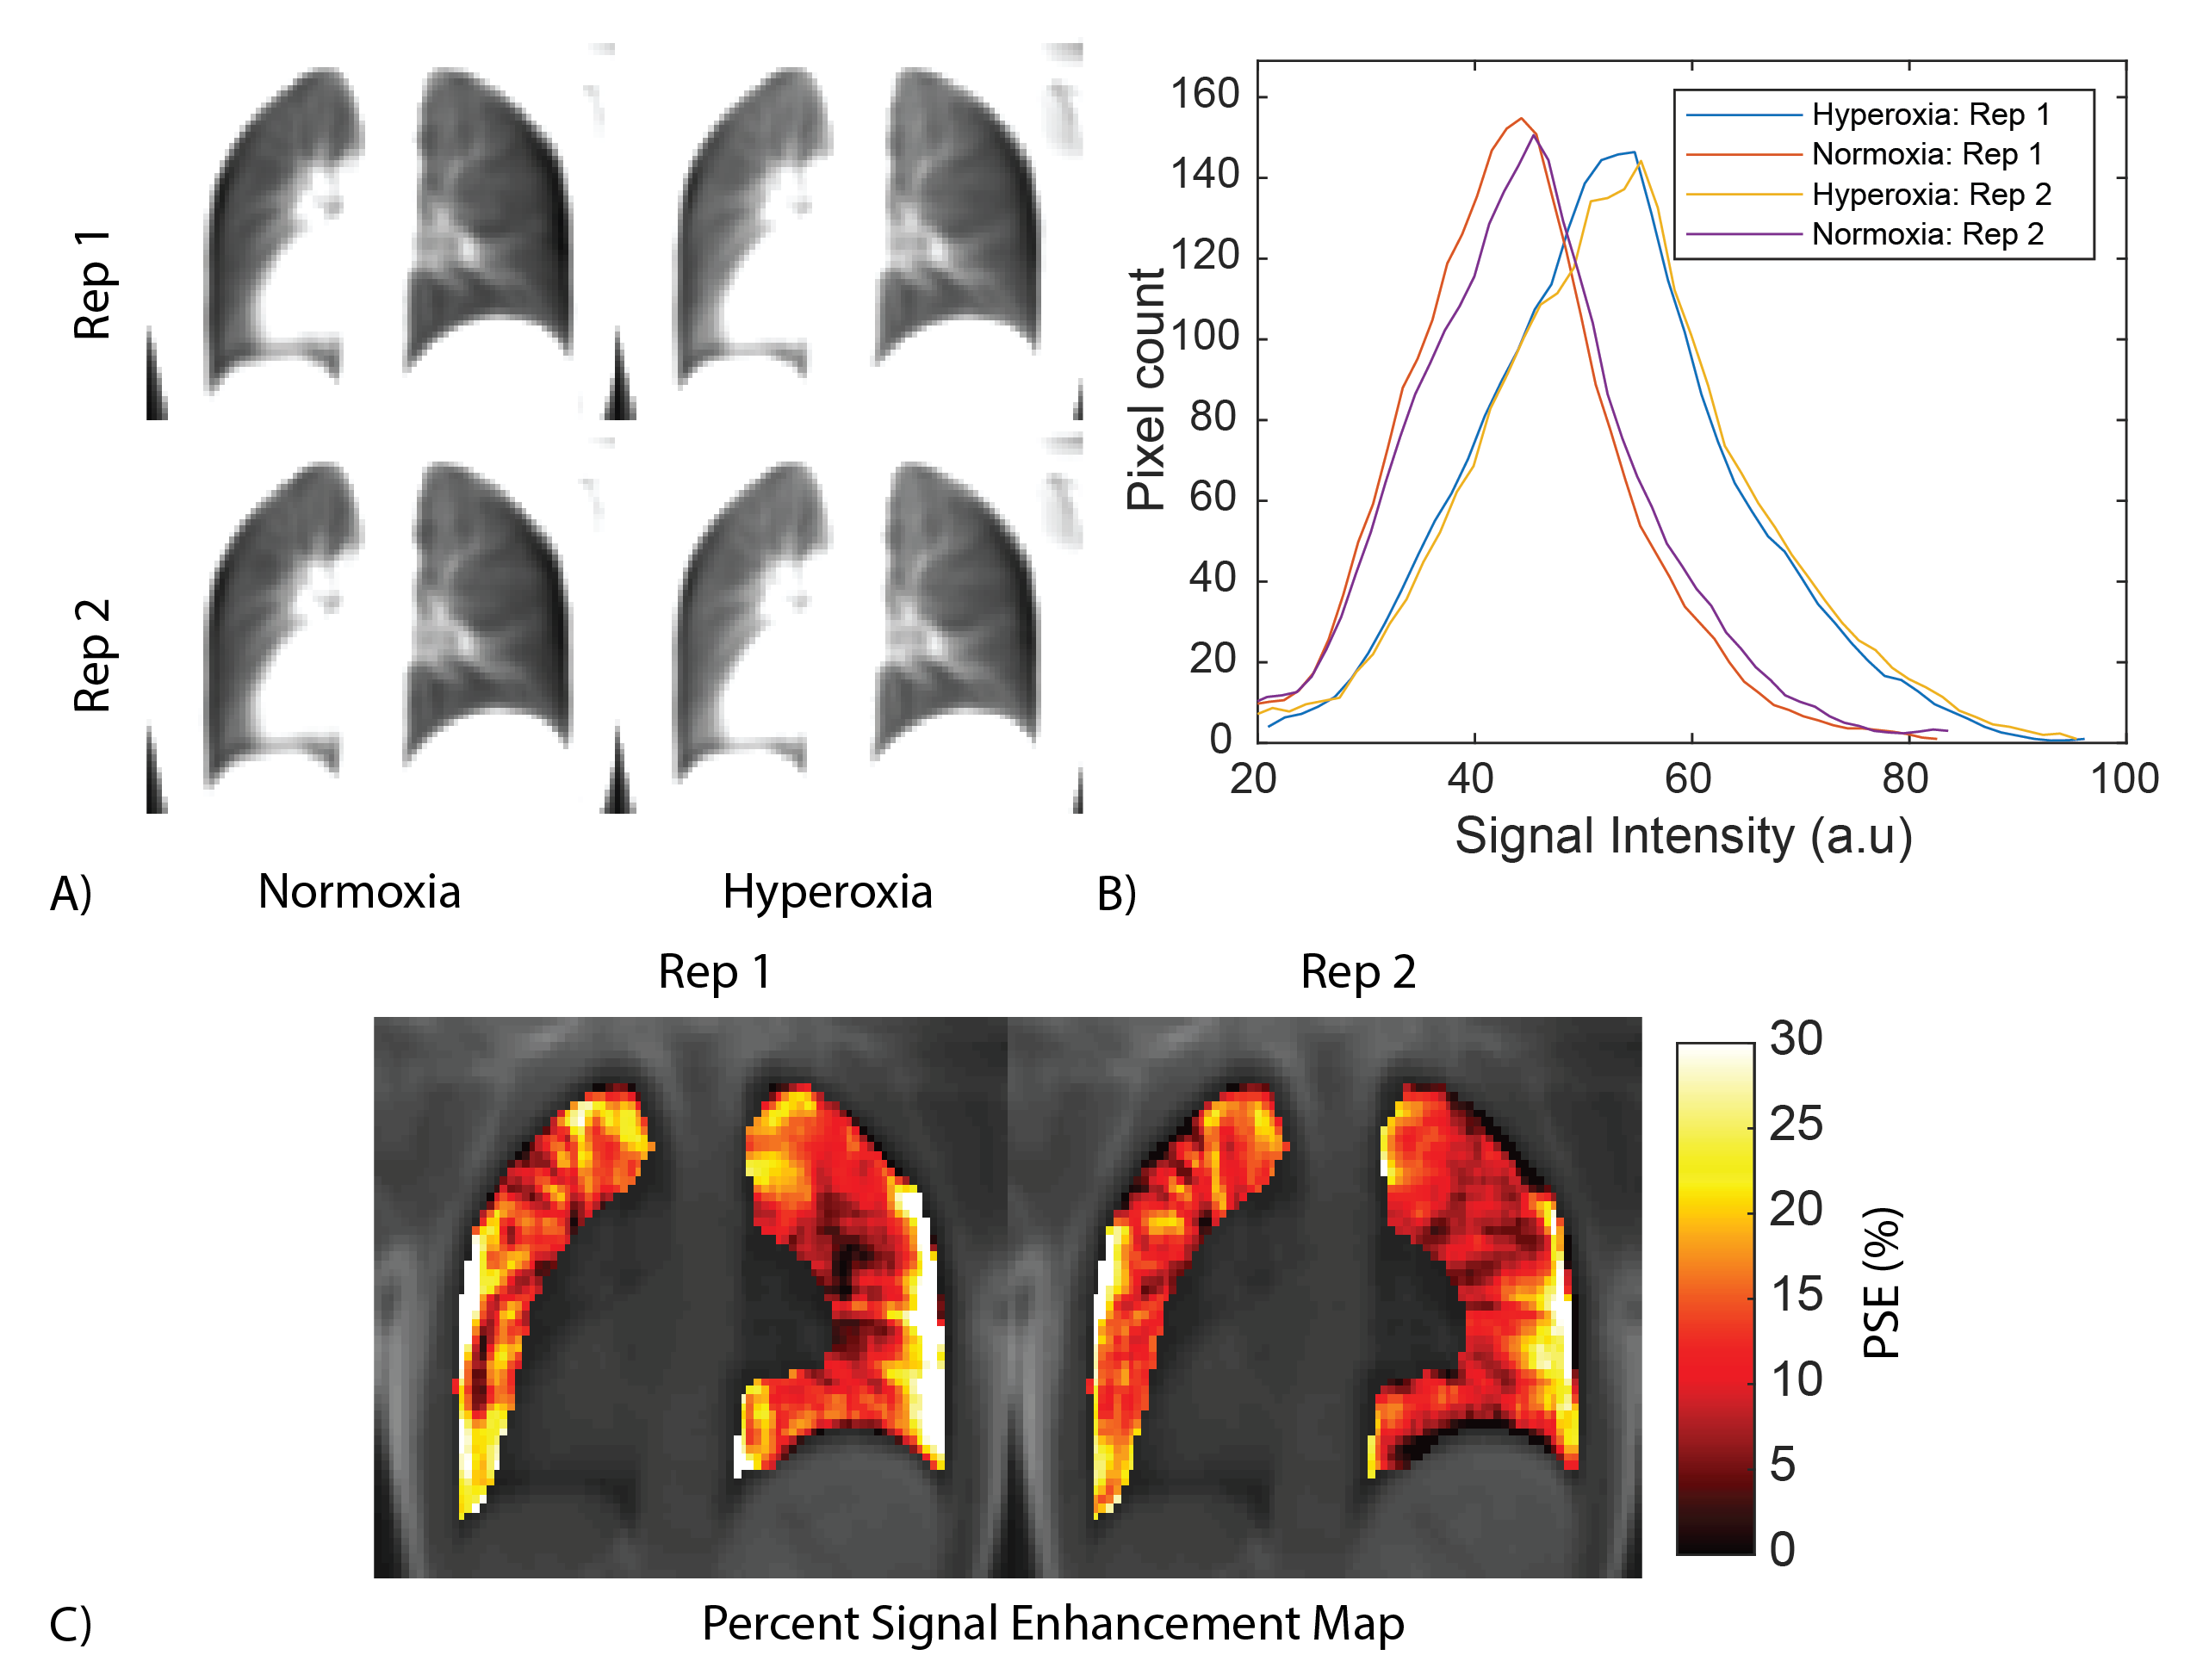
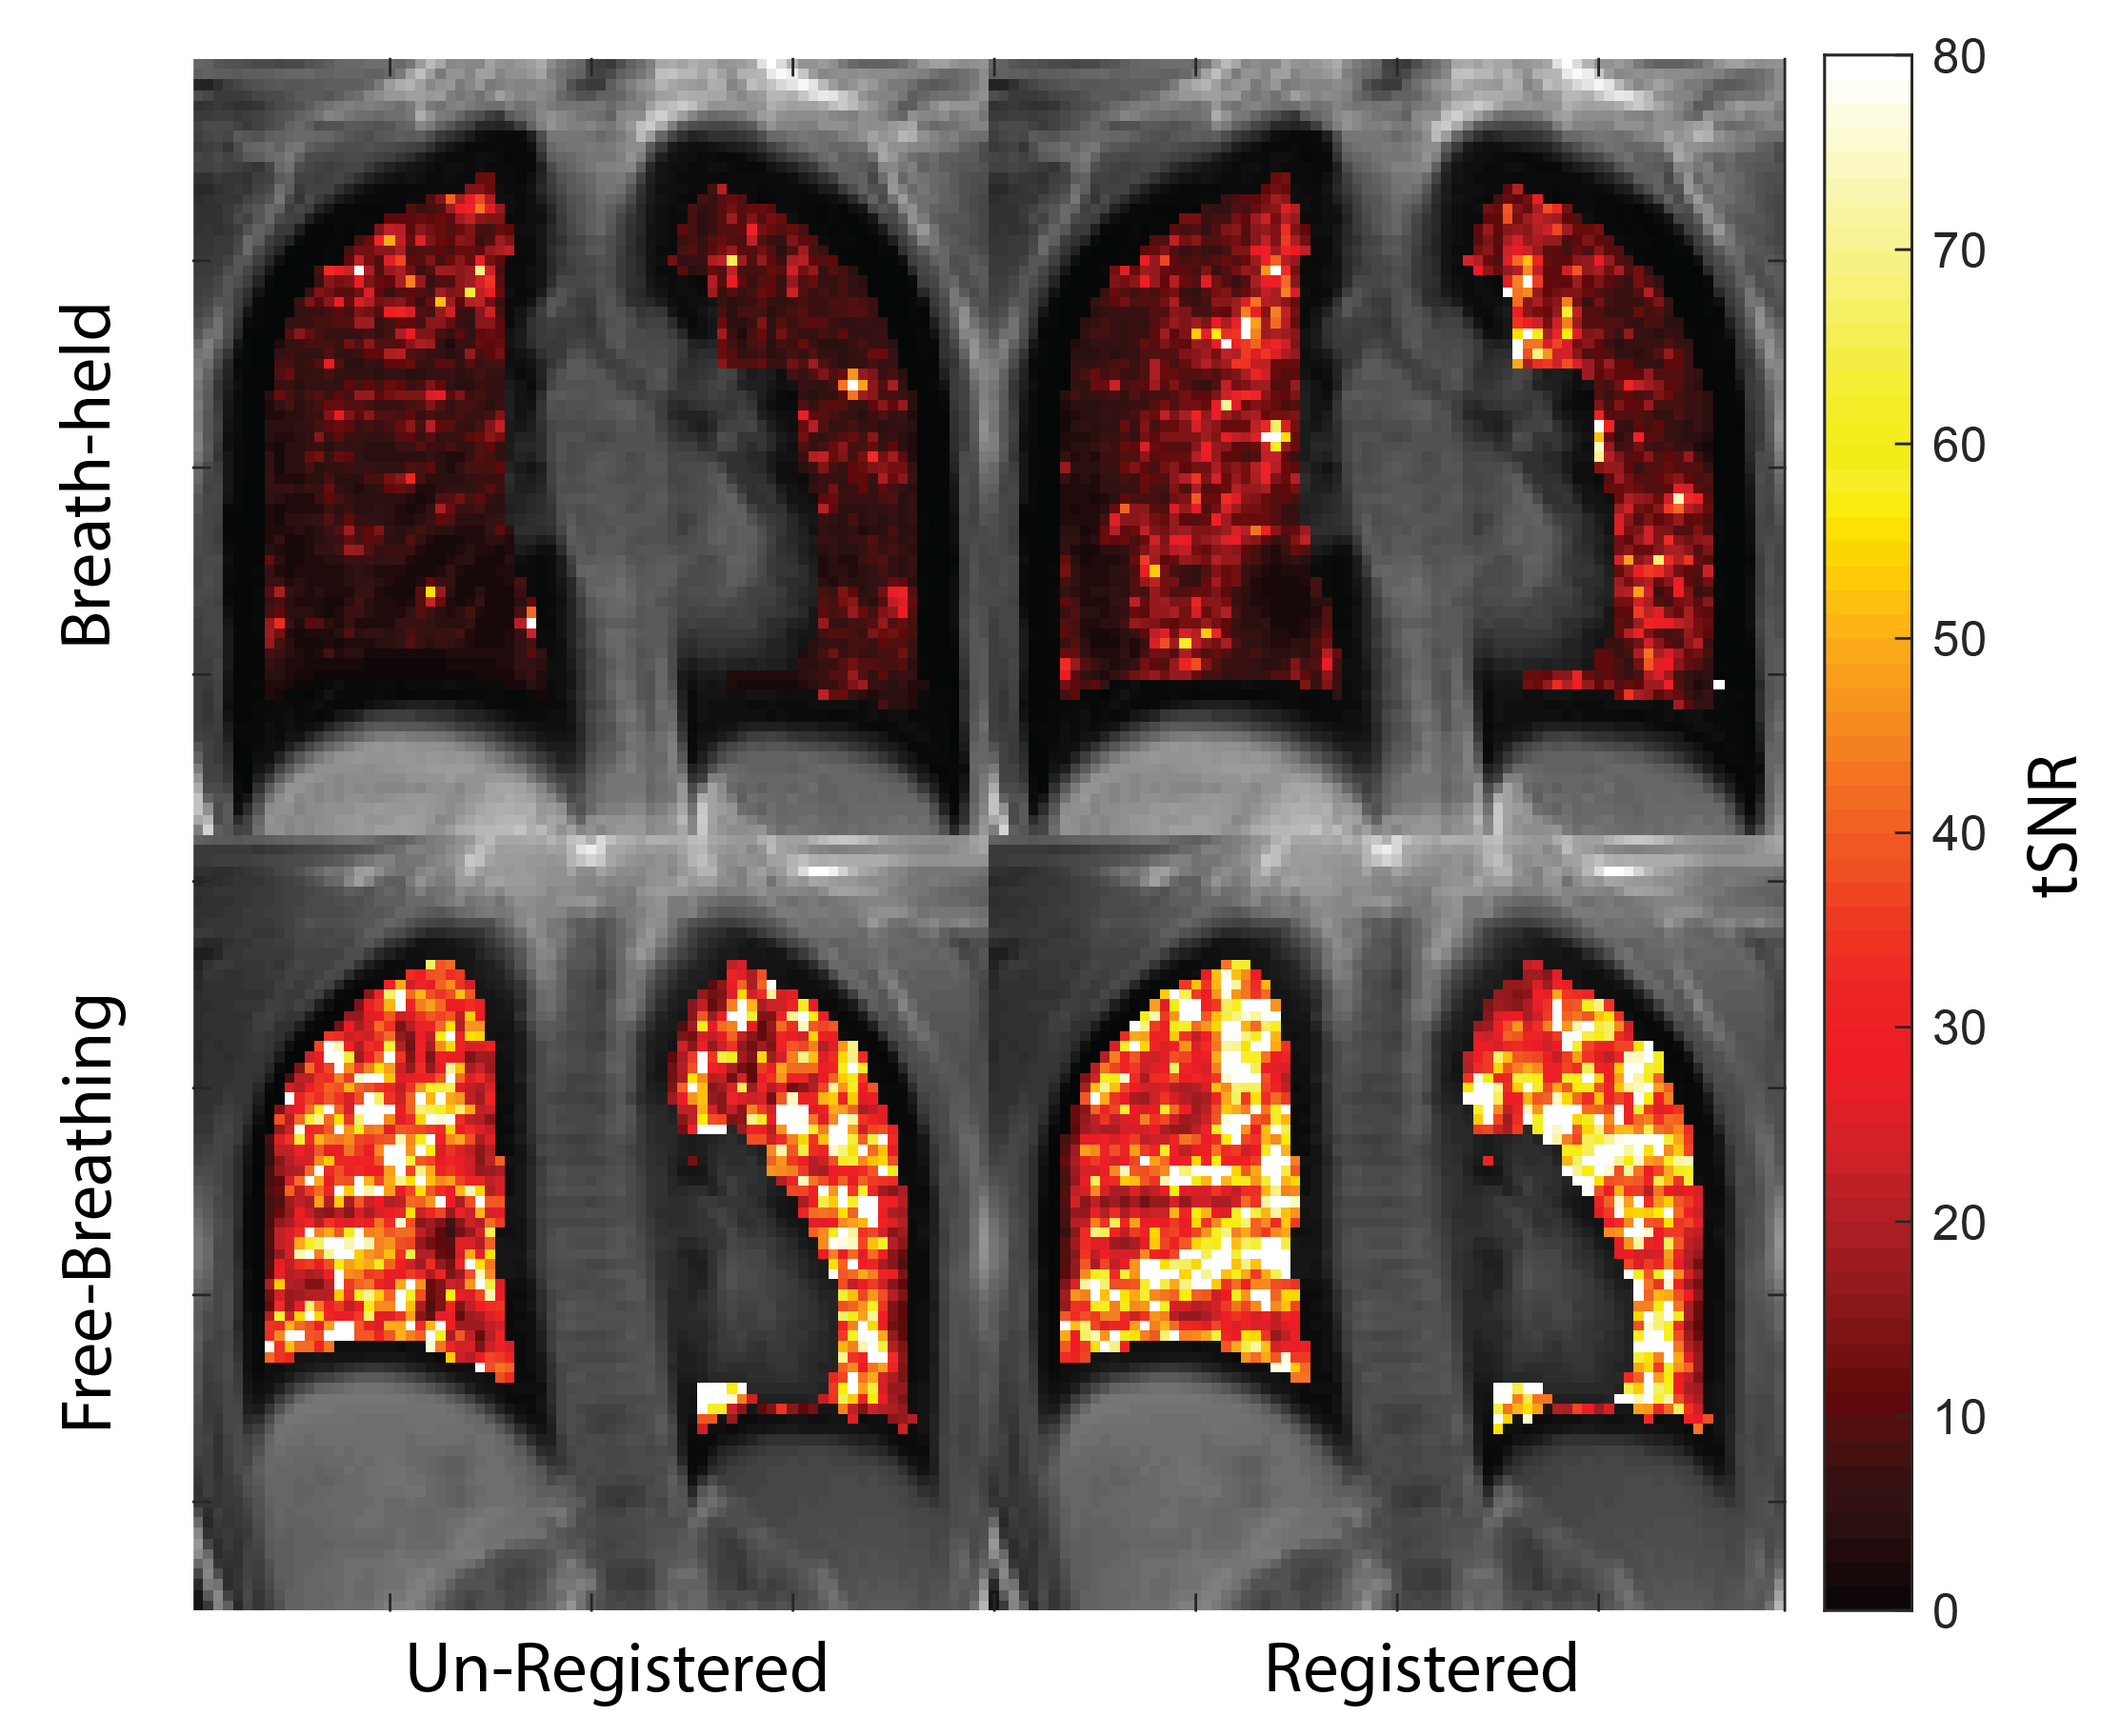
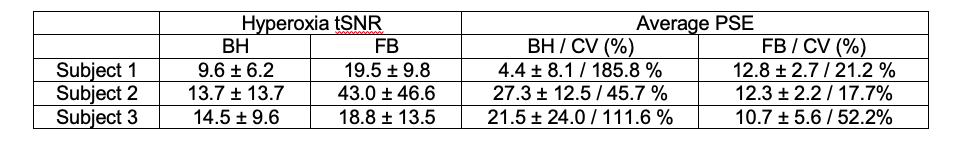
FB stack-of-spirals UTE generated high quality images and PSE maps (Figure 2). FB stack-of-spirals OE-MRI qualitatively showed good repeatability, as demonstrated in two repetitions in Figure 2B,C. The coefficient of variation for the mean PSE was measured to be 30.8 ± 18.42 % for FB OE-MRI across the 3 subjects. By comparison, BH OE-MRI had poor repeatability (coefficient of variation = 114.3 ± 70.1 %). Improved repeatability of FB OE-MRI is attributed to the consistent respiratory phase, resulting in equivalent lung tissue density for each measurement as shown in Figure 3, and higher SNR. Table 1 compares the mean PSE and tSNR in each subject for free-breathing and breath-held protocols. Across all repetitions from 3 healthy volunteers, we measured mean PSE of 11.2% ± 1.1% for our proposed free-breathing protocol, and 17.7% ± 11.9% for breath-held protocol. FB data sets had higher tSNR (27.1+/-13.6) than breath-held data sets (12.6 ± 2.6) which indicates higher sensitivity, as shown in Figure 4, likely due to higher SNR in the FB data.Discussion and Conclusion
We have presented a novel self-gated FB approach for OE-MRI with T1w 3D stack-of-spirals UTE imaging. This approach improves the sensitivity and repeatability of OE-MRI and is easier to use in clinic because it doesn’t require breath holds. This is significant because robust OE-MRI can make routine functional pulmonary imaging clinically viable by capitalizing on the unique properties of high-performance lower field MRI.Acknowledgements
The authors thank Kendall O’Brien and Christine Mancini for their imaging expertise and Margaret (Peg) Lowery, Jennifer Henry and Amelia Nargozian for assistance with patient recruitment. The authors would like to acknowledge the assistance of Siemens Healthcare in the modification of the MRI system for operation at 0.55T under an existing cooperative research agreement (CRADA) between NHLBI and Siemens Healthcare.References
1. Campbell-Washburn AE, Ramasawmy R, Restivo MC, et al. Opportunities in interventional and diagnostic imaging by using high-performance low-field-strength MRI. Radiology. 2019;293(2):384-393.
2. Ohno Y, Koyama H, Lee HY, et al. Oxygen-Enhanced MR Imaging for Lung: Basics and Clinical Applications. Elsevier Inc.; 2017.
3. Mirhej ME. Proton spin relaxation by paramagnetic molecular oxygen. Can J Chem. 1965;43(5):1130-1138.
4. Jakob PM, Wang T, Schultz G, Hebestreit H, Hebestreit A, Hahn D. Assessment of Human Pulmonary Function Using Oxygen-Enhanced T1 Imaging in Patients with Cystic Fibrosis. Magn Reson Med. 2004;51(5):1009-1016.
5. Pusterla O, Bauman G, Bieri O. Three-dimensional oxygen-enhanced MRI of the human lung at 1.5T with ultra-fast balanced steady-state free precession. Magn Reson Med. 2018;79(1):246-255.
6. Kruger SJ, Fain SB, Johnson KM, Cadman R V., Nagle SK. Oxygen-enhanced 3D radial ultrashort echo time magnetic resonance imaging in the healthy human lung. NMR Biomed. 2014;27(12):1535-1541.
7. Zha W, Kruger SJ, Johnson KM, et al. Pulmonary ventilation imaging in asthma and cystic fibrosis using oxygen-enhanced 3D radial ultrashort echo time MRI. J Magn Reson Imaging. 2018;47(5):1287-1297.
8. Grimm R, Bauer S, Kiefer B, Hornegger J, Block T. Optimal Channel Selection for Respiratory Self-Gating Signals. In: International Society of Magnetic Resonance in Medicine. Salt Lake City; 2013:3749.
9. Hansen MS, Sørensen TS. Gadgetron: An open source framework for medical image reconstruction. Magn Reson Med. 2013;69(6):1768-1776.
10. Pipe JG, Menon P. Sampling density compensation in MRI: Rationale and an iterative numerical solution. Magn Reson Med. 1999;41(1):179-186.
11. Avants B, Tustison N, Song G. Advanced Normalization Tools (ANTS). Insight J. 2009.
Figures