3235
Lung Imaging with Tiny Golden Angle UTE in Mice1Department of Internal Medicine II, Ulm University Medical Center, Ulm, Germany, Ulm, Germany, 2Core Facility Small Animal Imaging (CF-SANI), Ulm University, Ulm, Germany, Ulm, Germany
Synopsis
Lung imaging in small animals is particular difficult due to small anatomy dimensions, high respiratory and heart rate and the very short T2* value in high magnetic fields. A 2D tiny golden angle UTE sequence was tested in free-breathing healthy mice to generate high quality lung images. The functional ventilation and proton density was evaluated.
Purpose
To investigate the feasibility of applying a self-gated 2D tiny golden angle UTE (tyGA UTE) sequence for quantification of lung function in freely breathing healthy mice at 11.7T.Introduction
Lung imaging with MRI is particularly difficult in small animals due to the small dimensions of the anatomy and the high respiratory and heat rate (1). Additionally the T2* value is very short at a high magnetic field strength (2). Earlier studies showed, that sequences with short echo-time (TE) are promising for lung imaging with MRI (2–4).In this study a 2D tyGA UTE sequence was used to quantify lung function in free-breathing mice. Fractional Ventilation and proton fraction was derived from the lung parenchyma signal intensity in the different respiratory phases. For consideration of the rapid signal decay in the lung, the T2* value was quantified at 11.7T.
Methods
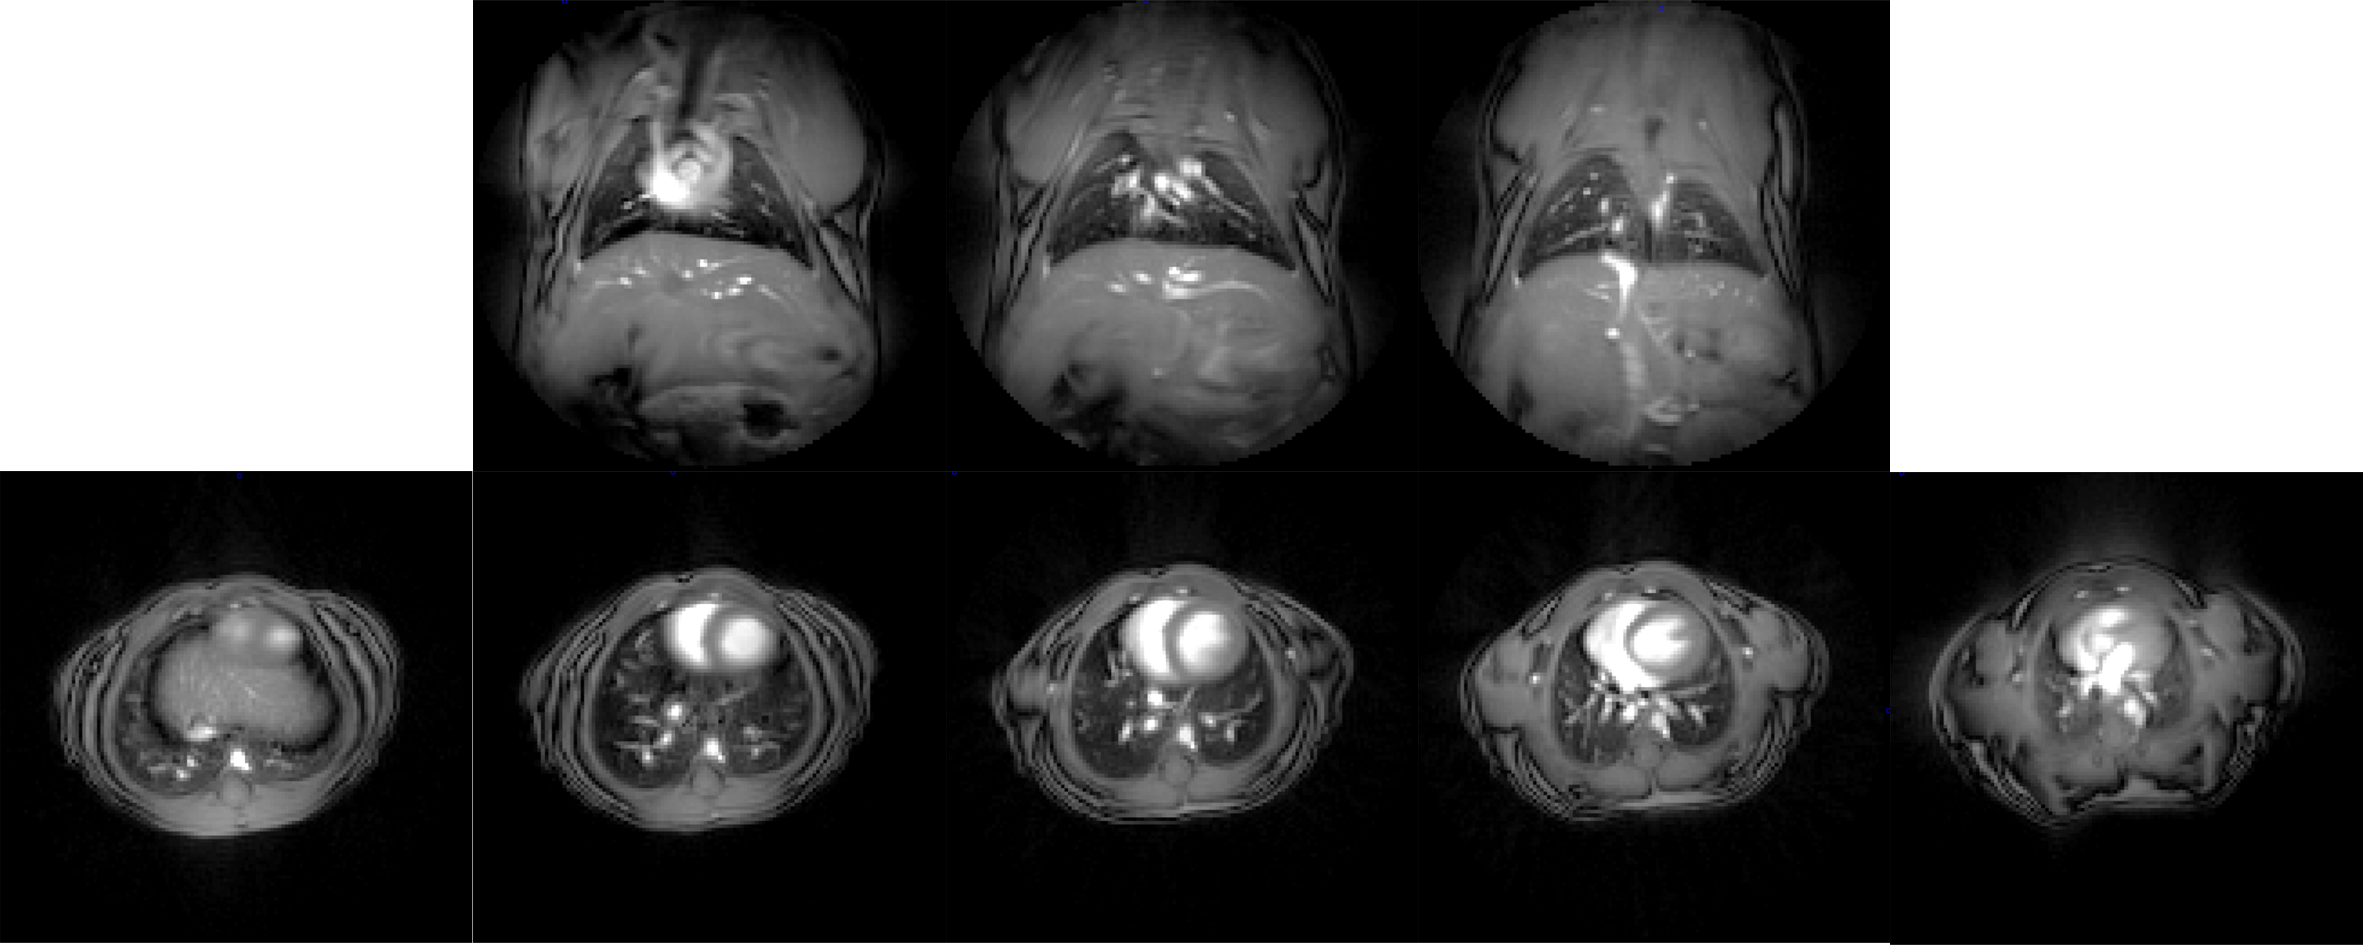
Data of seven female mice (mean age 12 weeks, mean weight 22.21g±1.09g at the beginning of the study) were acquired on a 11.7T small animal MR system (BioSpec 117/16, Bruker Biospin, Ettlingen, Germany). The animals were anesthetized with isoflurane (5% for induction, 1%-1.5% to maintain the respiratory frequency between 100-120 respiratory cycles per minute) in medical air (0.1 L/min). The 2D tyGA UTE were acquired in three coronal and five axial slices (Figure 1). The acquisition parameters were: TE = 0.253ms, TR = 4ms, TACQ = 6min per slice, # projections = 90190, BW = 250kHz, FA = 8°, slice thickness sD = 1mm, matrix = 150x150, FOV = 30mmx30mm, resolution = 0.2²mm², tiny golden angle ψ7 (5). The images were reconstructed with an in-house reconstruction framework implemented in Matlab. The self-gating data for respiratory motion were derived from the k-space centre (DC) intensities and the data were sorted into end-expiration (EX) and end-inspiration (IN) (3,6).For quantification of the T2* value a 3D UTE sequence with FOV = 30mmx 30mmx30mm, matrix = 128x128x128, TR = 4ms, FA = 3.9°, BW = 100kHz, # projections = 51360, resolution = 0.234³mm³ and ten different TE (TE = 0.008, 0.015, 0.02, 0.05, 0.1, 0.25, 0.5, 0.75, 1.0 and 1.5ms) was used. The images were reconstructed by the vendor’s reconstruction. The T2* was evaluated in four different lung ROI (tow in the right lung and two in the left lung) and in three different slice positions (anterior, middle and posterior).
Results
The T2* mapping was successfully. With the 2D tyGA UTE sequence is was possible to generate high-quality lung images in all animals. With the self-gating algorithm artefact-free EX and IN images could be reconstructed.The evaluation of the T2* value showed significant differences (p<0.05) between right (0.21ms ± 0.06ms) and left lung (0.20ms±0.05ms). The mean value over all ROI was 0.20ms±0.05ms. This value was used for the subsequent proton fraction calculation.
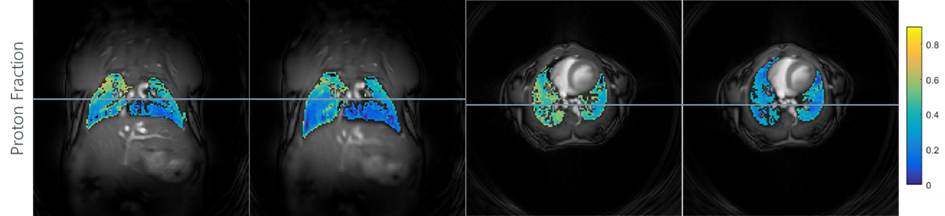
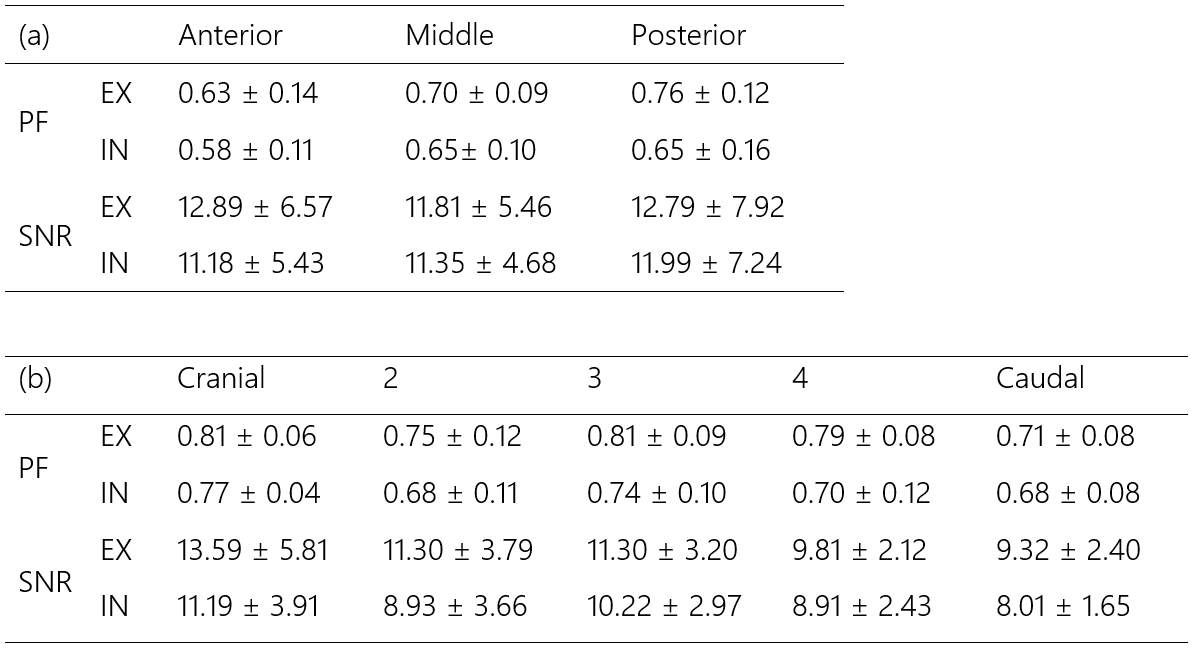
A significant difference (p<0.05) resulted between the signal intensities in EX and IN. The calculation of fractional ventilation (FV) maps was possible. The mean value for FV in axial orientation was 0.19±0.09. The values increased from cranial to caudal. The values in coronal slice orientation were almost constant over the slice position with a mean value of 0.31±0.13. The proton fraction values increased from caudal to cranial and from anterior to posterior as shown in Table 1. Figure 2 shows PF maps for EX and IN. which resulted significantly different (p<0.001). The SNR values showed an increase from caudal to cranial (p<0.001). In coronal slice orientation the SNR was independent on the slice position (Table 1). The difference between EX and IN was significant only for the axial slice orientation (p<0.001).
Discussion and Conclusion
With 2D tyGA UTE it is feasible to generate lung images in small rodents with sufficient quality to quantify lung density (PF) and function (FV) at 11.7T. Self-gating can be applied to reconstruct images in EX and IN with low artifact level. The images revealed respective changes of the lung parenchyma density. The high values of the proton fraction are in concordance with earlier reported values (7). In principle, lung density and fractional ventilation can be derived from a single continuous scan with minimal motion artifacts, due to the intrinsic properties of the center-out technique and uniform coverage of k-space due to tyGA angular ordering. It indicates the potential role of 2D tyGA UTE for functional lung imaging in small animals.Acknowledgements
The authors thank the Ulm University Center for Translational Imaging MoMAN for its support.References
1. Takahashi M, Kubo S, Kiryu S, Gee J, Hatabu H. MR microscopy of the lung in small rodents. Eur. J. Radiol. 2007;64:367–374.
2. Bianchi A, Tibiletti M, Kjørstad A, et al. Three-dimensional accurate detection of lung emphysema in rats using ultra-short and zero echo time MRI. NMR Biomed. 2015;28:1471–1479.
3. Tibiletti M, Kjørstad A, Bianchi A, Schad LR, Stiller D, Rasche V. Multistage self-gated lung imaging in small rodents. Magn. Reson. Med. 2016;75:2448–2454.
4. Tibiletti M, Bianchi A, Kjørstad \AAsmund, Wundrak S, Stiller D, Rasche V. Respiratory self-gated 3 D UTE for lung imaging in small animal MRI. Magn. Reson. Med. 2017;78:739–745.
5. Wundrak S, Paul J, Ulrici J, Hell E, Rasche V. A small surrogate for the golden angle in time-resolved radial MRI based on generalized fibonacci sequences. IEEE Trans. Med. Imaging 2014;34:1262–1269.
6. Paul J, Divkovic E, Wundrak S, et al. High-resolution respiratory self-gated golden angle cardiac MRI: comparison of self-gating methods in combination with k-t SPARSE SENSE. Magn. Reson. Med. 2015;73:292–298.
7. Tibiletti M, Rasche V. Respiratory self-gated estimation of gas/tissue fractions with SF6 and proton lung imaging in free breathing mice. In: ISMRM 25th Annual Meeting & Exhibition, Honolulu; 2017.
Figures